

Abstract
Connective tissue progenitors (CTPs) are a promising therapeutic agent for bone repair. Hyaluronan, a high molecular mass glycosaminoglycan, has been shown by us to be a suitable biomarker for magnetic separation of CTPs from bone marrow aspirates in a canine model. For the therapy to be applicable in humans, the magnetic separation process requires scale-up without compromising the viability of the cells. The scaled-up device presented here utilizes a circular Halbach array of diametrically-magnetized, cylindrical permanent magnets. This allows precise control of the magnetic field gradient driving the separation, with theoretical analysis favoring a hexapole field. The separation vessel has the external diameter of a 50 mL conical centrifuge tube, and has an internal rod that excludes cells from around the central axis. The magnet and separation vessel (collectively dubbed the hexapole magnet separator, or HMS) was tested on four human and four canine bone marrow aspirates. Each CTP-enriched cell product was tested using cell culture bioassays as surrogates for in vivo engraftment quality. The magnetically enriched cell fractions showed statistically significant, superior performance compared to the un-enriched and depleted cell fractions for all parameters tested, including CTP prevalence (CTPs per 106 nucleated cells), proliferation by colony forming unit (CFU) counts, and differentiation by staining for the presence of osteogenic and chondrogenic cells. The simplicity and speed of the HMS operation could allow both CTP isolation and engraftment during a single surgical procedure, minimizing trauma to patients and lowering cost to health care providers.
Graphical abstract
Authors are required to submit a graphic entry for the Table of Contents (TOC) that, in conjunction with the manuscript title, should give the reader a representative idea of one of the following: A key structure, reaction, equation, concept, or theorem, etc., that is discussed in the manuscript. Consult the journal’s Instructions for Authors for TOC graphic specifications.

INTRODUCTION
Connective tissue progenitor cells (CTPs) are considered therapeutic for regenerative medicine.1–3 They are rare, found at an average prevalence of 1 in 20,000 nucleated cells in the bone marrow,4–5 but with significant variability between individuals. Enrichment of such rare cells is difficult. Complex and prolonged procedures, typically required for isolation of rare cells, would adversely affect the quality of a cell product intended for therapeutic transplantation and limit its utility for clinical applications. Simple and rapid methods are therefore sought that meet strict criteria of clinical safety and efficacy. A cell separation method that can be used intra-operatively (in the operating room during the time of surgery) is preferable. An ideal scenario includes the surgical removal of bone marrow followed by the isolation of the CTPs and engraftment of the enriched cell product during a single procedure, thus eliminating the need for a second surgical intervention with the associated trauma to the patient as well as lowering the cost to the health care provider. An equally important consideration is the preservation of the CTP biological activity in the enriched fraction intended for bone engraftment, particularly the ability to engraft in host tissue, proliferate to expand the number of their progeny, differentiate into a desired tissue (e.g. bone, cartilage, fat, etc.). CTPs are heterogeneous with respect to differentiation potential, and can conceptually be characterized with respect to osteogenic potential (CTP-O), chondrogenic potential (CTP-C) or adipocytic potential (CTP-A). The progeny of any individual CTP will have the potential to express one or more of these attributes, in a given in vitro or in vivo biological environment. Our previous research showed that bone marrow cells expressing hyaluronan constitute a very promising class of progenitor cells with multipotential characteristics.6–7 They were found to be relatively easy to label with magnetic beads and separate from bone marrow aspirates by application of magnetic fields.
We have built and tested an open gradient magnetic separation device designed for ease of use and amenable to rational investigation of the cell separation rate required for an intra-operative cell separator. The magnet design features an axisymmetric magnetic field providing a high field and field gradient for cell separation. The separation vessel has an axial rod inside that excludes the cell suspension from a region around the central axis where the magnetic field and field gradient approach zero and where labeled cells would therefore migrate very slowly. The cell suspension occupies the annular space between the axial rod and the outer vessel wall. An example of an axisymmetric field is the quadrupole field used in mass spectrometry,8 high energy physics,9 high volume industrial separation,10 and magnetic separation of rare circulating tumor cells.11 In principle, higher order multipole fields (hexapole, octupole, etc.) can be utilized that generate higher field gradients close to the outer wall of the separation vessel. Higher order fields do not necessarily result in higher sample processing rate, however, since both field and field gradient decrease more rapidly toward the aperture axis. Theoretical modeling of the processing rate is used to determine the optimum field for fast cell separation.
The generation of axisymmetric fields has typically been achieved with an arrangement of rectangular magnet blocks and hyperbolic-profiled, soft iron pole-pieces.12–13 This would require complicated design and construction for each n-tupole field. We have therefore considered designs devoid of iron pole pieces, as proposed originally by Klaus Halbach.14 An ideal Halbach cylinder or “ring” magnet has a continuous rotation of magnetization vector around the aperture. To generate a uniform magnetic field inside the aperture, the magnetization vector must rotate at twice the rotation angle about the ring (equivalent to a single full positive rotation relative to that of a vector away from the axis). The manufacture of such ring magnets with continuously varying magnetization vector is not practical. However, the continuously rotating magnetization vector may be approximated by a circular arrangement of discrete magnets. For example, trapezoidal magnets may be placed in contact around the circumference.14–15 These designs may require that some of the trapezoids be magnetized at angles not parallel to any surface, requiring costly custom fabrication. Again, each of the n-tupole aperture magnets would require a certain fixed design and construction. An alternative approach is to use a circular array of magnets of square cross section. The magnets may be rotated and locked into positions to generate a uniform field or any axisymmetric field as desired.16–17 Diametrically magnetized, cylindrical, rare-earth magnets are now commercially available and are ideally suited to such an approach. A closely spaced circular array of cylindrical magnets gives a more efficient packing of magnetic material around the aperture, and generates a higher field and field gradient than a circular array of rectangular magnet blocks. Such an arrangement of cylindrical magnets has been proposed for the generation of a uniform internal field that may be rotated by collectively rotating the magnet cylinders.18–19 A specific arrangement of four cylindrical magnets with gears controlling their relative orientations has also been constructed that can generate a uniform field of variable strength.20 From our perspective, the advantage of the approach lies in the ability to change the magnet orientations to generate a variety of axisymmetric fields without having to construct a new device.
For our study, an aperture magnet based on these design ideas was constructed for the purpose of cell separation. A combination of theoretical design analysis and experimental verification led to a robust, high CTP enrichment rate from human and canine bone marrow aspirates.
THEORY
The concept of the circular array of cylindrical magnets for generating different axisymmetric fields has been presented previously.21 As mentioned above, an internal dipole (giving rise to a uniform field) requires a single positive rotation of magnetization vector relative to the vector away from the axis. A quadrupole requires two full rotations, a hexapole three full rotations, etc. The field profile therefore depends on the number of cylindrical magnets about the circumference Ncyl, and the angular increment to the direction of magnetization between adjacent units.
Suppose there are Ncyl cylindrical, evenly spaced magnets arranged in a circle about an origin. Arbitrarily setting the center of one of the cylinders on the x-axis (at θ = 0), the centers of the magnets will lie at angles θi = 2π(i−1)/Ncyl radians about the origin for i = 1 to Ncyl. The direction of magnetization of the successive magnets must progress at regular intervals around the aperture to make 2, 3, 4 or more full rotations (a single rotation of 2π radians is not useful). The direction of magnetization for the successive magnets is given by
| (1) |
where Np is the number of internal poles and is always an even number. The direction of magnetization φ1 for the first magnet is arbitrary; it has only a subtle effect on the very small departures of the field from symmetry about the axis. In summary, it is necessary only that
| (2) |
where Δθ is the interval in angular position of the magnets and Δφ is the interval in direction of magnetization vectors of the magnets. For Np internal poles, the number of external poles is equal to 2Ncyl −Np. It is possible to generate a uniform (dipole) or a quadrupole field using just three magnets, but this would be an inefficient use of the magnets. In general, there must be at least (Np+2)/2 magnets to generate Np internal magnetic poles (for Np ≥ 4). The use of just (Np+2)/2 magnets would produce an external dipole. The external field may be made more compact by increasing the number of magnets used over this minimum. In any case, external stray field is easily screened without significantly changing the internal field.
The number and size of cylindrical magnets used to generate an axisymmetric field does have some influence on the maximum field generated at the wall of the aperture. Magnet size is limited by the space available for them. There will be an optimum number of cylindrical magnets for each field (giving highest peripheral field strength and greatest symmetry about the axis), and this number will depend on the spacing between the magnets and between the magnets and the aperture. (Some spacing is required for the structure holding the magnets in place and in the correct orientations.) In practice, the number of magnets will often be determined by the required size of the aperture and the sizes of magnets that are commercially available. This is considered in more detail in the Supporting Information (see Tables S1, S2, and S3 and discussion).
The sample processing rate Rsp for magnetic cell separation in an annular vessel placed in an axisymmetric field may be defined as the volume of the cell suspension V divided by the time for a magnetically-labeled cell to traverse the vessel from the inner wall (the axial rod) to the outer wall tw. Equations for migration times of cells labeled with either paramagnetic or magnetically saturated particles across various axisymmetric fields have been presented previously.21 The approach may be extended to superparamagnetic labels by considering a suitable relationship between magnetization M and magnetic field B. The ideal relationship for monodisperse superparamagnetic particles follows a Langevin function but the curve for a real sample often deviates from this. We have previously used a relationship of the form M = C1B/(1+C2B+C3B2) to fit to experimental data.22 A typical curve for superparamagnetic nanoparticles published by Yamaura et al.23 yielded best-fit coefficients of C1 = 9.152×10⁶, C2 = 27.30, C3 = −0.9229 for M having units of A/m and B units of T. The C3B2 term contributes relatively little to the goodness of fit, and the same data may be fitted quite well to a function of the form
| (3) |
where Ms is the saturation magnetization and C is a coefficient having units of T. A best-fit Ms of 339000 A/m and C of 0.0371 T were obtained for B up to 0.6 T. The data points extracted from the published curve23 and this best-fit curve are shown in Figure S1 in the Supporting Information.
Local cell velocity under the influence of a magnetic field is given by
| (4) |
where Vm is the volume of superparamagnetic material bound to the cell, M is the local magnetization of this material, |∇B| is the magnitude of the local field gradient, and f is the friction coefficient for the cell motion through the suspending fluid. The migration time tw across the annular width is then obtained by solving the equation:
| (5) |
where ro is the internal radius of the vessel outer wall, ρ is the radial position r relative to ro (ρ = r/ro), and ρi is the ratio of the inner radius to the outer radius. For the axisymmetric fields, the local field is ideally given by
| (6) |
where Bo is the field at the internal radius of the outer wall, and n = 1 for a quadrupole field, 2 for a hexapole, 3 for an octopole, etc. It follows that |∇B| = (nBo/ro)ρn−1. It is then simple to solve the integral of eq (5) to obtain tw. The volume of cell suspension is easily obtained as πro2(1−ρi2)h, where h is the height of the fluid volume in the vessel. The general result for processing rate may be written as
| (7) |
Note that for the special case of n = 1 (corresponding to Np = 4, quadrupole field), the term must be replaced by its limit 2ln(1/ρi), and for n = 2 (Np = 6, hexapole field), the term must be replaced by ln(1/ρi). For each field type, the Rsp decreases as ρi is reduced because both field and field gradient (for Np ≥ 6) get smaller with approach to the axis; the increase in volume as ρi approaches zero is more than offset by the greatly increasing migration time. This is not a serious problem because even at ρi = 0.4 the volume V of the annular vessel is already 84% of the total internal volume V0. A factor that must be taken into account when comparing Rsp for different axisymmetric fields is that Bo will be different for each case. This Bo does not correspond to a position close to the magnets but to a position just inside the vessel wall, and B decreases more rapidly for the higher order axisymmetric fields.
MAGNET AND VESSEL DESIGN
The external diameter of the vessel was selected to match that of a 50 mL conical centrifuge tube, fixing the aperture diameter at 1.17 inch (29.8 mm). For reasons explained in the Supporting Information, the aperture was circled by ten 0.5-inch diameter cylindrical magnets mounted on a supporting structure, allowing 0.030 inch spacing between the aperture and the magnets. The spacing between the magnets was 0.035 inch. The cross-section of the arrangement can be seen in Figure 1. Two concentric circles are drawn in the figure within the array of magnets, the outer corresponding to the aperture in the supporting aluminum plates, and the inner to the inner wall of the vessel. Figure 1 also shows predicted field lines for the magnets oriented to generate a hexapole field (calculated using Finite Element Magnetic Modeling, FEMM, by Meeker24 with the 40 MGOe magnet properties of the included materials library). The six internal and fourteen external poles are apparent. Figure 1 also shows a color contour map of this predicted hexapole field and the axisymmetric nature of the field is clearly seen. There is a small periodic variation of predicted B with θ that is most pronounced close to the magnets. This is explored in more detail in the Supporting Information (see Figures S2 and S3).
Figure 1.
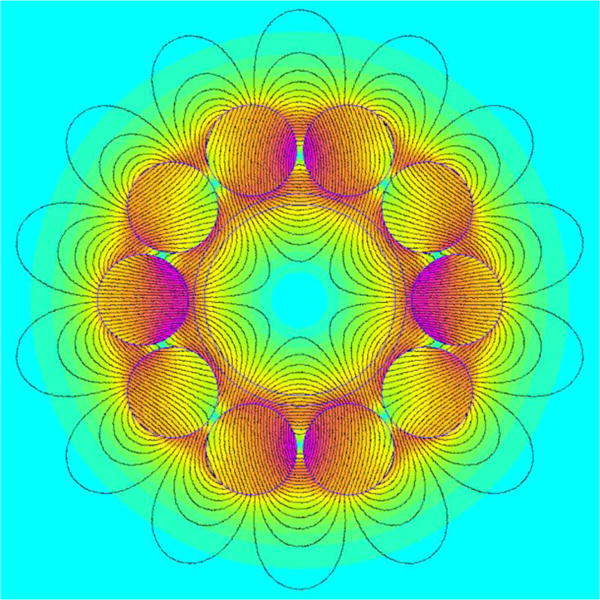
Model of hexapole field generated by circular array of ten cylindrical magnets predicted using FEMM software package.
Once the magnet number, size and placement were fixed, the different magnet orientations to generate quadrupole, hexapole, octopole, and decapole fields could be modeled. In every case the predicted field at ro of 0.526 inch (allowing for a vessel wall thickness of 0.060 inch) showed only small periodic variation with θ (approximately ±4%, ±3%, ±5%, and ±2% for quadrupole to decapole, respectively). Mean predicted Bo values were obtained: 0.638 T, 0.582 T, 0.473 T, and 0.360 T for quadrupole to decapole; most of the difference being due to the faster decay of B with the higher order fields. Taking these values for Bo, the predicted Rsp curves could be calculated according to eq (7). These are shown in Figure 2 plotted as dimensionless rates Rspf/hVmMsBm (where Bm = 0.630 T is the uniform field throughout a single isolated 40 MGOe cylindrical magnet, FEMM materials library) versus ρi. The Rsp for a decapole field is seen to be inferior to that for an octopole even at high ρi due to the reduced Bo. The sample volume must also be considered in selection of system parameters and the curve describing the fractional volume of the annular vessel as a function of ρi (referring to the right hand axis) is also included in Figure 2. Even though Rsp increases as ρi increases, the volume of the annular vessel falls quite quickly at higher ρi. The higher Rsp obtainable at high ρi may not justify the inconvenience if multiple procedures that may then be required to process a given sample volume. The Rsp for an octopole field is predicted to be higher than for a hexapole field only for ρi > 0.74, equivalent to V/V0 < 0.467. It is apparent that for ρi from 0.35 to 0.74 (0.878 > V/V0 > 0.452) the hexapole field provides the highest predicted Rsp. The quadrupole was predicted to be superior for ρi < 0.35 (V/V0 > 0.878), but Rsp would be relatively low for this range. The hexapole field was therefore selected as optimum with ρi set at approximately 0.4.
Figure 2.
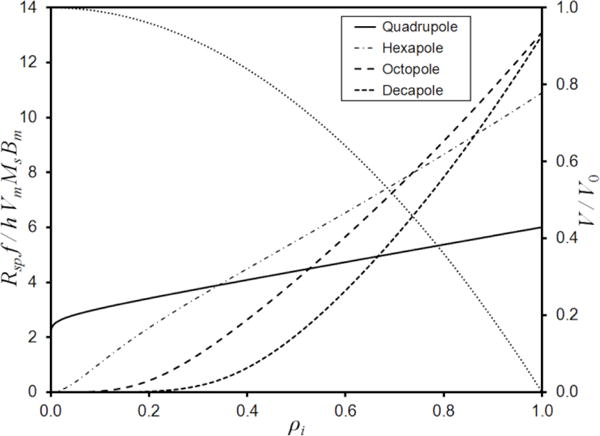
The predicted dimensionless sample processing rates as functions of ρi for quadrupole, hexapole, octopole, and decapole fields generated by a circular array of ten cylindrical magnets. The dotted curve refers to the right hand axis and shows the fractional volume of the vessel as a function of ρi.
EXPERIMENTAL SECTION
Magnetic separation device
The hexapole magnet was constructed using four identical subassemblies. Each subassembly was comprised of an aluminum plate (0.375 inch thick) with a central circular hole of 1.17 inch diameter (the aperture) surrounded by ten 0.501 inch diameter holes into which were inserted NdFeB magnets (0.5 inch diameter × 1.0 inch length, with nominal magnetic energy product of 42 MGOe, Applied Magnets, Plano, TX). The magnets were oriented such that φ1 = 0° and Δφ = 144°, locked in place using non-magnetic setscrews. The centers of the magnets are 0.866 inch from the center of the aperture. This left a spacing of 0.030 inch between the magnets and the aperture, and 0.035 inch between the magnets. The radial component of magnetic field Br adjacent to each of the ten magnets in each subassembly was measured using a Model 6010 Gauss/Tesla meter (SYPRIS, Test & Measurement, F. W. Bell, Orlando, FL) with Hall-effect probe. It was estimated that due to its size and thickness the probe measured Br at a radius of 0.561 inch when in contact with the aperture wall. There was little variation between subassemblies and the mean values of Br were found to be in excellent agreement with predictions (see Supporting Information Figure S4). The four subassemblies were stacked axially, making sure that the magnet orientations matched. They were firmly bolted together using four stainless steel threaded rods inserted through the supporting plates and using non-magnetic nuts and washers. The aperture had a length of 4 inch corresponding to the four stacked sets of magnets. A photograph of the completed magnet assembly is shown in Figure 3A.
Figure 3.
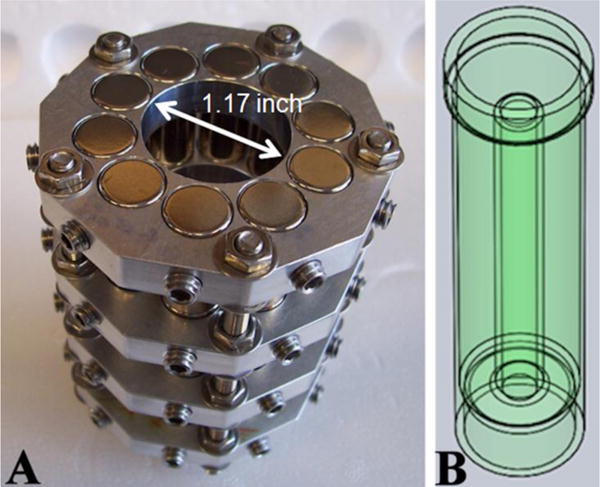
A) The hexapole magnet assembly. B) An engineering drawing of the cell separation vessel.
The sample vessel with a central exclusion rod was built by 3D printing (Spectrum Plastics Group, Protogenic Division, Westminster, CO) using the resin Somos WaterShed 11122XC (DSM, Elgin, IL). WaterShed is optically clear, ABS-like, biocompatible, and has minimal water uptake. The internal radius ro was 0.526 inch, with wall thickness of 0.060 inch, the minimum practical thickness for this type of construction. The rod diameter was 0.432 inch (corresponding to ρi = 0.41) and its height was 3.8 inch. When mounted in the magnet the sample was fully contained within the axial extremities of the magnet assembly to minimize B field end effects. The maximum sample volume was approximately 45 mL. An engineering drawing of the vessel is shown in Figure 3B. A second vessel having an axial rod of 0.216 inch diameter was also constructed and used in some experiments.
Bone marrow aspirates
Human Subjects
Bone marrow samples were donated for research purposes by four patients undergoing surgery in the Cleveland Clinic and collected according to approved Institutional Review Board protocol and informed consents. The marrow was collected in 2-mL aliquots from the iliac crest (total of 35 to 40 mL per patient) and pooled in heparinized media. Bone marrow mononuclear cells (BMMNCs) were isolated by centrifugation (buffy coat) and re-suspended in the separation buffer consisting of phosphate buffered saline (PBS), 2% fetal bovine serum (FBS), and 0.5 mM sodium salt of ethylene diamine tetra-acetic acid (EDTA), subsequently used as a starting material (also referred to as a “buffy”) for magnetic separation of CTPs All standard media were obtained from the Media Preparation Core, Research Core Services, Lerner Research Institute, Cleveland Clinic.
Vertebrate Animals (Canines)
All animal procedures were approved by the Cleveland Clinic Institutional Animal Care and Use Committee. The bone marrow aspirates were obtained in 2-mL aliquots from the proximal humeri of four canines (total of 35 to 40 mL per dog). The BMMNCs were isolated and processed similarly to human bone marrow aspirates.
Magnetic labeling and separation of cells expressing hyaluronan
Bone marrow buffy coats containing between 0.3×10⁹ and 2.1×10⁹ cells were suspended in approximately 5 mL of separation buffer (PBS, free of Ca2+ and Mg2+ ions containing 2% FBS (Invitrogen), and 0.5 mM EDTA (Sigma Aldrich)). 20 to 50 μg of biotinylated hyaluronan binding protein (HABP, Calbiochem) was added to the cell suspension, along with 0.8 to 1.0 mL of FcRγ-blocker from Easysep™ Biotin kit (STEMCELL Technologies Inc.) and incubated for 1 hour at room temperature (RT) on a rotator. The suspension was washed with the separation buffer by making up the volume to between 15 and 20 mL, and centrifuging at 350 g at RT, for 10 minutes. The supernatant was aspirated out and the cell pellet was re-suspended in another 4 to 5 mL of separation buffer. Approximately 1.0 mL of biotin cocktail provided in the Easysep Biotin kit was added to the cell suspension, and incubated as above for 15 minutes. Approximately 500 μL of magnetic nanoparticles provided in the Easysep Biotin kit was then added to the cell suspension, with an additional incubation for 10 minutes. The cell suspension was diluted to obtain up to 35 mL in the separation buffer and poured into the magnetic separation vessel. The vessel with the cell suspension was placed in the hexapole magnet aperture for 15 minutes, the length of time required for the magnetically labeled CTPs to reach the outer wall of the vessel as predicted from cell tracking velocimetry measurements and hexapole field properties (see discussion in the Supporting Information). CTPs are known to be readily and rapidly adherent to plastic and other surfaces,6 and this can help to retain captured CTPs during the subsequent washing steps. The cells remaining in the bulk of the cell suspension were poured out while the separation vessel remained in the magnet. This fraction was labeled as HA−. The fraction captured by the magnetic force on the outer wall of the separation vessel, labeled as HA+, was subjected to an additional two washes (without re-suspension) in order remove any HA− cells that may have been trapped by non-specific adhesion forces. Thus, another 30 to 35 mL of the separation buffer was added to the vessel, incubated for 10 minutes and poured out as above, this fraction labeled as HA2−, and the procedure repeated, resulting in a fraction HA3−. Subsequently, the separation vessel was removed from the magnet and the cells retained on the wall of the vessel were re-suspended in 5 mL to 10 mL of the separation buffer, labeled as HA3+.
Cell characterization
The original aspirate and processed cell fractions were characterized based on cell concentration and by colony forming unit (CFU) assay measuring proliferation and differentiation (osteogenic, chondrogenic, and adipogenic). CTP prevalence in the cell sample (CTPs per million nucleated cells), cell and CTP yield, and fold enrichment of CTPs (ratio of the CTP prevalence post-to-pre separation) were calculated from these data. The cell colony counts were automated by colony image acquisition and computer-assisted image analysis using a specialized software package (Colonyze™). Recovery of cells in the separated fractions was calculated for each separation step and for the whole separation procedure as a ratio of post-to-pre cell counts.
The morphology of individual colonies was analyzed for features characteristic of all three lineages (osteogenic, chondrogenic, and adipogenic). The details are given in the Supporting Information.
RESULTS
Results from human and canine bone marrow aspirates were combined for data analysis purposes because the methods of CTP isolation and data reduction were identical for the two types of sample. The only difference was that plating density was decreased (0.25×10⁶ cells as opposed to 0.5×10⁶ cells) for canine samples due to the tendency for greater CTP prevalence than the human samples (as illustrated in the pre-separation fractions in Table 1). The magnetic isolation using the HMS resulted in significantly higher number of colonies derived from HA3+ fractions, reported as CTP prevalence, compared with original bone marrow buffy sample (p = 0.028, Mann-Whitney test, Ns = 8, Figure 4A). The enrichment in the HA3+ fraction is also evident from the images of cell cultures. Figure 4B shows a representative image set for pre-separation buffy coat, HA3−, and HA3+ fractions. Examples of distributions of CTPs in all five cell fractions (pre-separation buffy coat, HA−, HA2−, and HA3−, and HA3+ fractions) are shown in the Supporting Information (Figure S5A and Table S4). The overall enrichment of CTPs in the HA3+ fractions compared to the bone marrow buffy was 3.0 fold, the associated decrease of CTPs in the HA3− fraction was 0.5 fold, and the difference between the two fractions was significant (p = 0.054, Ns = 8, paired Student t-test; Figure S5B). The data are summarized in Table 1 for both human and canine bone marrow aspirates. Although all experiments except for one (sample 8, Table 1) showed enrichment of CTP in the magnetically separated fraction, there were appreciable differences in HA3+ enrichment rates between individuals (note the outlier sample 1 in Figure S5B). It was noted that low enrichment rates were derived from samples that had developed large cell aggregates (clusters) during processing. Cell aggregates were present in three out of the eight samples. These aggregates were large and settled to the bottom during the separation process and were easily separated by decanting the cell suspension. The observation was consistent with the mechanism of the cell separation since the CTPs trapped in the cluster matrix would be removed from the separation vessel with the HA−, HA2−, or HA3− fractions rather than being retained in the HA3+ fraction. Furthermore, upon analyzing the cells trapped in these clusters, it was found that they indeed contain high numbers of CTPs (Supporting Information Table S5, sample 6).
Table 1.
Summary of experimental results showing cell number distribution between original and magnetically separated connective tissue progenitor (CTP) cell fractions (a total of eight experiments). Samples 1 to 4 derived from human patients and samples 5 to 8 from canines.
| Sample | Pre separation buffy coat | Post separation HA3+ fraction | ||||||
|---|---|---|---|---|---|---|---|---|
| Counts* | CTP | %CTP | Counts* | % recovery | CTP | %CTP | Enrichment | |
| 1 | 300.0 | 30,978 | 0.0103 | 10.440 | 3.48 | 3,269 | 0.0313 | 3.0 |
| 2 | 886.2 | 33,706 | 0.0038 | 10.169 | 1.15 | 6,886 | 0.0677 | 17.8 |
| 3 | 2,056 | 29,053 | 0.0014 | 130.000 | 6.32 | 5,520 | 0.0042 | 3.0 |
| 4 | 892.0 | 23,257 | 0.0026 | 84.100 | 9.43 | 9,048 | 0.0108 | 4.1 |
| 5 | 300.0 | 61,957 | 0.0207 | 7.500 | 2.50 | 6,630 | 0.0884 | 4.3 |
| 6# | 1,467 | 548,686 | 0.0374 | 145.000 | 9.88 | 93,331 | 0.0643 | 1.7 |
| 7 | 1,221 | 172,476 | 0.0141 | 66.338 | 5.43 | 23,939 | 0.0361 | 2.6 |
| 8 | 1,062 | 362,439 | 0.0341 | 99.139 | 9.34 | 34,914 | 0.0352 | 1.0 |
cell counts in millions
CTP enrichment rates listed for this sample are the result of HA3+ counts, as for the other samples. However, this sample had clusters that were further processed and found to contain large number of CTPs. For details see Supporting Information Table S5.
Figure 4.
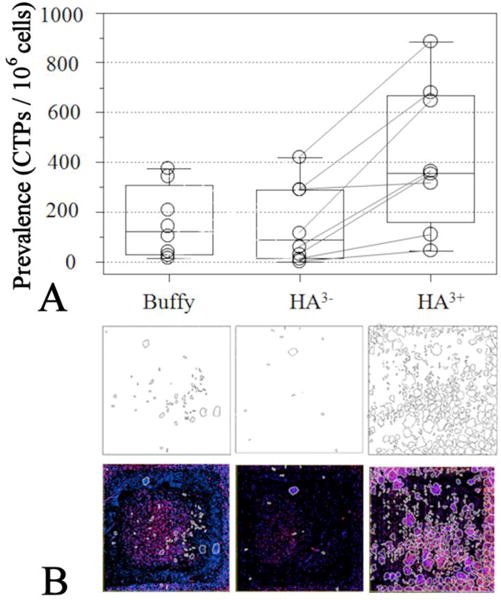
Quantitative and qualitative assessments of CTPs in different fractions. A) Prevalence of CTPs, defined at number of colonies per million cells plated, in different fractions. B) Low magnification images showing the areas covered by colonies in the Lab-Tek™ chambers (each 2 cm × 2 cm). The cell colonies are outlined in black in top panels and white in the bottom panels; the blue color is from nuclei of the cells in the colonies, and red is for alkaline phosphatase showing osteogenic progenitors. The panels left to right correspond to pre-separation buffy coat, HA3− and HA3+, respectively.
One of the important observations, as noted previously,7 was the partitioning of colony forming cells into the HA3− fraction in addition to the HA3+ fraction. In order to understand whether this was an inherent difference in the properties of the cells or due to a random difference in the separation process, the cells from each fraction were expanded and studied for morphology and other microscopic properties. The cells isolated from HA3+ and HA3− fractions from a human bone marrow sample were plated, and incubated as described in the Supporting Information. The HA3+ cells grew rapidly and expand from 9,000 cells to 2.6 million in 15 days with 2 passages.
Cells from HA3− fraction were slow in their apparent growth (qualitative observation). Their colonies also differed morphologically from those derived from HA3+ fractions. Most of the HA3− colonies exhibited rounded or cuboidal morphology (Figure 5A) as compared with elongated, spindle shaped morphology of cells from the HA3+ fraction (Figure 5B). The colonies from HA3+ fraction showed typical mesenchymal stem cell or marrow stromal cell morphology of elongated, fusiform cells.25
Figure 5.
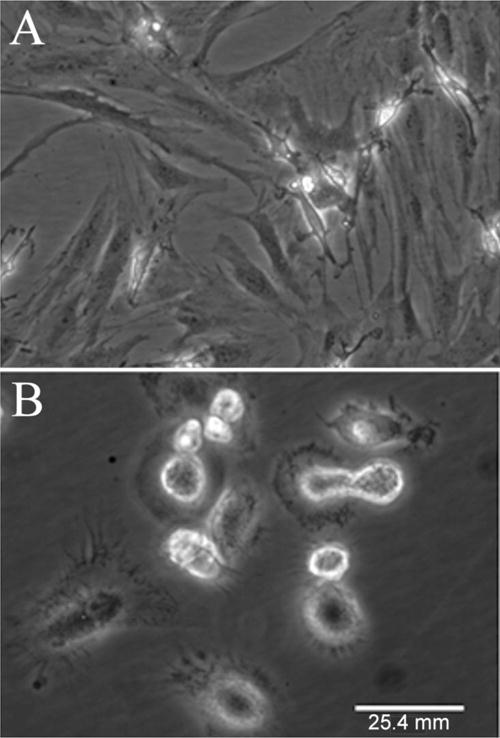
Photomicrographs showing different cell morphologies. A) Typical CTP colonies with elongated, fusiform cells from HA3+. B) Rounded, or cuboidal morphology of cells in several colonies from HA3−, suggesting different cell type from those of HA3+ fraction.
The expanded CTPs from HA3+ human bone marrow fraction at the end of second passage were plated with media specific for differentiation into each lineage and assessed qualitatively after staining with Alkaline Phosphatase (AP) for osteoblasts and Alizarin Red (AR) for mineralization; Acridine Orange (AO) for chondrocytes and Oil Red-O (ORO) for adipogenic lineage, as described in the Supporting Information. The cell culture morphology analysis showed (qualitatively) that the ex vivo expanded cells were capable of differentiating into all three lineages (Supporting Information, Figure S6). We observed robust AP staining for bone progenitors (Supporting Information, Figure S6A) and AR staining for mineralization (Supporting Information, Figure S6B) indicating robust bone forming potential. Similarly, AO staining showed large colonies of cuboidal cells with characteristic staining pattern of chondrocytes, indicating that these cells had the potential for cartilage formation (Supporting Information, Figure S6C). ORO staining for fat droplets inside the cells were also observed (Supporting Information, Figure S6D), though qualitatively to a lesser extent than AP, AR and AO staining for osteogenic and chondrogenic lineages.
DISCUSSION
It has been previously shown that magnetically enriched CTPs using hyaluronan as a CTP marker can be transplanted into a canine femoral defect model system leading to better healing of the defect.7 In order for the method to be accepted in the clinical setting, the magnetic separation process needs to be optimized for high cell sample processing rate without compromising the sterility and the viability of the cell product, and must be easy to use. Secondly, the cell product enriched in CTPs must not lose any of the proliferative and differentiation potential that are characteristic of CTPs in their native state in the bone marrow milieu. Preferably, the CTP separation method should be fast and simple enough to be performed in the operating room, ideally limiting the time from start to finish to the time that it takes a surgeon to obtain a bone marrow aspirate and prepare the recipient site for CTP engraftment (i.e., 1–2 hours). The circular Halbach array of cylindrical magnets polarized across their symmetry axes was selected as the preferred magnet configuration because of its flexibility in generating and controlling high field gradients in cylindrical volumes matching the typical laboratory tube geometry. Mathematical analysis led to a unique design of a matching cell separation vessel with excluded center volume that allowed the fastest cell separation for a given sample volume (bone marrow mononuclear cell fraction magnetically labeled for hyaluronan expressing cells). A hexapole magnetic field geometry was selected as the optimum, providing highest sample processing rate for an acceptable sample volume (up to 45 mL). The hexapole magnet separator (HMS) was capable of processing an entire volume of the bone marrow buffy coat by the simple action of pouring the cell suspension into the separation vessel and decanting the liquid (depleted of the HA expressing cells) in 15 minutes. Additional washes of the retained magnetic cells (concentrated on the vessel wall) to increase purity of the HA separand were equally simple. Currently, the buffy coat preparation takes around 30 minutes, magnetic labeling an hour and 30 minutes, and the separation about 30 minutes, a total enrichment time of 2.5 hours, which is within the practical limits of most major reconstructive procedures.
The hyaluronan-expressing CTP enriched fractions were biologically more active than the original buffy coat sample (and the CTP-depleted fraction) as determined by cell culture bioassays designed to predict quality of the CTP engraftment in clinical applications. In addition to the quantitatively higher prevalence of the CTPs, there were qualitative differences in the cell morphology between HA3+ and HA3− cell cultures, the hyaluronan expressing cells appearing as elongated, fusiform cells typical of mesenchymal stem cells or marrow stromal cells that were mostly absent in the HA depleted cell fractions. In particular, the CTP enriched fraction was capable of differentiating into therapeutically important osteogenic and chondrogenic lineages and less so into the therapeutically undesirable adipogenic lineage. Interestingly, the CFU prevalence and percent fraction of the CTP in the starting material for canine samples were higher than those in humans (Table 1). Nevertheless, the CTP enrichment worked equally well for the two types of sample, in support of our earlier work using canine bone marrow aspirates as surrogates of human bone marrow aspirates in a model of connective tissue regeneration.7
An important, potential limitation of the method is cell aggregation induced by the magnetic separation process (presence of clusters). Design and theoretical models for the apparatus and the separation were developed based on the ideal of single cell suspension. However, in cell suspensions where the nucleated cell density was 30–60 million per mL of buffer (between 1×10⁹ and 2×10⁹ cells), in addition to RBCs in the suspension, aggregates of cells appearing as large clots were observed during the CTP enrichment protocol. Aggregates appeared to form during the magnetic separation phase, trapping CTPs, resulting in CTP losses reflected in low enrichment rates for some samples. Aggregation was minimal when the cell densities were of the order of 20 to 22 million cells per mL. These differences in aggregation pattern may also be partly attributable to patient to patient variation. The effect of cell clustering on CTP enrichment (illustrated in Table S5) will require further analysis in future studies.
CONCLUSIONS
A simple to operate HMS device with a cell processing capacity in excess of 1 billion nucleated cells may enable intra-operative connective tissue progenitor (CTP) enrichment from bone marrow, potentially reducing the cost and improving the efficacy of cell transplantation procedures. The use of hyaluronan (HA) as the connective tissue progenitor (CTP) biomarker leads to interesting differences between HA3+ and HA3− cell fractions following magnetic separation of bone marrow aspirates. We have observed that the HA3+ fraction contains more progenitors from the osteogenic and chondrogenic lineages, and that there are appreciable differences in the cell morphology between those two fractions. Additional experiments would be required to further characterize the HA3+ CTP population, their biological potential and utility. Devices such as the one in this study (hexapole magnet separator, HMS) designed for optimal magnetic separation for a given target cell biomarker (HA) may provide a tool enabling rapid concentration and enrichment of functionally different CTP populations for further study in applications to intraoperative connective tissue progenitor isolation from bone marrow.
Supplementary Material
Acknowledgments
We thankfully acknowledge technical support of Boris Kligman. This research was sponsored by the National Institutes of Health award number R01CA062349 and Armed Forces Institute of Regenerative Medicine award number W81XWH-08-2-0034. The U.S. Army Medical Research Acquisition Activity, 820 Chandler Street, Fort Detrick MD 21702-5014 is the awarding and administering acquisition office. The content of the manuscript does not necessarily reflect the position or the policy of the Government, and no official endorsement should be inferred.
Footnotes
Supporting Information
Additional information as noted in text. This material is available free of charge via the Internet at http://pubs.acs.org.
References
- 1.Muschler GF, Midura RJ. Clin Orthop Relat Res. 2002;395:66–80. doi: 10.1097/00003086-200202000-00008. [DOI] [PubMed] [Google Scholar]
- 2.Muschler GF, Nakamoto C, Griffith LG. J Bone Joint Surg Am. 2004;86(7):1541–1558. doi: 10.2106/00004623-200407000-00029. [DOI] [PubMed] [Google Scholar]
- 3.Connolly JF. Clin Orthop Relat Res. 1995;313(1):8–18. [PubMed] [Google Scholar]
- 4.Majors AK, Boehm CA, Nitto H, Midura RJ, Muschler GF. J Orthop Res. 1997;15(4):546–557. doi: 10.1002/jor.1100150410. [DOI] [PubMed] [Google Scholar]
- 5.Muschler GF, Boehm C, Easley K. J Bone Joint Surg Am. 1997;79(11):1699–1709. doi: 10.2106/00004623-199711000-00012. [DOI] [PubMed] [Google Scholar]
- 6.Caralla T, Boehm C, Hascall V, Muschler G. Ann Biomed Eng. 2012;40(12):2559–2567. doi: 10.1007/s10439-012-0608-2. [DOI] [PubMed] [Google Scholar]
- 7.Caralla T, Joshi P, Fleury S, Luangphakdy V, Shinohara K, Pan H, Boehm C, Vasanji A, Hefferan TE, Walker E, Yaszemski M, Hascall V, Zborowski M, Muschler GF. Tissue Engineering Part A. 2013;19(1–2):125–134. doi: 10.1089/ten.tea.2011.0622. [DOI] [PMC free article] [PubMed] [Google Scholar]
- 8.Paul W, Steinwedel H. German Patent 944900, 1954. US Patent 2939952. Apparatus for separating charged particles of different specific charges. 1960
- 9.Mihara T, Iwashita Y, Kumada M, Evgeny A, Spencer CM. IEEE Trans Appl Supercond. 2004;14(2):469–472. [Google Scholar]
- 10.Doctor RD, Livengood CD. Open-gradient magnetic separation for physical coal cleaning: Results for Pittsburgh #8 and Upper Freeport coals. International Conference on Polution Prevention: Clean Technologies and Clean Products - The Environmental Challenge of the 1990’s; Washington, DC. 1990. pp. 228–235. [Google Scholar]
- 11.Zborowski M, Chalmers J. J Anal Chem. 2011;83(21):8050–8056. doi: 10.1021/ac200550d. [DOI] [PMC free article] [PubMed] [Google Scholar]
- 12.Blum EB, Halbach K. Nucl Instrum Methods Phys Res Sect A. 1992;320(3):432–438. [Google Scholar]
- 13.Zborowski M, Williams PS, Sun L, Moore LR, Chalmers JJ. J Liq Chromatogr Rel Technol. 1997;20(16–17):2887–2905. [Google Scholar]
- 14.Halbach K. IEEE Trans Nucl Sci. 1979;NS-26(3):3882–3884. [Google Scholar]
- 15.Halbach K. Nucl Instrum Methods. 1980;169(1):1–10. [Google Scholar]
- 16.Raich H, Blümler P. Concepts Magn Reson Part B: Magn Reson Eng. 2004;23B:16–25. [Google Scholar]
- 17.Hills BP, Wright KM, Gillies DG. J Magn Reson. 2005;175(2):336–339. doi: 10.1016/j.jmr.2005.04.015. [DOI] [PubMed] [Google Scholar]
- 18.Leupold HA. US Patent 6376959. Mangle magnetic structure. 2002:B1.
- 19.Coey JMD. J Magn Magn Mater. 2002;248(3):441–456. [Google Scholar]
- 20.Cugat O, Hansson P, Coey JMD. IEEE Trans Magn. 1994;30(6):4602–4604. [Google Scholar]
- 21.Williams PS. Separation and characterization of magnetic particulate materials. In: Thanh NTK, editor. Magnetic Nanoparticles: From Fabrication to Clinical Applications. CRC Press; Boca Raton, FL: 2012. pp. 301–332. [Google Scholar]
- 22.Carpino F, Zborowski M, Williams PS. J Magn Magn Mater. 2007;311(1):383–387. doi: 10.1016/j.jmmm.2009.02.065. [DOI] [PMC free article] [PubMed] [Google Scholar]
- 23.Yamaura M, Camilo RL, Sampaio LC, Macêdo MA, Nakamura M, Toma HE. J Magn Magn Mater. 2004;279(2–3):210–217. [Google Scholar]
- 24.Meeker DC. Finite Element Method Magnetics, Version 4.2. 2013 Nov 15; Mathematica Build. http://www.femm.info/wiki/HomePage.
- 25.Pittenger MF, Mackay AM, Beck SC, Jaiswal RK, Douglas R, Mosca JD, Moorman MA, Simonetti DW, Craig S, Marshak DR. Science. 1999;284(5411):143–147. doi: 10.1126/science.284.5411.143. [DOI] [PubMed] [Google Scholar]
Associated Data
This section collects any data citations, data availability statements, or supplementary materials included in this article.