

Abstract
Aims
Hyperphosphorylated tau neuronal cytoplasmic inclusions (ht-NCI) are the best protein correlate of clinical decline in Alzheimer’s disease (AD). Qualitative evidence identifies ht-NCI accumulating in the isodendritic core before the entorhinal cortex. Here, we used unbiased stereology to quantify ht-NCI burden in the locus coeruleus (LC) and dorsal raphe nucleus (DRN), aiming to characterize the impact of AD pathology in these nuclei with a focus on early stages.
Methods
We utilized unbiased stereology in a sample of 48 well-characterized subjects enriched for controls and early AD stages. ht-NCI counts were estimated in 60-μm-thick sections immunostained for p-tau throughout LC and DRN. Data were integrated with unbiased estimates of LC and DRN neuronal population for a subset of cases.
Results
In Braak stage 0, 7.9% and 2.6% of neurons in LC and DRN, respectively, harbour ht-NCIs. Although the number of ht-NCI+ neurons significantly increased by about 1.9× between Braak stages 0 to I in LC (P = 0.02), we failed to detect any significant difference between Braak stage I and II. Also, the number of ht-NCI+ neurons remained stable in DRN between all stages 0 and II. Finally, the differential susceptibility to tau inclusions among nuclear subdivisions was more notable in LC than in DRN.
Conclusions
LC and DRN neurons exhibited ht-NCI during AD precortical stages. The ht-NCI increases along AD progression on both nuclei, but quantitative changes in LC precede DRN changes.
Keywords: Alzheimer disease, brain stem, dorsal raphe nucleus, locus coeruleus, neurofibrillary tangles, post mortem, tauopathies, unbiased stereology
Introduction
Lack of understanding of the fundamental biology driving the early stages of AD may be preventing the development of effective treatments [1]. Neuropathological hallmarks of AD – hyperphosphorylated tau neuronal cytoskeletal pathology (Figure 1) and β-amyloid neuritic plaques – start accumulating in the brain decades before the onset of AD defining symptoms [2]. Improving knowledge of early AD biology is an unmet need and is key for the development of disease-modifying treatments [1,3].
Figure 1.
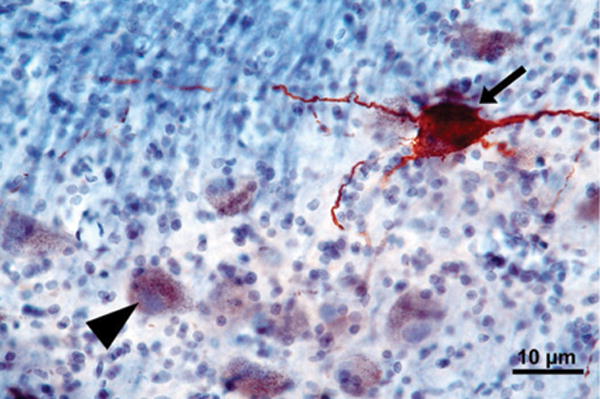
A 60-μm-thick horizontal section through the pons showing a portion of the locus coeruleus immunostained for phospho-tau (CP-13) and counterstained with gallocyanin. The arrow points to a ht-NCI+ neuron. The arrowhead points to a neuron free of ht-NCI displaying neuromelanin.
Tau neuronal cytoskeletal pathology correlates well with neuronal loss and cognitive decline, and its predictable spread into different brain regions serves as the basis for AD staging [4]. Therefore, modulating tau neuronal cytoskeletal pathology in the early stages of AD could prevent irreversible neuronal loss and brain damage.
In 1991, Braak and Braak divided the progression of AD into six stages based on the cortical distribution of silver-stained neuronal cytoplasmic inclusions, called neurofibrillary tangles (NFT) [4]. NFT in the transentorhinal/entorhinal cortex and hippocampus characterize stages I and II. Braak stages III–IV are characterized by involvement of limbic areas and the neocortex. NFT develop in primary neocortical areas in Braak stages V–VI [4]. The Braak staging system is based on cross-sectional studies and is rather qualitative, making it challenging to predict when the subject will progress to higher stages or even express symptoms. In fact, multisite workforces are investigating if individuals at low Braak stages represent early AD phases, normal ageing or a mixture of both [5,6]. However, the Braak system is reproducible and correlates well with cognitive status. Finally, a PET-tau imaging study corroborates the Braak staging system as an indication of AD neuropathological progression [7]. We demonstrated that tau cytoskeletal pathology develops in the brain-stem’s dorsal raphe nucleus (DRN; Figure 2), before the transentorhinal region [8], confirming the DRN’s early vulnerability to AD [9,10]. Other studies that investigated the chronological involvement of subcortical structures in AD pathogenesis were examined [11,12]. It became clear that several regions belonging to the isodendritic core – a group of subcortical nuclei with morphologically similar neurons, including the locus coeruleus (LC; Figure 2) and DRN – are involved early in AD [8,11,13–19]. The LC shows hyperphosphorylated tau neuronal cytoplasmic inclusions (ht-NCI) from the fourth decade of life [20–22]. In fact, early isodendritic core degeneration in AD may explain the high prevalence of mood and sleep cycle dysfunction observed in prodromal stages [16,23–30]. To consolidate these findings, Braak and colleagues revised their original staging system of AD in 2011 to incorporate brainstem structures of the isodendritic core as the earliest involved by sites affected by ht-NCI [21].
Figure 2.
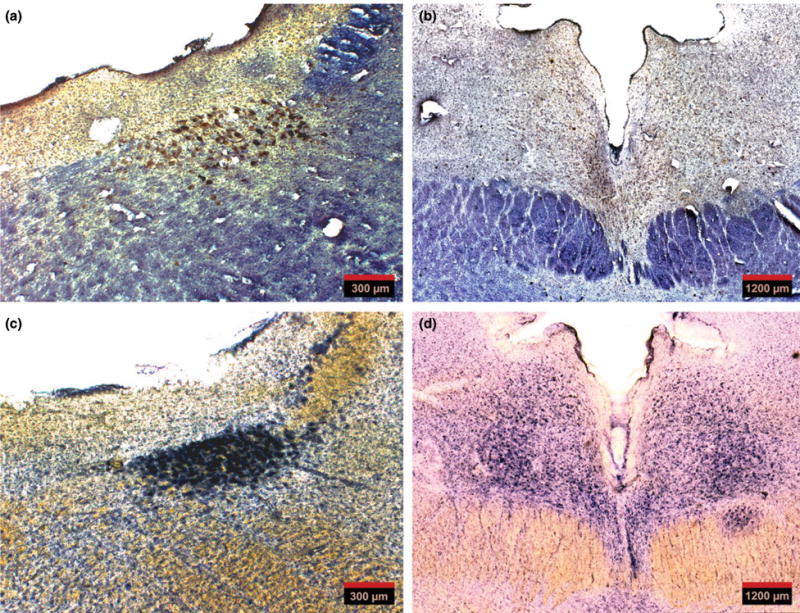
(a) An overview of a 60-μm-thick horizontal section through the pons showing locus coeruleus immunostained for phospho-tau (CP-13) and gallocyanin. (b) An overview of a 60-μm-thick horizontal section through the midbrain showing dorsal raphe nucleus at the level of the supratrochlear nucleus immunostained for phospho-tau (CP-13) and gallocyanin. (c and d) Horizontal sections, 300-μm-thick, adjacent to the sections in (a) and (b), respectively, stained for gallocyanin (Nissl staining). Note that thick sections provide optimal cytoarchitectural clarity and are ideal to assist with tracing the nuclei’s borders as a reference for the analysis of the 60 μm sections.
The literature shows conflicting results on the impact of early ht-NCI formation in the isodendritic core. Also, different authors dispute if ht-NCI are associated with neuronal loss or are, rather, a more benign epiphenomenon of ageing. For instance, it was suggested that ht-NCI deposition in brains lacking β-amyloid deposits should be considered a primary age-related tauopathy and not early AD [28]. A roadblock in clarifying this important question relates to the lack of post mortem brain tissue from well-characterized individuals at early Braak stages (at prodromal AD phases) and controls because most clinicopathological series come from dementia clinics.
Using a collection of well-characterized human subjects enriched for controls and early AD stages, we recently demonstrated that the LC shrinks about 8.4% in volume between each Braak stage without a significant loss of neurons until Braak stage III. On the other hand, no changes in LC volume or neuronal counts were seen in normal ageing [31]. Furthermore, we found that the rostral third of LC was the most vulnerable to AD pathology, corroborating previous studies [31–33]. Here, we utilize unbiased stereology in a sample of 48 well-characterized cases enriched for early Braak stages and controls to further clarify morphological changes associated with AD progression in the extremely vulnerable LC and DRN.
Materials and methods
Subjects
The 48 cases (Table S1) were obtained from the Brain Bank of the Brazilian Brain Aging Study Group (BBBABSG) from the University of São Paulo [34] and the Neurodegenerative Disease Brain Bank (NDBB) at the University of California, San Francisco (UCSF). All donations to the BBBABSG were made by next of kin after providing informed consent. The NDBB receives brain and spinal cord donations from patients enrolled in longitudinal clinical research programs at UCSF’s Memory and Aging Center. The project was approved by the Ethics Committee of the University of São Paulo Medical School (020/10). At UCSF, the research did not meet criteria for human studies (de-identified post mortem samples) and therefore no IRB approval was required.
Subjects were older than 44 years and had the whole extent of LC and DRN available for analyses. Exclusion criteria included the presence of non-AD-related neurodegenerative pathology or significant cerebrovascular lesions. Subjects were excluded if they had a history of seizures, other neurological diseases, a primary psychiatric diagnosis, or gross nondegenerative structural pathology. BBBABSG and NDBB neuropathological protocols are similar. For all cases, the routine neuropathological assessment followed universally accepted criteria for neurodegenerative diseases [35–37]. AD pathology was staged according to the new NIA-AA guidelines and categorized by the Braak and Braak staging system for neurofibrillary changes [4,33].
Tissue processing for this study
Specific tissue processing and staining methods used in this study have been described previously [10]. Brainstems were severed from the brain upon autopsy, fixed in 10% neutral buffered formalin and subsequently embedded in 8% celloidin [38]. Blocks were cut horizontally in serial alternating 300 μm and 5 × 60 μm sections using a sliding microtome. All 300-μm-thick sections were stained with gallocyanin–chromalum, a Nissl staining [13] for cytoarchitectural studies. One 60-μm-thick section at every 1200-μm interval was immunostained for phospho-Serine 202-tau (CP-13, 1:500; gift from Peter Davies, NY, USA) after antigen retrieval in pH 6.0 citrate buffer using an autoclave and counterstained with gallocyanin [13]. The anti-serine 202 antibody was selected because it detects early changes of tau hyperphosphorylation.
Stereology
Stereological analyses of the ht-NCI+ neuronal population in DRN and the unilateral LC followed design-based stereology principles using the optical fractionator probe according to a previously described method [39]. Only the left LC was estimated because several studies show symmetry of LC neuronal population in normal controls and AD cases [32,40–43]. Furthermore, semiquantitative observations of tau burden in neuropathological routine assessment and using neuroimaging methods are symmetric. LC and DRN borders were identified based on Olszewski’s ‘Cytoarchitecture of the Human Brain Stem’ [44] and Rüb and colleagues [45] respectively. Brainstem sections containing the DRN were collected from the level of the caudal border of the inferior colliculus, through the caudal pole of the oculomotor complex (III), a distance of about 6 mm. On cross-section, the rostral DRN borders encompass a fountain-shaped cell group composed of a medially situated central portion and two lateral wings. We traced the central portion between the medial longitudinal fasciculus (MLF) of each side and its dorsal extent to the base of the cerebral aqueduct. We traced the lateral wings dorsally to the MLF and the trochlear nuclei. Brainstem sections containing LC were collected caudally from the level of the dorsal oral pole of the motor trigeminal nucleus to the level of the caudal border of the inferior colliculus, a distance of approximately 12 mm. We traced LC borders dorsomedially to the central grey matter, dorsolaterally to the mesencephalic trigeminal nucleus and ventrally and ventromedially to the nucleus reticularis pontis oralis [8,44,45]. The gallocyanin–chromalum stained 300 μm sections were used for cytoarchitectonic visualization of LC and DRN neurons and for tracing the nuclei borders.
In short, the guard zone was set at 5 μm and the dissector height at 13.2 μm. The analyses were conducted using a Zeiss Imager A2 microscope (Carl Zeiss AG, Oberkochen, Germany). First, a coverslip engraved with a 600 × 600-μm alphanumeric labelled grid (Electron Microscopy Sciences, Hatfield, PA, USA) was placed on top of the region of interest. The alphanumeric grid squares overlaying any portion of the region of interest were recorded at 5× magnification (Objective A-Plan 5×/0.12 M27 [WD = 10.1 mm], Carl Zeiss AG). These grid squares served as the sampling frames. Then, under 20× magnification (Objective EC Plan-Neofluar 20×/0.50 M27, Carl Zeiss AG), the upper left corner of the first grid square was aligned to −45° below vertical in the field of view. Once the neurons located closer to the superior border of the dissector came into focus, the guard zone was set and the dissector was photographed using a digital camera (EOS Rebel T5i; Cannon, Inc., Tokyo, Japan) attached to the microscope with a T2 2.5× 60N interface (Carl Zeiss AG). Images were taken at seven z-axis levels separated by an interval of 2.2 μm, set by the scale engraved onto the microscope’s fine adjustment knob, using the EOS utility (Cannon, Inc.).
The z-stacks were uploaded to the image processing software ImageJ and a virtual dissector was created, as done previously [46,47]. The field of view of the camera was set as the counting frame (446.13 × 297.42 μm). The number of ht-NCI+ neurons was recorded in each picture with the assistance of the ‘cell counter’ ImageJ plugin (Kurt De Vos, University of Sheffield, Academic Neurology) with the lower horizontal and the left vertical borders as forbidden lines. We confirmed the final section thickness for each section using a z-axis micrometer (MBF StereoInvestigator v.10; MBF Bioscience, Williston, VT, USA) installed on a Zeiss Imager A2 microscope (Zeiss) with the readout in the software StereoInvesigator (MBF StereoInvestigator v.10; MBF Bioscience) at 40× objective magnification (Plan-Apochromat 40×/1.30 oil objective, Carl Zeiss AG). The ROI was sampled for thickness in three locations in each section. If the range of thicknesses was greater than 2 μm for a section, a fourth thickness was recorded for this section. The average of the measures was considered as the thickness of each section in the calculations.
The ht-NCI+ neuron counts were recorded for each dissector in an automated data entry form in Microsoft Excel (2007; Microsoft Corporation, Redmond, WA, USA) using the formula described for the optical fractionator [39]. Additionally, the coefficient of error (CE) was calculated following Gundersen’s method with parameters set assuming an irregular border [48] and the Schmitz–Hof method [49].
The estimates for neuronal number per nuclei (DRN and unilateral LC) are based on published parameters and have been used in other studies [13,31]. Both the estimation of total number of neurons and the number of ht-NCI+ neuron were obtained using the following formula:
where Q− is the number of particles counted in a dissector, t is the thickness of the section (measured for each section), h is the height of the dissector (13.2 μm), asf (0.0328) is the area of the counting frame divided by the area of the sampling frame and ssf (0.05) is the fraction of sections that were sampled from the ROI.
As we focused on intraneuronal tau inclusions, we used rigorous standards to discriminate neurons from other cell types and limited the number of observers to minimize interobserver variability. We characterized neurons using the gallocyanin (Nissl) counterstaining. Both LC and DRN neurons have distinctive nucleus and nucleolus, as opposed to glial cells. Also, these nuclei feature neurons proportionately much larger than glia cells [44].
Subdivisions
LC was divided vertically into rostral, middle and caudal thirds to investigate a possible topographical gradient of ht-NCI burden. These delineations were made by dividing the sections used in the stereological analysis. For cases with a number of sections not divisible by 3, the remainder was distributed based off previous knowledge of differential vulnerability to neuronal and volumetric loss with rostral LC as the most susceptible, the middle as the second most susceptible and the caudal as the least susceptible [17,31]. To illustrate, in cases with eight sections, the lower three sections were caudal, the middle three were middle and the upper two were rostral. For cases with ten sections, four were assigned to caudal, three to middle and three to rostral.
DRN was divided into three based on its four distinctive subnuclei. From caudal through rostral, these included the caudal laminar (CL), caudal compacta (CC), and on the same transverse plane, the supratrochlear and interfascicular which were analysed as one subnucleus in this study (STIF). DRN subnuclei were delineated on the basis of the cell morphology and borders defined by previous investigations [45,50].
Statistical analysis
Associations between ht-NCI+ neuron estimated population size and demographics were only examined in Braak stage 0–I cases to examine possible demographic influences in relatively nonpathological conditions. Differences between Braak stages in the population of ht-NCI+ neurons in LC and DRN were assessed using a one-way analysis of means. A Bartlett test of homogeneity of variance was used to determine if each Braak stage group had statistically similar variances. When variances were different among groups, a Welch correction was applied to the one-way analysis of means. This analysis excluded cases beyond Braak stage II due to relatively low sampling in the later stages and the study’s focus on early stages of AD. A Tukey’s post hoc analysis to an ANOVA was used to examine pairwise differences between individual Braak stages. Of the entire sample size, those cases that had complementing estimations neuronal populations from previous studies [31] were included in an analysis that interpreted the number of ht-NCI+ neurons as a proportion of the total neuronal population size (both pigmented and nonpigmented middle and large size neurons – see [13]). For each case, the estimated ht-NCI+ neuronal population was divided by the estimated neuronal population to generate the proportion of ht-NCI+ neurons. We performed sensitivity analyses to confirm our findings regarding the association between ht-NCI+ neurons and Braak stages, using univariate and multivariate linear regression models adjusted for age, sex, years of education and brain weight. Statistical analyses were conducted in the statistical computing program R [51]. The level of significance was set at the 0.05 level in two-tailed tests.
Results
Table S1 depicts the demographic and clinical information with stereological estimates and CE’s for each of the 48 cases included in this study. Most the sample was male (58%), with 62% White. The average age was 63.2 ± 10.4 years (range 44–88 years). The average education attainment was 6.7 ± 5.5 years (range of 0–18 years). Figures 3 and 4 depict descriptive statistics for the sample and subsamples for LC analyses and DRN analyses respectively. The table breaks down the statistics by analysis, as the subsamples vary.
Figure 3.
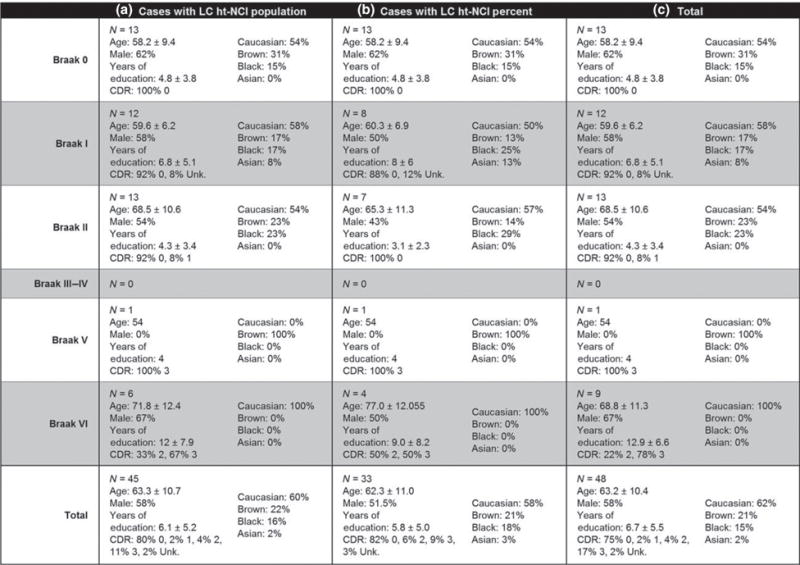
Features and descriptive statistics (intervals represent one standard deviation) for the 48 cases used in this study with subsets broken down by LC subanalysis. Abbreviations: CDR, Clinical Dementia Rating; ht-NCI, hyperphosphorylated tau neuronal cytoplasmic inclusions; LC, locus coeruleus.
Figure 4.
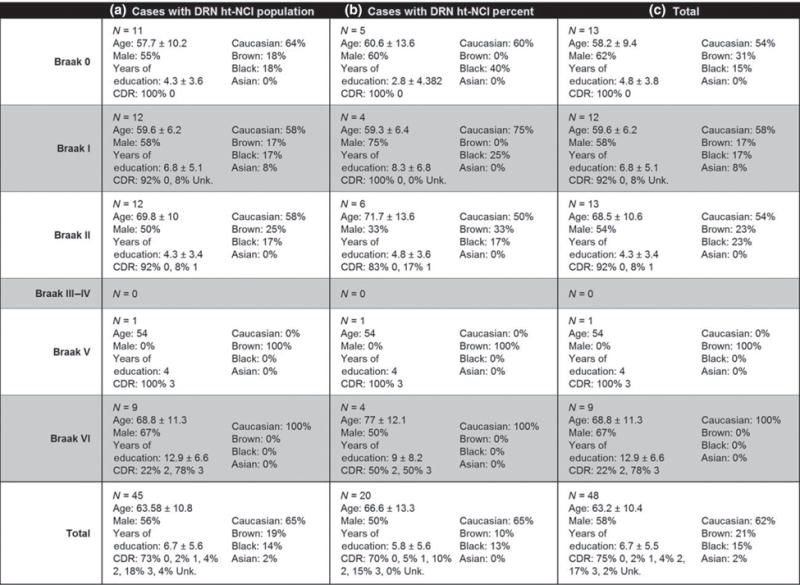
Features and descriptive statistics (intervals represent one standard deviation) for the 48 cases used in this study with subsets broken down by DRN subanalysis. Abbreviations: CDR, Clinical Dementia Rating; DRN, dorsal raphe nucleus; ht-NCI, hyperphosphorylated tau neuronal cytoplasmic inclusions.
Locus coeruleus
The number of ht-NCI+ LC neurons does not vary with age, sex, years of education or brain weight
Using 25 Braak stage 0 and I cases (Figure 3a – for demographic information on this subsample), no significant associations were detected between age, years of education or brain weight and ht-NCI+ LC neuron population size. Males and females had the same ht-NCI+ LC neuron population size.
The number of ht-NCI+ LC neurons significantly increase within early Braak stages
By examining the ht-NCI+ LC neuronal population size in 38 cases (Figure 3a – for demographic information on this subsample) ranging from Braak stage 0 to II (n = 13, 12 and 13 respectively) significantly different variances were detected between the Braak stages (P = 0.045). A one-way analysis of means, without assuming equal variances, indicated a significant increase in LC ht-NCI+ neuron population sizes among the early Braak stages (P = 0.01). Analysing the pairwise differences between Braak stages indicates that there is an increase of 3173 (95% CI: [490, 5856]) neurons between Braak stage 0 to I with no significant difference between Braak stages I and II (Figure 5a). However, in the subset of the cases (n = 28; Figure 3b – for demographic information on this subsample) in which a stereological estimate of the total LC neuronal population size was available (see [31]), we only detected a trend of higher proportion of ht-NCI+ comparing Braak stage I to 0 and no difference between Braak stage I and II cases (Figure 5b). Of note, an average of 7.87% of LC neurons already showed ht-NCI in Braak 0 cases. We performed sensitivity analyses using linear regression with Braak stage as a dummy variable, and the results were similar (results not shown).
Figure 5.
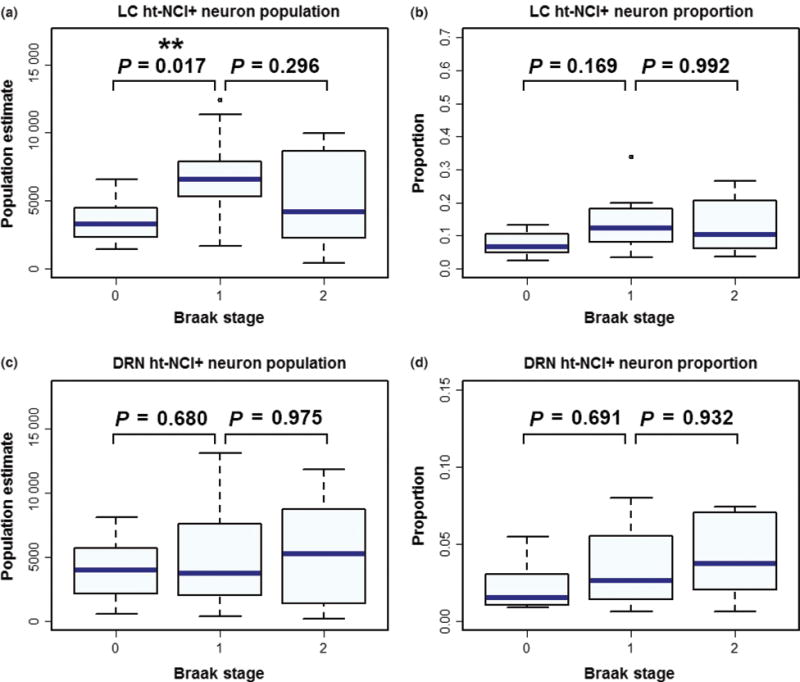
Box plots depicting ht-NCI burden between subjects at early Braak stages. A significant difference was detected between Braak stages 0 and I in the number of ht-NCI+ neurons in the locus coeruleus (LC), with no significant difference between Braak stages I and II (a). No significant difference was detected between any Braak stages in the proportion of neurons with ht-NCI in LC (b). Likewise, no significant difference was detected in the number (c) or proportion (d) of ht-NCI+ neurons in the dorsal raphe nucleus (DRN).
The proportion, but not the total number of ht-NCI+ LC neurons, is higher in late Braak stages compared to early Braak stages
By examining all LC cases (n = 45; Figure 3a – for demographic information on this subsample), we failed to identify a significant difference between the total number of LC ht-NCI+ neurons in early (Braak stage 0–II) vs. late (Braak stage V/VI) Braak stages (Figure 6a). We used the subset of cases in which estimations for neuronal populations were available (n = 33; Figure 3b – for demographic information on this subsample) to compare the proportion of ht-NCI+ LC neurons between early and late Braak stages. A significantly (P < 0.0001) higher percent (3.6×) of LC neuron population with ht-NCI+ neurons was detected in late stages than early stages (Figure 6b).
Figure 6.
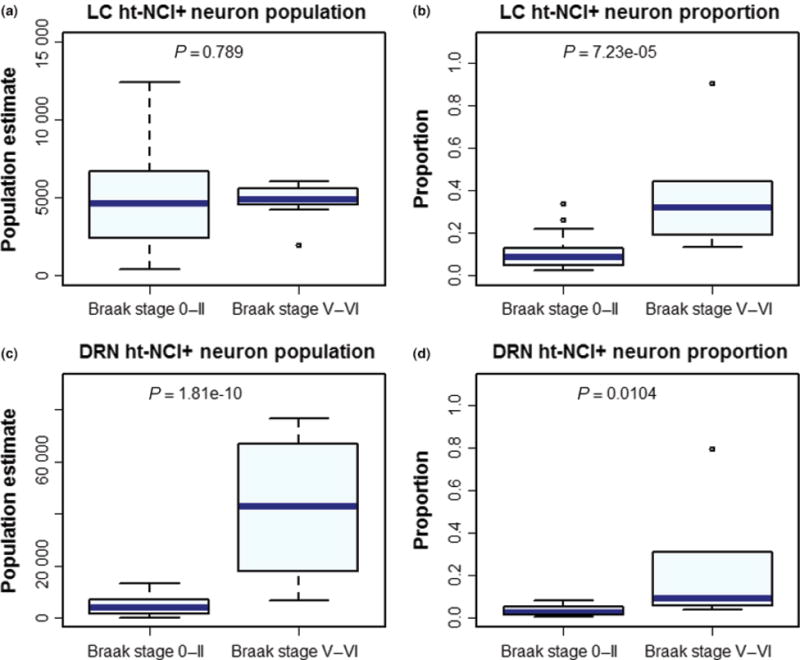
Box plots depicting the burden of ht-NCI between subjects at early and late Braak stages. While there is no significant change in the number of neurons positive for ht-NCI in the locus coeruleus (LC) (a), a significant increase can be detected in the proportion of neurons with ht-NCI (b). The ht-NCI burden in the dorsal raphe nucleus (DRN) increases both as a number (c) and proportion (d) of neurons.
ht-NCI burden varies among LC subregions within early Braak stages
In Braak stage 0 cases (n = 13; Figure 3a – for demographic information on this subsample), the average number of ht-NCI+ LC neurons was 3531. Of this, the middle third of LC had an average of 2808 ht-NCI+ neurons which is an average of 1626 (95% CI: [521, 2732]) more than the caudal third and 1506 (95% CI: [400, 2612]) more than the rostral third (Figure 7a). However, when considering the proportion of the total neuronal population (n = 13; Figure 3b – for demographic information on this subsample), we only observed a significant difference between the rostral and caudal thirds (P = 0.03) (Figure 7b). Braak stage 0 cases already exhibited ht-NCI in 12.63% of rostral, 9.63% of middle and 4.13% of caudal LC neurons.
Figure 7.
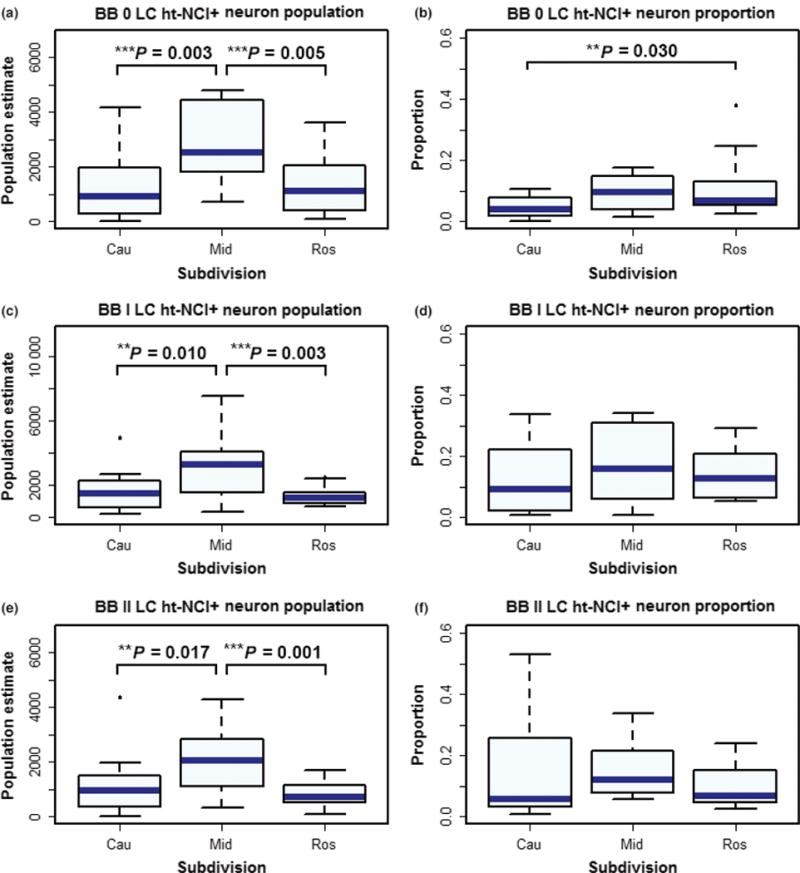
In Braak stages 0, I and II cases the middle third of the locus coeruleus (LC) has more ht-NCI+ neurons than the rostral and caudal thirds (a, c and e). When considering the proportion of the total neuronal population, the rostral third had significantly more ht-NCI than the caudal third, with no difference compared to the middle third (b). In Braak stages I and II cases we failed to observe any differences in the proportions of LC ht-NCI+ neurons in the dorsal raphe nucleus (DRN) subdivisions (d and f).
In Braak stage I cases (n = 12; Figure 3a – for demographic information), middle LC had 1253 (95% CI: [453, 2054]) more ht-NCI+ neurons than caudal LC and 949 (95% CI: [149, 1750x0005D;) more ht-NCI+ neurons than rostral LC (Figure 7c). In Braak stage II cases (n = 13), middle LC had 1291 (95% CI: [445, 2137]) more ht-NCI+ neurons than rostral LC and 953 (95% CI: [107, 1799]) more ht-NCI+ neurons than caudal LC (Figure 7e). There was no significant difference between the number of ht-NCI+ neurons at any Braak stage 0–II in the rostral vs. caudal LC. Likewise, in Braak stage I and II (Figures 6d, f) cases (n = 15; Figure 3b – for demographic information), we failed to observe any differences in the proportions of LC ht-NCI+ neurons in the subdivisions.
Dorsal raphe nucleus
The number of ht-NCI+ in DRN correlates with age but not sex, years of education or brain weight
For this analysis using 23 Braak stage 0 and I cases (Figure 4a – for demographic information), a significant association (P = 0.03) was detected between the population of ht-NCI+ neurons in DRN and age for cases Braak stage 0–I with an average increase of 208.05 (95% CI: [23, 393]) ht-NCI+ neurons per year. No significant association was detected between years of education or brain weight with ht-NCI+ DRN neuron population in Braak stage 0–I cases. Males and females had similar numbers of ht-NCI+ neurons.
The number and proportion of ht-NCI+ neurons remain stable in early Braak stages in DRN
By examining the ht-NCI+ DRN neuronal population size in 35 cases (Figure 4a – for demographic information on this subsample) ranging from Braak stage 0 to II (n = 11, 12, and 12 respectively), no significantly different variances were detected between Braak stages. Our analysis did not detect any significant differences in the mean numbers of ht-NCI+ DRN neurons between early Braak stages. (Figure 5c). For a subset of the cases (n = 15; Figure 4b – for demographic information), we also had a stereological estimate of the total DRN neuronal population size. An analysis of this subset from Braak stage 0 to II (n = 5, 4, and 6 respectively) did not reveal any significant differences between early Braak stages in the proportion of DRN neurons with ht-NCI+ (Figure 5d). In Braak stage 0 cases (n = 5; Figure 4b – for demographic information), about 2.62% of neurons were positive for ht-NCI. We performed sensitivity analyses for all the associations described in this paragraph using regression analysis with Braak stage as a dummy variable, and the results were similar.
The number and proportion of ht-NCI+ DRN neurons increase into late Braak stages
By examining all DRN cases (n = 45; Figure 4a – for demographic information on this subsample) using a one-way analysis of means, a significant increase (9.1×) was detected between the number of ht-NCI+ DRN neurons in early (stage 0–II) and late (stage V/VI) Braak stages (P = 0.002) (Figure 6c). A significant increase (7.7×) was also detected in the proportion of ht-NCI+ neurons in the subset of cases (n = 20; Figure 4b – for demographic information on this subsample) with estimated neuronal populations (P = 0.01) (Figure 6d).
ht-NCI are evenly distributed between DRN subnuclei in early Braak stages
In Braak stage 0, there are 2040 ht-NCI+ neurons in STIF – 1516 more than CL (P = 0.031) with no significant difference with CC. No significant difference was detected in the ht-NCI+ neuron population between CL and CC. No significant differences were detected in the proportion of neurons with ht-NCI between any subnuclei in Braak stage 0. No significant differences were detected in the number or percent of ht-NCI+ DRN neurons between each subnucleus in Braak stage I or II.
Is there a relationship between the number of ht-NCI+ neurons in LC and DRN?
To determine if there is a relationship between the magnitude of ht-NCI progression in LC and DRN, we ran a regression between the number of ht-NCI+ neurons in LC vs. DRN in all overlapping cases (n = 42; Figures 3a and 4a – for demographic information on these subsamples). We failed to detect a significant interaction between the number of ht-NCI+ neurons in DRN and the number of ht-NCI+ neurons in LC.
Discussion
This study utilized design-based unbiased stereology in a difficult-to-obtain sample of human brains spanning early and late Braak stages for neurofibrillary tangles to quantify neuronal ht-NCI burden in two extremely vulnerable subcortical structures to ht-NCI – LC and DRN. This quantitative study complements previous qualitative investigations of AD-related ht-NCI progression in the isodendritic core [8,31,45], and investigates the relationship between phospho-tau burden and changes in neuronal numbers. The major findings from this study are that (a) both LC and DRN exhibit a noteworthy number of ht-NCI+ neurons in control (Braak stage 0) cases; (b) the number of ht-NCI+ neurons remain stable during ageing in LC but not in DRN; (c) in early (Braak stage 0–II) stage cases, the number, but not the proportion of ht-NCI+ neurons, increases in LC. In DRN, both the total numbers and proportion remained the same; however, (d) the number of ht-NCI+ neurons in LC is similar between early and late Braak stages, whereas the proportion of these neurons increases significantly in late Braak stages. (e) In DRN, the total number and proportion of ht-NCI+ neurons increase from early to late Braak stages; (f) the number and proportion of ht-NCI+ neurons are significantly different between LC subdivisions but are evenly distributed in DRN.
LC and DRN are parts of the isodendritic core and exhibit extremely early susceptibility to develop AD-related tau cytoskeleton pathology [8,11,12,21]. As the major site of noradrenalin synthesis in the brain, the LC plays a major role in circadian rhythms, depression and stress [13,27,44–50]. The DRN produces the majority of the serotonin in the brain and has been associated with psychiatric disorders such as depression [11].
In Braak stage 0 cases, around 8% of LC neurons contained ht-NCI. This number is higher than those reported by studies using less sensitive silver staining to detect inclusions [52], but our results go in line with the reports that LC and DRN develop ht-NCI before any cortical area and from the fourth decade of life [8,21]. Our results also support evidence that tau precedes β-amyloid accumulation in humans. In fact, LC neurodegeneration may potentiate β-amyloid pathology [15,53–55]. We found an almost two-fold increase in the numbers of ht-NCI+ LC neurons from Braak 0 to I, even though the average neuronal numbers of these groups were similar (Figure 5a), reinforcing evidence that there may be a long gap between ht-NCI formation and neuronal loss [10]. In fact, we showed LC neuronal loss only from Braak stage III [31]. Interestingly, the total numbers of ht-NCI+ LC neurons seem to remain stable between Braak stages I, II and V/VI. Given that the proportion of ht-NCI+ LC neurons in Braak stage V/VI cases are much higher, stable ht-NCI+ neuronal numbers after Braak stage I are likely due to neuronal loss rather than a slowing down of the ht-NCI formation process because ghost tangles do not appear in the brainstem until late Braak stages [31,52]. Although significant neuronal loss only occurs from Braak stage III [29], it is plausible that neuronal loss is present from Braak stage II in a subset of cases. Moreover, as Braak stage is an ordinal rather than quantitative scale, it is possible that the difference between Braak stages 0 and I is much higher than between stages I and II, in terms of the progression of AD biology. Nevertheless, we cannot rule out the effect of a low power in our analysis that is challenging to overcome considering the lack of early Braak stage cases for research. Finally, although our study is cross-sectional, it brings evidence that early ht-NCI involvement of LC is part of AD biology because we failed to see age-related changes in ht-NCI numbers.
The results for DRN were considerably different. In Braak stage 0, about 2.6% of the neurons contained ht-NCI and we observed an age-related increase in ht-NCI+ neurons. Within the early stages (Braak stages 0–II), the ht-NCI+ neuronal population size and the proportion remained stable. However, in late Braak stages both the total number and proportion of ht-NCI+ neurons increased, reflecting either a greater magnitude of ht-NCI formation in mid- and late-Braak stages or perhaps even a milder neuronal loss than in the LC. This also indicates the possibility that ht-NCI formation in DRN may be an epiphenomenon of ageing that becomes accelerated after AD pathology develops in interconnected brain areas. This trend was noted in a previous study that investigated the raphe nuclei system [39].
Early accumulation of ht-NCI in the LC and DRN may cause neuronal dysfunction and contribute to psychiatric symptoms preceding cognitive decline in AD [16,17,22,29,53].
This study highlights the importance of comparing different brain areas in the same patients. Despite belonging to the isodendritic core and sharing early vulnerability to the formation of ht-NCI, the lack of association between ht-NCI neuronal population size in the LC and DRN demonstrate that the sequence and progression of pathology seem to be quite different in the two nuclei. Rather, the dynamic pathology may be more related to selective vulnerability of different regions and points to the fact that intervention strategies may have a better chance of success when targeting more vulnerable areas.
Concerning intranuclear vulnerability within the LC, the middle third had significantly more ht-NCI+ neurons than the rostral or caudal LC in Braak stage 0 and I cases, and significantly more ht-NCI+ neurons than rostral LC in Braak stage II cases. However, when computing the total neuronal population of each of these LC thirds, the rostral LC had a higher percent of neurons with ht-NCI in Braak stage 0 cases than the middle or caudal LC and the increased burden in the middle third disappears. This vulnerability in the rostral and middle thirds aligns well with previous studies in humans [14,29,30,51]. These findings in the LC are interesting considering that the middle and rostral LC have projections to several cortical regions highly vulnerable to AD, including the hippocampus, according to animal studies [56–58]. This lends further support to the model of network-based selective vulnerability in AD. In DRN, a marginal difference was detected in the ht-NCI+ neuron population between STIF and CL at Braak 0, however, this could be related to a higher neuron population in STIF, as the difference was not detected in the proportions of neurons with ht-NCI. Furthermore, there was no significant difference between STIF and CC, and CL and CC at Braak 0. No significant differences were detected between subnuclei in Braak stages I and II. Caution should be exercised when interpreting differential susceptibility to tau inclusion among subnuclei in early Braak stages because the proportion of neurons with ht-NCI is very low. A previous study indicates that intranuclear differences appear in DRN beginning in Braak stage III [45]. The interneuronal distribution of ht-NCI could not be investigated at high Braak stages (V/VI) in either LC or DRN due to high volumetric loss of both nuclei [29] making it difficult to define the subnuclear borders with accuracy and generate precise estimations of ht-NCI+ neuronal populations.
This study offers several strengths. Relatively thick serial sections were utilized to ensure that estimations are not biased by intraregional inhomogeneity. The serial sectioning also allowed for the nuclei to be subdivided into smaller regions of interest to examine network-based vulnerability. Additionally, we estimated the absolute number and proportion of ht-NCI+ neurons allowing us to examine the relationship between neuronal loss and the accretion of proteins.
Our approach also has limitations. While stereological studies offer the ability to generate accurate estimations of neuronal populations, they are labour intensive and time-consuming. This leads to a relatively small sample, especially when compared to investigations using animal models. Examining cases ranging from Braak stages III to V are necessary to clarify at which point ht-NCI formation start to increase and how this increase correlates with other neuropathological and clinical aspects of AD. Further funding will allow additional investigation into the progression of AD pathology in these subcortical structures past Braak stage II and how these neuropathologic hallmarks may progress in other nuclei of the isodendritic core.
To exclude bias from our population estimates, we utilized an accepted technique of design-based stereology. Once these parameters were established, there were two possible major sources of error: incorrect borders and incorrect detection of positivity for ht-NCI. The borders of the first five cases of each nucleus were compared to independently drawn borders made by other investigators to ensure objective agreement. Interpretation of ht-NCI+ neuronal positivity was confirmed by frequent review and comparison with independent analyses made by two other seasoned investigators (LTG and PT) in randomly selected cases throughout the study.
By quantifying the abundance of ht-NCI in subcortical regions such as LC and DRN, we offer a more precise understanding of the early pathological framework by which AD progresses. In this way, quantifying ht-NCI burden in LC and DRN across early disease stages may contribute to a framework for more effective treatment. These results suggest that AD patients may benefit from therapies that modulate levels of noradrenalin and serotonin. Additionally, this study demonstrates an increasing burden of ht-NCI prior to the onset of neuronal loss, presenting a possible window for effective treatment and the identification of potential therapeutic targets prior to the onset of cognitive decline [59,60].
Rigorous neuropathological studies provide a broad and comprehensive groundwork for advancement in the research of neurodegenerative diseases. By characterizing these differences in brainstem structures, which are affected early in AD, we can help to build the foundation for therapeutic targeting and mechanistic drug development by overcoming the gap in knowledge regarding early AD pathogenesis.
Supplementary Material
Table S1. The stereological estimates with the demographic and pathologic data for the 48 cases used in this study.
Acknowledgments
We thank the families of the brain donors and staff of the São Paulo Autopsy service for their unconditional support. We are also grateful to the Brazilian Aging Brain Study Group and UCSF’s Neurodegenerative Brain Bank for their assistance with tissue processing and analysis. The authors would like to thank Cristina Armas, Lauren Maltz, Anita Spasova, Joseph Oh, Julia Thackrey and Rana Eser for support with histology and tissue preparation. Additionally, the authors would like to thank Maryana Alegro, PhD and Pierre-Antoine Gourraud, MPH, PhD for guidance on this project. This study was directly supported financially by NIH Grant #R01AG040311 and the John Douglas French Alzheimer’s Foundation. LTG mentoring effort is supported by NIH Grant #K24AG053435. Additional financial support was provided by FMUSP LIM-22 and institutional NIH Grants P50AG023501 and P01AG019724.
Footnotes
Author contributions
AJE performed the stereology on the IHC-stained LC, validated the IHC-stained DRN and Nissl-stained LC stereology, assisted with experimental design, optimized the stereology workflow, assisted with histology prep and wet lab, conducted the statistical analysis and drafted the manuscript. AKN performed the stereology on the IHC-stained DRN, validated the IHC-stained LC and Nissl-stained DRN stereology and assisted with histology prep and wet lab. PT performed the stereology on the Nissl-stained LC, validated the Nissl-stained DRN and IHC-stained LC stereology, assisted with the experimental design and assisted with histology. SD performed the stereology on the Nissl-stained DRN, validated the IHC-stained DRN stereology, assisted with the experimental design and assisted with histology. CKS provided guidance on the design and execution of statistical analyses. ATA, REPL and RDR assisted with tissue and data collection. MBM optimized and conducted histological procedures. UR provided intellectual guidance on stereology and cytoarchitectonics. JMF, RELFR and CFN assisted with data collection. BLM provided guidance on the interpretation of results and the experimental design and provided institutional support. RN, CAP and WJF assisted with data collection and financial support. WWS provided intellectual guidance, assisted on the interpretation of the results and provided well-characterized tissue samples. HH optimized protocols for tissue sectioning and experimental work-flow, provided guidance on stereology and interpretation of the results. LTG (PI) had overall control of experimental design, execution and validation, provided financial support, directed and validated the pathological diagnoses and composed and finalized the manuscript.
The authors declare no conflict of interest.
Supporting information
Additional Supporting Information may be found in the online version of this article at the publisher’s web-site:
References
- 1.Korczyn AD. Why have we failed to cure Alzheimer’s disease? Journal of Alzheimer’s disease: JAD. 2012;29:275–82. doi: 10.3233/JAD-2011-110359. [DOI] [PubMed] [Google Scholar]
- 2.Jack CR, Jr, Knopman DS, Jagust WJ, Petersen RC, Weiner MW, Aisen PS, Shaw LM, Vemuri P, Wiste HJ, Weigand SD, Lesnick TG, Pankratz VS, Donohue MC, Trojanowski JQ. Tracking pathophysiological processes in Alzheimer’s disease: an updated hypothetical model of dynamic biomarkers. Lancet Neurol. 2013;12:207–16. doi: 10.1016/S1474-4422(12)70291-0. [DOI] [PMC free article] [PubMed] [Google Scholar]
- 3.Alzheimer’s Association. 2015 Alzheimer’s disease facts and figures. Alzheimers Dement. 2015;11:332–84. doi: 10.1016/j.jalz.2015.02.003. [DOI] [PubMed] [Google Scholar]
- 4.Braak H, Braak E. Neuropathological staging of Alzheimer-related changes. Acta Neuropathol. 1991;82:239–59. doi: 10.1007/BF00308809. [DOI] [PubMed] [Google Scholar]
- 5.Crary JF, Trojanowski JQ, Schneider JA, Abisambra JF, Abner EL, Alafuzoff I, Arnold SE, Attems J, Beach TG, Bigio EH, Cairns NJ, Dickson DW, Gearing M, Grinberg LT, Hof PR, Hyman BT, Jellinger K, Jicha GA, Kovacs GG, Knopman DS, Kofler J, Kukull WA, Mackenzie IR, Masliah E, McKee A, Montine TJ, Murray ME, Neltner JH, Santa-Maria I, Seeley WW, Serrano-Pozo A, Shelanski ML, Stein T, Takao M, Thal DR, Toledo JB, Troncoso JC, Vonsattel JP, White CL, 3rd, Wisniewski T, Woltjer RL, Yamada M, Nelson PT. Primary age-related tauopathy (PART): a common pathology associated with human aging. Acta Neuropathol. 2014;128:755–66. doi: 10.1007/s00401-014-1349-0. [DOI] [PMC free article] [PubMed] [Google Scholar]
- 6.Duyckaerts C, Braak H, Brion JP, Buee L, Del Tredici K, Goedert M, Halliday G, Neumann M, Spillantini MG, Tolnay M, Uchihara T. PART is part of Alzheimer disease. Acta Neuropathol. 2015;129:749–56. doi: 10.1007/s00401-015-1390-7. [DOI] [PMC free article] [PubMed] [Google Scholar]
- 7.Scholl M, Lockhart SN, Schonhaut DR, O’Neil JP, Janabi M, Ossenkoppele R, Baker SL, Vogel JW, Faria J, Schwimmer HD, Rabinovici GD, Jagust WJ. PET imaging of tau deposition in the aging human brain. Neuron. 2016;89:971–82. doi: 10.1016/j.neuron.2016.01.028. [DOI] [PMC free article] [PubMed] [Google Scholar]
- 8.Grinberg LT, Rub U, Ferretti RE, Nitrini R, Farfel JM, Polichiso L, Gierga K, Jacob-Filho W, Heinsen H, Brazilian Brain Bank Study Group The dorsal raphe nucleus shows phospho-tau neurofibrillary changes before the transentorhinal region in Alzheimer’s disease. A precocious onset? Neuropathol Appl Neurobiol. 2009;35:406–16. doi: 10.1111/j.1365-2990.2009.00997.x. [DOI] [PubMed] [Google Scholar]
- 9.Parvizi J, Van Hoesen GW, Damasio A. The selective vulnerability of brainstem nuclei to Alzheimer’s disease. Ann Neurol. 2001;49:53–66. doi: 10.1002/1531-8249(200101)49:1<53::aid-ana30>3.0.co;2-q. [DOI] [PubMed] [Google Scholar]
- 10.Rub U, Stratmann K, Heinsen H, Turco DD, Seidel K, Dunnen W, Korf HW. The brainstem tau cytoskeletal pathology of Alzheimer’s disease: a brief historical overview and description of its anatomical distribution pattern, evolutional features, pathogenetic and clinical relevance. Curr Alzheimer Res. 2016;13:1178–97. doi: 10.2174/1567205013666160606100509. [DOI] [PubMed] [Google Scholar]
- 11.Simic G, Stanic G, Mladinov M, Jovanov-Milosevic N, Kostovic I, Hof PR. Does Alzheimer’s disease begin in the brainstem? Neuropathol Appl Neurobiol. 2009;35:532–54. doi: 10.1111/j.1365-2990.2009.01038.x. [DOI] [PMC free article] [PubMed] [Google Scholar]
- 12.Stratmann K, Heinsen H, Korf HW, Del Turco D, Ghebremedhin E, Seidel K, Bouzrou M, Grinberg LT, Bohl J, Wharton SB, den Dunnen W, Rub U. Precortical phase of Alzheimer’s disease (AD)-related tau cytoskeletal pathology. Brain Pathol. 2016;26:371–86. doi: 10.1111/bpa.12289. [DOI] [PMC free article] [PubMed] [Google Scholar]
- 13.Theofilas P, Polichiso L, Wang X, Lima LC, Alho AT, Leite RE, Suemoto CK, Pasqualucci CA, Jacob-Filho W, Heinsen H, Brazilian Aging Brain Study Group. Grinberg LT. A novel approach for integrative studies on neurodegenerative diseases in human brains. J Neurosci Methods. 2014;226:171–83. doi: 10.1016/j.jneumeth.2014.01.030. [DOI] [PMC free article] [PubMed] [Google Scholar]
- 14.Grinberg LT, Rueb U, Heinsen H. Brainstem: neglected locus in neurodegenerative diseases. Front Neurol. 2011;2:42. doi: 10.3389/fneur.2011.00042. [DOI] [PMC free article] [PubMed] [Google Scholar]
- 15.Elobeid A, Soininen H, Alafuzoff I. Hyperphosphorylated tau in young and middle-aged subjects. Acta Neuropathol. 2012;123:97–104. doi: 10.1007/s00401-011-0906-z. [DOI] [PMC free article] [PubMed] [Google Scholar]
- 16.Simic G, Babic Leko M, Wray S, Harrington CR, Delalle I, Jovanov-Milosevic N, Bazadona D, Buee L, de Silva R, Di Giovanni G, Wischik CM, Hof PR Monoaminergic neuropathology in Alzheimer’s disease. Prog Neurobiol. 2016;???:???–???. doi: 10.1016/j.pneurobio.2016.04.001. [DOI] [PMC free article] [PubMed] [Google Scholar]
- 17.Zweig RM, Ross CA, Hedreen JC, Steele C, Cardillo JE, Whitehouse PJ, Folstein MF, Price DL. The neuropathology of aminergic nuclei in Alzheimer’s disease. Ann Neurol. 1988;24:233–42. doi: 10.1002/ana.410240210. [DOI] [PubMed] [Google Scholar]
- 18.German DC, White CL, Sparkman DR. Alzheimer’s disease: neurofibrillary tangles in nuclei that project to the cerebral cortex. Neuroscience. 1987;21:305–12. doi: 10.1016/0306-4522(87)90123-0. [DOI] [PubMed] [Google Scholar]
- 19.German DC, Manaye KF, White CL, Woodward DJ, McIntire DD, Smith WK, Kalaria RN, Mann DMA. Disease-specific patterns of locus-coeruleus cell loss. Ann Neurol. 1992;32:667–76. doi: 10.1002/ana.410320510. [DOI] [PubMed] [Google Scholar]
- 20.Braak H, Del Tredici K. The pathological process underlying Alzheimer’s disease in individuals under thirty. Acta Neuropathol. 2011;121:171–81. doi: 10.1007/s00401-010-0789-4. [DOI] [PubMed] [Google Scholar]
- 21.Braak H, Thal DR, Ghebremedhin E, Del Tredici K. Stages of the pathologic process in Alzheimer disease: age categories from 1 to 100 years. J Neuropathol Exp Neurol. 2011;70:960–9. doi: 10.1097/NEN.0b013e318232a379. [DOI] [PubMed] [Google Scholar]
- 22.Attems J, Thal DR, Jellinger KA. The relationship between subcortical tau pathology and Alzheimer’s disease. Biochem Soc Trans. 2012;40:711–15. doi: 10.1042/BST20120034. [DOI] [PubMed] [Google Scholar]
- 23.Potvin O, Lorrain D, Forget H, Dube M, Grenier S, Preville M, Hudon C. Sleep quality and 1-year incident cognitive impairment in community-dwelling older adults. Sleep. 2012;35:491–9. doi: 10.5665/sleep.1732. [DOI] [PMC free article] [PubMed] [Google Scholar]
- 24.Hahn EA, Wang HX, Andel R, Fratiglioni L. A change in sleep pattern may predict Alzheimer disease. Am J Geriatr Psychiatry. 2014;22:1262–71. doi: 10.1016/j.jagp.2013.04.015. [DOI] [PubMed] [Google Scholar]
- 25.Masters MC, Morris JC, Roe CM. “Noncognitive” symptoms of early Alzheimer disease: a longitudinal analysis. Neurology. 2015;84:617–22. doi: 10.1212/WNL.0000000000001238. [DOI] [PMC free article] [PubMed] [Google Scholar]
- 26.Cummings JL, Miller B, Hill MA, Neshkes R. Neuropsychiatric aspects of multi-infarct dementia and dementia of the Alzheimer type. Arch Neurol. 1987;44:389–93. doi: 10.1001/archneur.1987.00520160031010. [DOI] [PubMed] [Google Scholar]
- 27.Lazarus LW, Newton N, Cohler B, Lesser J, Schweon C. Frequency and presentation of depressive symptoms in patients with primary degenerative dementia. Am J Psychiatry. 1987;144:41–5. doi: 10.1176/ajp.144.1.41. [DOI] [PubMed] [Google Scholar]
- 28.Reifler BV, Larson E, Teri L, Poulsen M. Dementia of the Alzheimer’s type and depression. J Am Geriatr Soc. 1986;34:855–9. doi: 10.1111/j.1532-5415.1986.tb07258.x. [DOI] [PubMed] [Google Scholar]
- 29.Babulal GM, Ghoshal N, Head D, Vernon EK, Holtzman DM, Benzinger TL, Fagan AM, Morris JC, Roe CM. Mood changes in cognitively normal older adults are linked to Alzheimer disease biomarker levels. Am J Geriatr Psychiatry. 2016;???:???–???. doi: 10.1016/j.jagp.2016.04.004. [DOI] [PMC free article] [PubMed] [Google Scholar]
- 30.Gannon M, Che P, Chen Y, Jiao K, Roberson ED, Wang Q. Noradrenergic dysfunction in Alzheimer’s disease. Front Neurosci. 2015;9:220. doi: 10.3389/fnins.2015.00220. [DOI] [PMC free article] [PubMed] [Google Scholar]
- 31.Theofilas P, Ehrenberg AJ, Dunlop S, Di Lorenzo Alho AT, Nguy A, Leite RE, Rodriguez RD, Mejia MB, Sue-moto CK, Ferretti-Rebustini RE, Polichiso L, Nascimento CF, Seeley WW, Nitrini R, Pasqualucci CA, Jacob Filho W, Rueb U, Neuhaus J, Heinsen H, Grinberg LT. Locus coeruleus volume and cell population changes during Alzheimer’s disease progression: a stereological study in human postmortem brains with potential implication for early-stage biomarker discovery. Alzheimers Dement. 2016;???:???–???. doi: 10.1016/j.jalz.2016.06.2362. [DOI] [PMC free article] [PubMed] [Google Scholar]
- 32.Chan-Palay V, Asan E. Alterations in catecholamine neurons of the locus coeruleus in senile dementia of the Alzheimer type and in Parkinson’s disease with and without depression. J Comp Neurol. 1989;287:373–92. doi: 10.1002/cne.902870308. [DOI] [PubMed] [Google Scholar]
- 33.Seeley WW, Crawford RK, Zhou J, Miller BL, Greicius MD. Neurodegenerative diseases target large-scale human brain networks. Neuron. 2009;62:42–52. doi: 10.1016/j.neuron.2009.03.024. [DOI] [PMC free article] [PubMed] [Google Scholar]
- 34.Grinberg LT, Ferretti RE, Farfel JM, Leite R, Pasqualucci CA, Rosemberg S, Nitrini R, Saldiva PH, Filho WJ. Brain bank of the Brazilian aging brain study group - a milestone reached and more than 1,600 collected brains. Cell Tissue Bank. 2007;8:151–62. doi: 10.1007/s10561-006-9022-z. [DOI] [PubMed] [Google Scholar]
- 35.Montine TJ, Phelps CH, Beach TG, Bigio EH, Cairns NJ, Dickson DW, Duyckaerts C, Frosch MP, Masliah E, Mirra SS, Nelson PT, Schneider JA, Thal DR, Trojanowski JQ, Vinters HV, Hyman BT, National Institute on Aging; Alzheimer’s Association National Institute on Aging-Alzheimer’s Association guidelines for the neuropathologic assessment of Alzheimer’s disease: a practical approach. Acta Neuropathol. 2012;123:1–11. doi: 10.1007/s00401-011-0910-3. [DOI] [PMC free article] [PubMed] [Google Scholar]
- 36.Mackenzie IR, Neumann M, Baborie A, Sampathu DM, Du Plessis D, Jaros E, Perry RH, Trojanowski JQ, Mann DM, Lee VM. A harmonized classification system for FTLD-TDP pathology. Acta Neuropathol. 2011;122:111–13. doi: 10.1007/s00401-011-0845-8. [DOI] [PMC free article] [PubMed] [Google Scholar]
- 37.Mckeith IG, Dickson DW, Lowe J, Emre M, O’Brien JT, Feldman H, Cummings J, Duda JE, Lippa C, Perry EK, Aarsland D, Arai H, Ballard CG, Boeve B, Burn DJ, Costa D, Del Ser T, Dubois B, Galasko D, Gauthier S, Goetz CG, Gomez-Tortosa E, Halliday G, Hansen LA, Hardy J, Iwatsubo T, Kalaria RN, Kaufer D, Kenny RA, Korczyn A, Kosaka K, Lee VMY, Lees A, Litvan I, Londos E, Lopez OL, Minoshima S, Mizuno Y, Molina JA, Mukaetova-Ladinska EB, Pasquier F, Perry RH, Schulz JB, Trojanowski JQ, Yamada M. Diagnosis and management of dementia with Lewy bodies – Third report of the DLB consortium. Neurology. 2005;65:1863–72. doi: 10.1212/01.wnl.0000187889.17253.b1. [DOI] [PubMed] [Google Scholar]
- 38.Heinsen H, Arzberger T, Schmitz C. Celloidin mounting (embedding without infiltration) – a new, simple and reliable method for producing serial sections of high thickness through complete human brains and its application to stereological and immunohistochemical investigations. J Cheml Neuroanat. 2000;20:49–59. doi: 10.1016/s0891-0618(00)00067-3. [DOI] [PubMed] [Google Scholar]
- 39.West MJ, Slomianka L, Gundersen HJ. Unbiased stereological estimation of the total number of neurons in the subdivisions of the rat hippocampus using the optical fractionator. Anat Rec. 1991;231:482–97. doi: 10.1002/ar.1092310411. [DOI] [PubMed] [Google Scholar]
- 40.Chan-Palay V, Asan E. Quantitation of catecholamine neurons in the locus coeruleus in human brains of normal young and older adults and in depression. J Comp Neurol. 1989;287:357–72. doi: 10.1002/cne.902870307. [DOI] [PubMed] [Google Scholar]
- 41.German DC, Walker BS, Manaye K, Smith WK, Woodward DJ, North AJ. The human locus coeruleus: computer reconstruction of cellular distribution. J Neurosci. 1988;8:1776–88. doi: 10.1523/JNEUROSCI.08-05-01776.1988. [DOI] [PMC free article] [PubMed] [Google Scholar]
- 42.Ohm TG, Busch C, Bohl J. Unbiased estimation of neuronal numbers in the human nucleus coeruleus during aging. Neurobiol Aging. 1997;18:393–9. doi: 10.1016/s0197-4580(97)00034-1. [DOI] [PubMed] [Google Scholar]
- 43.Keren NI, Lozar CT, Harris KC, Morgan PS, Eckert MA. In vivo mapping of the human locus coeruleus. NeuroImage. 2009;47:1261–7. doi: 10.1016/j.neuroimage.2009.06.012. [DOI] [PMC free article] [PubMed] [Google Scholar]
- 44.Olszewski J, Baxter D. Cytoarchitecture of the Human Brain Stem. Basel: Karger; 1982. [Google Scholar]
- 45.Rub U, Del Tredici K, Schultz C, Thal DR, Braak E, Braak H. The evolution of Alzheimer’s disease-related cytoskeletal pathology in the human raphe nuclei. Neuropathol Appl Neurobiol. 2000;26:553–67. doi: 10.1046/j.0305-1846.2000.00291.x. [DOI] [PubMed] [Google Scholar]
- 46.Schneider CA, Rasband WS, Eliceiri KW. NIH Image to ImageJ: 25 years of image analysis. Nat Methods. 2012;9:671–5. doi: 10.1038/nmeth.2089. [DOI] [PMC free article] [PubMed] [Google Scholar]
- 47.Di Lorenzo Alho AT, Suemoto CK, Polichiso L, Tampellini E, de Oliveira KC, Molina M, Santos GA, Nascimento C, Leite RE, de Lucena Ferreti-Rebustini RE, da Silva AV, Nitrini R, Pasqualucci CA, Jacob-Filho W, Heinsen H, Grinberg LT. Three-dimensional and stereological characterization of the human substantia nigra during aging. Brain Struct Funct. 2015;???:???–???. doi: 10.1007/s00429-015-1108-6. [DOI] [PMC free article] [PubMed] [Google Scholar]
- 48.Gundersen HJ, Jensen EB, Kieu K, Nielsen J. The efficiency of systematic sampling in stereology–reconsidered. J Microsc. 1999;193:199–211. doi: 10.1046/j.1365-2818.1999.00457.x. [DOI] [PubMed] [Google Scholar]
- 49.Schmitz C, Hof PR. Design-based stereology in neuroscience. Neuroscience. 2005;130:813–31. doi: 10.1016/j.neuroscience.2004.08.050. [DOI] [PubMed] [Google Scholar]
- 50.Baker KG, Halliday GM, Tork I. Cytoarchitecture of the human dorsal raphe nucleus. J Comp Neurol. 1990;301:147–61. doi: 10.1002/cne.903010202. [DOI] [PubMed] [Google Scholar]
- 51.Team RC. R: A Language and Environment for Statistical Computing. Vienna, Austria: R Foundation for Statistical Computing; 2015. [Google Scholar]
- 52.Busch C, Bohl J, Ohm TG. Spatial, temporal and numeric analysis of Alzheimer changes in the nucleus coeruleus. Neurobiol Aging. 1997;18:401–6. doi: 10.1016/s0197-4580(97)00035-3. [DOI] [PubMed] [Google Scholar]
- 53.Grudzien A, Shaw P, Weintraub S, Bigio E, Mash DC, Mesulam MM. Locus coeruleus neurofibrillary degeneration in aging, mild cognitive impairment and early Alzheimer’s disease. Neurobiol Aging. 2007;28:327–35. doi: 10.1016/j.neurobiolaging.2006.02.007. [DOI] [PubMed] [Google Scholar]
- 54.Heneka MT, Nadrigny F, Regen T, Martinez-Hernandez A, Dumitrescu-Ozimek L, Terwel D, Jardanhazi-Kurutz D, Walter J, Kirchhoff F, Hanisch UK, Kummer MP. Locus coeruleus controls Alzheimer’s disease pathology by modulating microglial functions through nore-pinephrine. Proc Natl Acad Sci U S A. 2010;107:6058–63. doi: 10.1073/pnas.0909586107. [DOI] [PMC free article] [PubMed] [Google Scholar]
- 55.Ross JA, McGonigle P, Van Bockstaele EJ. Locus Coeruleus, norepinephrine and Abeta peptides in Alzheimer’s disease. Neurobiol Stress. 2015;2:73–84. doi: 10.1016/j.ynstr.2015.09.002. [DOI] [PMC free article] [PubMed] [Google Scholar]
- 56.Loughlin SE, Foote SL, Bloom FE. Efferent projections of nucleus locus coeruleus: topographic organization of cells of origin demonstrated by three-dimensional reconstruction. Neuroscience. 1986;18:291–306. doi: 10.1016/0306-4522(86)90155-7. [DOI] [PubMed] [Google Scholar]
- 57.Freedman R, Foote SL, Bloom FE. Histochemical char-acterization of a neocortical projection of the nucleus locus coeruleus in the squirrel monkey. J Comp Neurol. 1975;164:209–31. doi: 10.1002/cne.901640205. [DOI] [PubMed] [Google Scholar]
- 58.Marcyniuk B, Mann DM, Yates PO. Loss of nerve cells from locus coeruleus in Alzheimer’s disease is topographically arranged. Neurosci Lett. 1986;64:247–52. doi: 10.1016/0304-3940(86)90336-8. [DOI] [PubMed] [Google Scholar]
- 59.Morsch R, Simon W, Coleman PD. Neurons may live for decades with neurofibrillary tangles. J Neuropathol Exp Neurol. 1999;58:188–97. doi: 10.1097/00005072-199902000-00008. [DOI] [PubMed] [Google Scholar]
- 60.Bobinski M, Wegiel J, Tarnawski M, Deleon MJ, Reisberg B, Miller DC, Wisniewski HM. Duration of neurofibrillary changes in the hippocampal pyramidal neurons. Brain Res. 1998;799:156–8. doi: 10.1016/s0006-8993(98)00441-7. [DOI] [PubMed] [Google Scholar]
Associated Data
This section collects any data citations, data availability statements, or supplementary materials included in this article.
Supplementary Materials
Table S1. The stereological estimates with the demographic and pathologic data for the 48 cases used in this study.