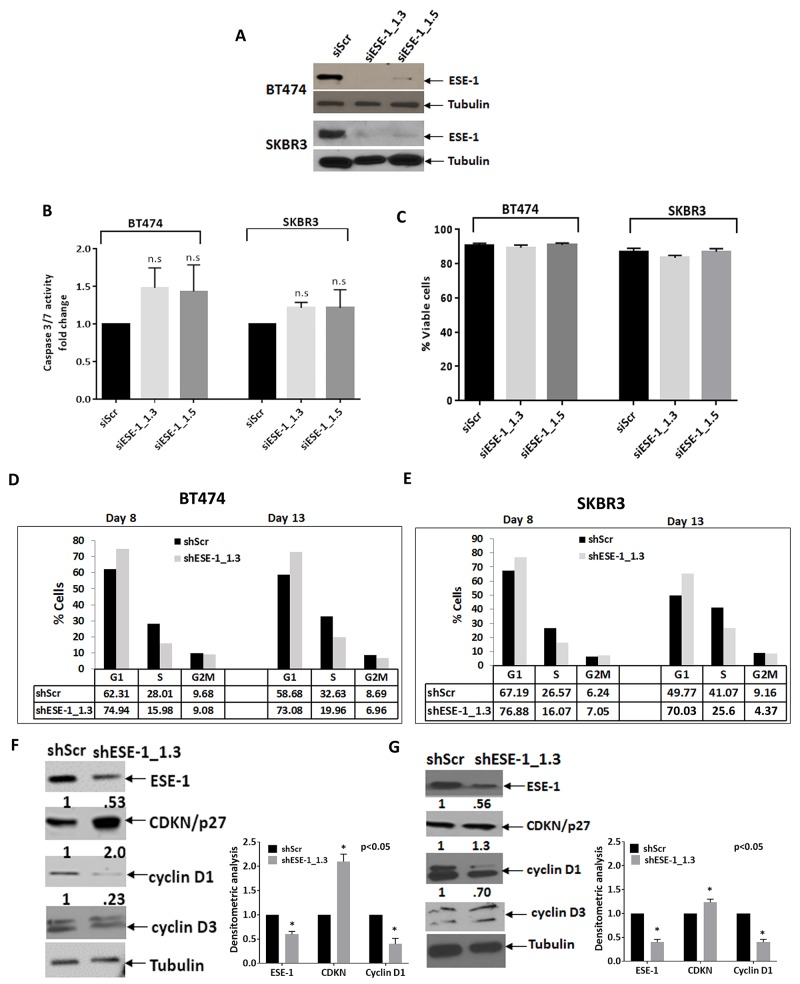
Figure 4. ESE-1 KD does not affect apoptosis but causes a delay in progression through G1.
(A) A Western blot showing transient ESE-1 knockdown using siESE-1_1.3 and siESE-1_1.5 in BT474 and SKBR3 cells, 3 days post transfection. Transfection with siESE-1 (70 nM) almost completely inhibits ESE-1 expression. (B) Caspase 3/7 activity at day 3 post-transfection in BT474 and SKBR3 cells. The caspase 3/7 activity of the scramble control was set to 1, and that of the siESE-1 transfected cells were normalized to the scramble control value and expressed as fold change. There is no statistically significant difference between the knockdown and the control. In BT474 cells, the p values for the si-ESE-1_1.3=0.080 and for siESE-1_1.5=0.170 and in SKBR3 cells the p values for the si-ESE-1_1.3=0.148 and 0.427 for siESE-1_1.5. (C) Viability of the siESE-1 transfected BT474 and SKBR3 cells. Viability was measured by the trypan blue exclusion method using the Beckman coulter Vi-cell. (D) Cell cycle analyses of the DNA content were done on a synchronized cell population of BT474 cells. (E) Cell cycle analyses in SKBR3 cells were done on an unsynchronized cell population. Cell cycle analysis was performed, as detailed in Methods. The numbers on the Y axis represent the percent of cells at G1, S, and G2M for the knockdown and the scramble control, and are representative of three or more biological repeats. The cells were collected at 8 days and 13 days post transduction. The p-values were calculated using all three replicates (see Supplementary Figure and text). ESE-1 KD cells progress through the G1 slowly compared to the scramble controls. All p values were estimated from the results of 3 experiments. (E, F). Western blot with anti-cyclin D1, anti-cyclin D3, anti-p27kip1 on a portion of the cells collected at day 8.

