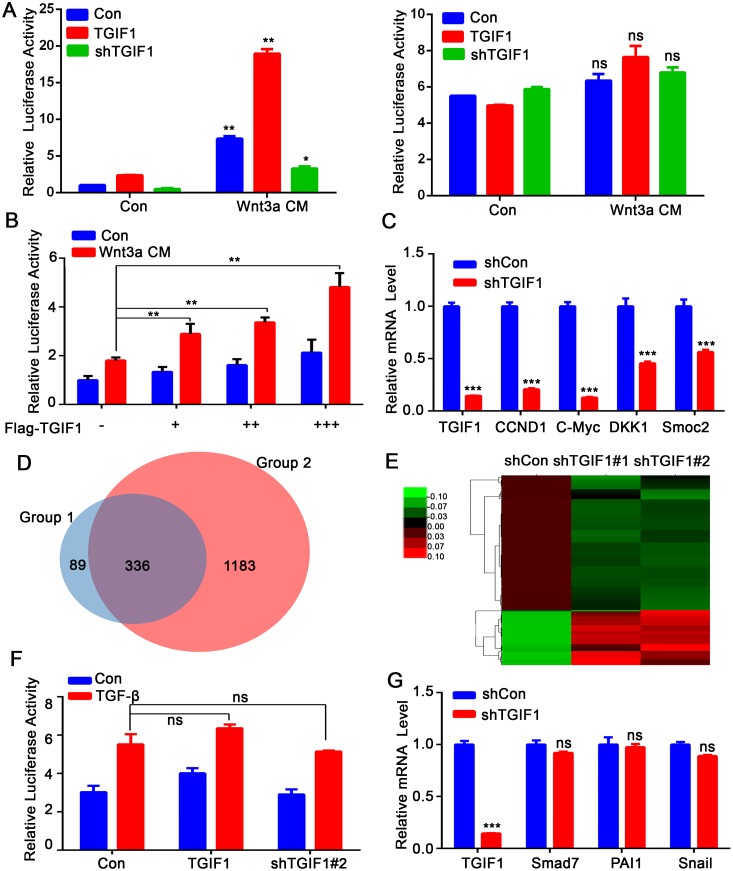
Figure 4. TGIF1 activates Wnt signaling in colon cancer cells.
(A) After HEK293T cells were transfected with Topflash-luciferase together with TGIF1, shTGIF1 or control vector for 24 hours, the cells were treated with Wnt3a conditional medium for another 24 hours and then harvested to measure luciferase activity. Right: Fopflash served as a negative control. **, p <0.01; ns, p >0.05. (B) HCT116 cells were transfected with TopFlash-luciferase and different amount of TGIF1 and harvested to measure luciferase activity after Wnt3a treatment. **, p <0.01. (C) mRNA levels of Wnt target genes (CCND1, c-Myc, AXIN2, DKK1 and Smoc2) were examined by qRT-PCR in control and TGIF1 knockdown LoVo cells. *, p <0.05; ***, p < 0.001. (D) Venn diagram was generated to visualize overlapping genes between group 1 and group 2. Group 1 refers to shTGIF (altered in both shTGIF1#1 and shTGIF1#2) and Group 2 refers to shβ-catenin samples. (E) The heat map of genes expression ratio between shTGIF1#1 and shTGIF1#2. Green indicates that the gene is downregulated and red represents upregulated genes. (F) HCT116 cells were transfected with CAGA-luciferase together with TGIF1 expression or shRNA vector and harvested to measure luciferase activity after TGF-β (100pM) treatment. ns, p >0.05. (G) qRT-PCR analysis of TGF-β target genes (Smad7, PAI1 and Snail1) in control and TGIF1 knockdown LoVo cells. ***, p < 0.001; ns, p >0.05.

