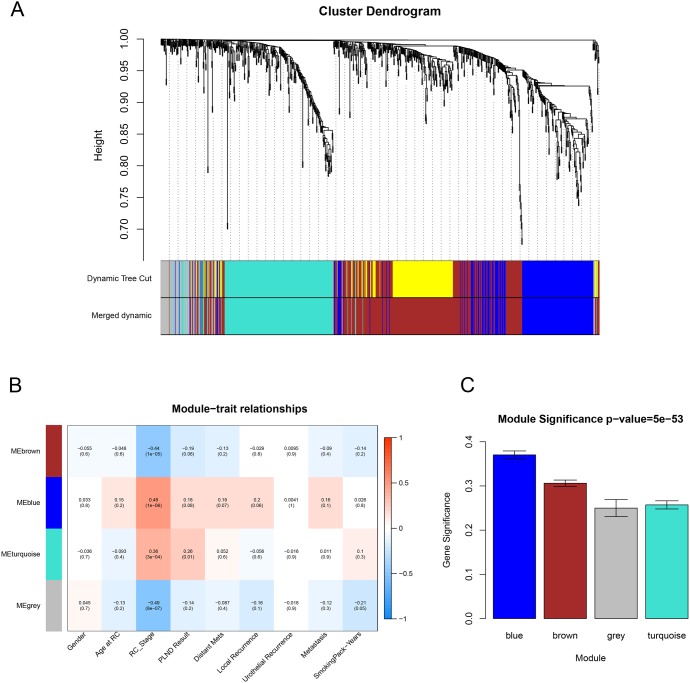
Figure 3. Identification of modules associated with clinical information.
(A) Dendrogram of all differentially expressed genes clustered based on a dissimilarity measure (1-TOM). (B) Heatmap of the correlation between module eigengenes and different clinical information of BCa (Gender, Age at RC, RC_Stage, PLIND Results, Distant Mets, Local Recurrence, Urothelial Recurrence, Metastasis and SmokingPack-Years). (C) Distribution of average gene significance and errors in the modules associated with the progression of BCa.

