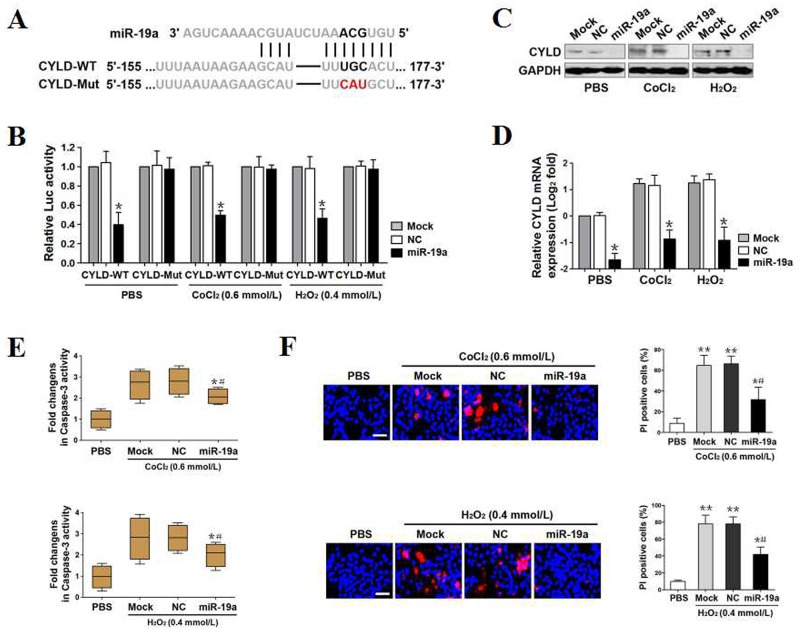
Figure 2. MiR-19a directly targets CYLD and antagonizes OS-initiated apoptosis.
(A) Predicted miR-19a target sequence in wild-type CYLD-3′UTR (CYLD-WT) and mutant CYLD-3′UTR containing mutated nucleotides in the miR-19a seed-pairing region (CYLD-Mut). (B) Luciferase assays of CYLD-3′UTR activity in PC12 cells cotransfected with WT or Mut CYLD-3′UTR reporter constructs and mock (Mock), negative control (NC) as well as miR-19a mimics (miR-19a) in the presence of PBS, 0.6 mmol/L CoCl2 or 0.4 mmol/L H2O2 treatment, respectively. Experiments were performed three times and data are expressed as mean ± s.d. *p < 0.05 versus Mock and NC, one-way ANOVA, post hoc comparisons, Tukey’s test. (C) Western-blotting examining abundance of CYLD protein expression in PC12 cells transfected with mock (Mock), negative control (NC) and miR-19a mimics (miR-19a) in the presence of PBS, 0.6 mmol/L CoCl2 or 0.4 mmol/L H2O2 treatment, respectively. GAPDH was used as internal control of cytoplasmic extractions. (D) RT-qPCR analysing levels of CYLD mRNA expression in PC12 cells transfected with mock (Mock), negative control (NC) and miR-19a mimics (miR-19a) in the presence of PBS, 0.6 mmol/L CoCl2 or 0.4 mmol/L H2O2 treatment, respectively. Experiments were performed five times, each with quantitative RT-PCR in technical duplicate and real-time values were normalized to glyceraldehyde 3-phosphate dehydrogenase (GAPDH). Data are expressed as mean ± s.d. *p < 0.05 versus Mock and NC, one-way ANOVA, post hoc comparisons, Tukey’s test. (E) Caspase-3 activity assays of PC12 cells exposed to 0.6 mmol/L CoCl2 (top panel) or 0.4 mmol/L H2O2 (bottom panel) with mock (Mock), negative control (NC) and miR-19a mimics (miR-19a) transfection, respectively. Experiments were performed three times and data are expressed as mean ± s.d. *p < 0.05 versus PBS; #p < 0.05 versus Mock and NC, one-way ANOVA, post hoc comparisons, Tukey’s test. (F) Representative pictures (left panel) and quantification (right panel) from Hoechst and PI double-staining assay of PC12 cells exposed to 0.6 mmol/L CoCl2 (top panel) or 0.4 mmol/L H2O2 (bottom panel) with mock (Mock), negative control (NC) and miR-19a mimics (miR-19a) transfection, respectively. Data are expressed as mean ± s.d. *p < 0.05, **p < 0.01 versus PBS; #p < 0.05 versus Mock and NC, one-way ANOVA, post hoc comparisons, Tukey’s test.

