Significance
Atherosclerotic plaques tend to develop preferentially in areas of the vasculature exposed to low and disturbed shear stress (SS), but the mechanisms are not fully understood. In this study, we demonstrate that inefficient autophagy contributes to the development of atherosclerotic plaques in low-SS areas. Defective endothelial autophagy not only curbs endothelial alignment with the direction of blood flow, but also promotes an inflammatory, apoptotic, and senescent phenotype. Furthermore, genetic inactivation of endothelial autophagy in a murine model of atherosclerosis increases plaque burden exclusively in high-SS areas that are normally resistant to atherosclerotic plaque development. Altogether, these findings underline the role of endothelial autophagic flux activation by SS as an atheroprotective mechanism.
Keywords: endothelial, autophagy, shear stress, atherosclerosis, inflammation
Abstract
It has been known for some time that atherosclerotic lesions preferentially develop in areas exposed to low SS and are characterized by a proinflammatory, apoptotic, and senescent endothelial phenotype. Conversely, areas exposed to high SS are protected from plaque development, but the mechanisms have remained elusive. Autophagy is a protective mechanism that allows recycling of defective organelles and proteins to maintain cellular homeostasis. We aimed to understand the role of endothelial autophagy in the atheroprotective effect of high SS. Atheroprotective high SS stimulated endothelial autophagic flux in human and murine arteries. On the contrary, endothelial cells exposed to atheroprone low SS were characterized by inefficient autophagy as a result of mammalian target of rapamycin (mTOR) activation, AMPKα inhibition, and blockade of the autophagic flux. In hypercholesterolemic mice, deficiency in endothelial autophagy increased plaque burden only in the atheroresistant areas exposed to high SS; plaque size was unchanged in atheroprone areas, in which endothelial autophagy flux is already blocked. In cultured cells and in transgenic mice, deficiency in endothelial autophagy was characterized by defects in endothelial alignment with flow direction, a hallmark of endothelial cell health. This effect was associated with an increase in endothelial apoptosis and senescence in high-SS regions. Deficiency in endothelial autophagy also increased TNF-α–induced inflammation under high-SS conditions and decreased expression of the antiinflammatory factor KLF-2. Altogether, these results show that adequate endothelial autophagic flux under high SS limits atherosclerotic plaque formation by preventing endothelial apoptosis, senescence, and inflammation.
Atherosclerosis develops at arterial bifurcations and at the inner part of curvatures where blood flow is low or disturbed, whereas areas exposed to high blood flow, generating high laminar shear stress (SS) on the endothelium, remain lesion-free (1–4). Low SS is known to induce endothelial apoptosis, which in turn increases their procoagulant and proadhesive phenotype for platelets (5–7). Endothelial cells with senescence-associated phenotype are present in low-SS areas (8, 9). Senescent endothelial cells exhibit a proinflammatory phenotype that may contribute to the initiation and progression of atherosclerosis (9, 10). Low SS also stimulates endothelial expression of adhesion molecules and the release of chemokines that contribute to leukocyte recruitment, the early steps of atherosclerotic plaque formation (4, 11). However, the regulation of endothelial phenotypes by SS remains not fully elucidated.
Macroautophagy (hereafter referred to as autophagy) is a major intracellular recycling system. Under basal conditions, autophagy controls organelle and protein quality to maintain cellular homeostasis. Under conditions of stress, autophagy acts as a survival mechanism, maintaining cellular integrity by regenerating metabolic precursors and clearing subcellular debris (12). Autophagy primarily acts as a protective mechanism preventing cell death and senescence (12). This process modulates an expanding list of disease processes (12). Recent data indicate that mice deficient in endothelial Atg7, a key protein in autophagy process, develop more atherosclerotic plaques, but the mechanism remains elusive (13). Several groups have investigated the effect of SS on endothelial autophagy, with conflicting results. Most groups have found that SS activates autophagy in cultured endothelial cells (14–20), but a few investigators have compared the effects of different SS levels and reported paradoxical findings (14, 16–18, 21). The rare analyses of animal vessels did not help in drawing reliable conclusions (16, 18, 21). Importantly, the consequences of defective autophagy on endothelium health, i.e., apoptosis, senescence, and inflammatory phenotype, have not been thoroughly investigated (14). This led us to test the hypothesis that autophagy mediates the effect of SS on atherosclerosis development.
Results
Autophagy Is Defective in Endothelial Cells Exposed to Low SS.
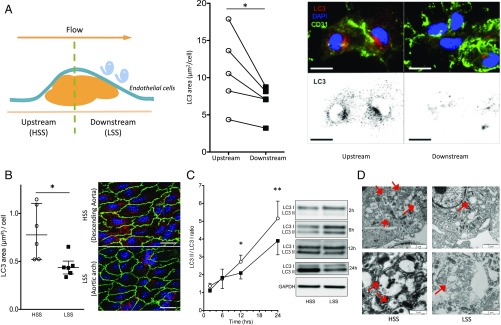
Given the inconsistent in vitro results regarding the effect of SS on endothelial autophagy (14, 16–18, 21), we first examined endothelial autophagy level in isolated human and murine arteries by assessing LC3 punctae labeling (22). In human carotid arteries, LC3 staining was systematically less abundant in endothelial cells exposed to a disturbed low SS compared with those exposed to physiological high SS (7, 23, 24) (Fig. 1A and SI Appendix, Table S1). In murine arteries, en face LC3 staining of the inner part of the curvature of the aorta, exposed to a disturbed low SS, was significantly lower than that in the linear part of the descending thoracic aorta, exposed to a physiological high SS (Fig. 1B). This difference was observed in males as well as in females. Endothelial autophagy was then evaluated by measuring the LC3II/LC3I ratio in low-passage cultured human umbilical vein endothelial cells (HUVECs) exposed to 2 vs 20 dyn/cm2 SS for as long as 24 h (Fig. 1C). A difference between low and high SS appeared after 12 h and was more pronounced at 24 h (Fig. 1C). Similar results were also observed when expressing LC3 as a ratio of LC3II to GAPDH (SI Appendix, Fig. S1A) and when measuring LC3 by flow cytometry analysis (SI Appendix, Fig. S1B). Finally, transmission EM analysis revealed a lower number of autophagic vacuoles in HUVECs exposed to low than to high SS (n = 3; Fig. 1D). Altogether, these results demonstrate that autophagy is reduced in endothelial cells exposed to low SS compared with high SS.
Fig. 1.
Autophagy is defective in endothelial cells exposed to low SS (LSS). (A) LC3 en face staining of human endothelial cells isolated from endarterectomy specimen. (Left) Typical longitudinal section of a carotid atherosclerotic plaque showing upstream (exposed to high physiological SS) and downstream (exposed to low disturbed SS) parts. (Middle) Quantification. (Right) Representative images (green, CD31; red, LC3; blue, DAPI). (Scale bar, 10 μm.) Between 50 and 125 cells were counted per area for each patient. (B) LC3 en face staining of the aorta of 10-wk-old C57BL/6 mice (n = 6; green, CD31; red, LC3; blue, DAPI). (Scale bar, 20 μm). (Left) Quantification of LC3 area; data are given as median (horizontal bar) and interquartile range (error bar). (Right) Representative images. (C) Western blot analysis of LC3II/LC3I ratio in HUVECs exposed to high SS (HSS) and low SS. Data are normalized to static conditions for each time point (n ≥ 5 per time point and per SS condition). Data are mean ± SEM. (D) Transmission EM analysis of HUVECs exposed to high and low SS for 24 h. Representative pictures of three independent experiments. Red arrows indicate autophagic vacuoles (*P < 0.05 and **P < 0.01).
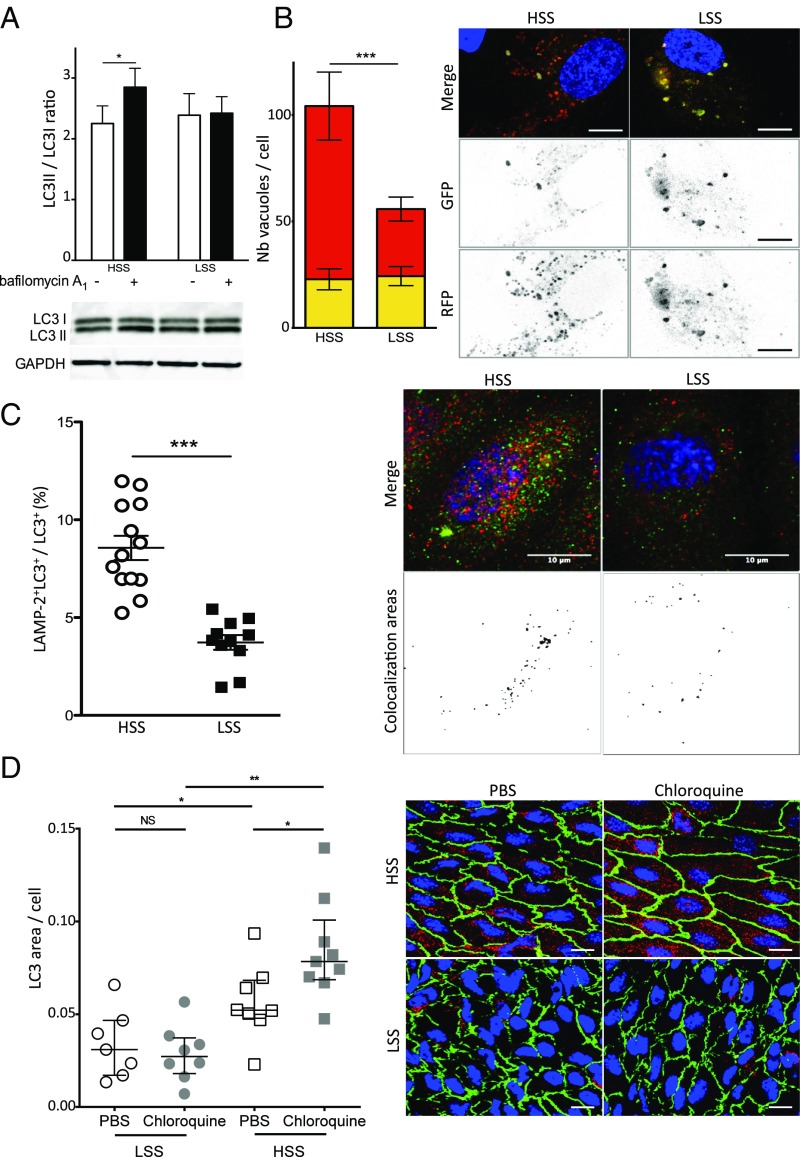
Complete autophagy requires the fusion of autophagosomes with lysosomes. To evaluate the autophagy flux, we treated HUVECs with bafilomycin A1, an inhibitor of autophagic flux. In HUVECs exposed to high SS for 6 h, bafilomycin A1 increased the LC3II/LC3I ratio, attesting to a functional autophagic flux under these conditions (Fig. 2A). On the contrary, bafilomycin A1 had no effect under low SS conditions, suggesting a blockade of the fusion between autophagosomes and lysosomes under these conditions (Fig. 2A). To confirm these data, we used a tandem monomeric red fluorescent protein (mRFP)-GFP-LC3 assay as a complementary strategy. In this assay, autophagosomes are labeled with a yellow signal (mRFP-GFP-LC3), and their maturation into autolysosomes is attested by a red signal as a result of the quenching of GFP fluorescence in lysosomes. As shown in Fig. 2B, RFP fluorescence was twofold lower in HUVECs exposed to low-SS compared with high-SS conditions, attesting to a blockade of autophagic flux under low SS. Similarly, colocalization of LC3 and the lysosomal marker LAMP2 was lower under low-SS than under high-SS conditions, confirming an impaired autophagic flux under low SS (Fig. 2C). We then investigated autophagic flux in vivo by injecting WT mice with chloroquine, an inhibitor of autophagic flux. As shown in Fig. 2D, chloroquine enhanced LC3 staining in high-SS areas but had no effect in low-SS areas, confirming the results obtained in vitro.
Fig. 2.
Autophagic flux is blocked under low SS (LSS). (A) LC3 II/LC3 I ratio quantified by Western blot in HUVECs exposed to high SS (HSS) and low SS (n = 5; 6 h of SS including 4 h of bafilomycin A1, 100 nmol/L). (B) Quantification of HUVECs transfected with the tandem mRFP-GFP-LC3 plasmid and exposed for 24 h to high or low SS. Yellow bars represent autophagosomes, and red bars represent autolysosomes. Images are representative of three independent experiments in which more than 100 cells were observed. Autophagosomes are labeled with a yellow signal, whereas autolysosomes are labeled with a red signal. (Scale bar, 10 μm.) (C) Immunofluorescent LAMP2 and LC3 staining on HUVECs exposed to high or low SS for 24 h. (Left) Quantification. (Right) Representative images (red, LC3; green, LAMP2; blue, DAPI). Data are presented as mean ± SEM (*P < 0.05, **P < 0.01, and ***P < 0.001). (D) LC3 en face staining of the aorta of 8-wk-old C57BL/6 male mice injected i.p. with PBS solution or chloroquine (60 mg/kg/d; 48 h, 24 h, and 4 h before euthanasia; n = 7–9 per group; green, CD144; red, LC3; blue, DAPI). (Scale bar, 20 μm.) (Left) Quantification of LC3 area. Data are given as median (horizontal bar) and interquartile range (error bar). (Right) Representative images.
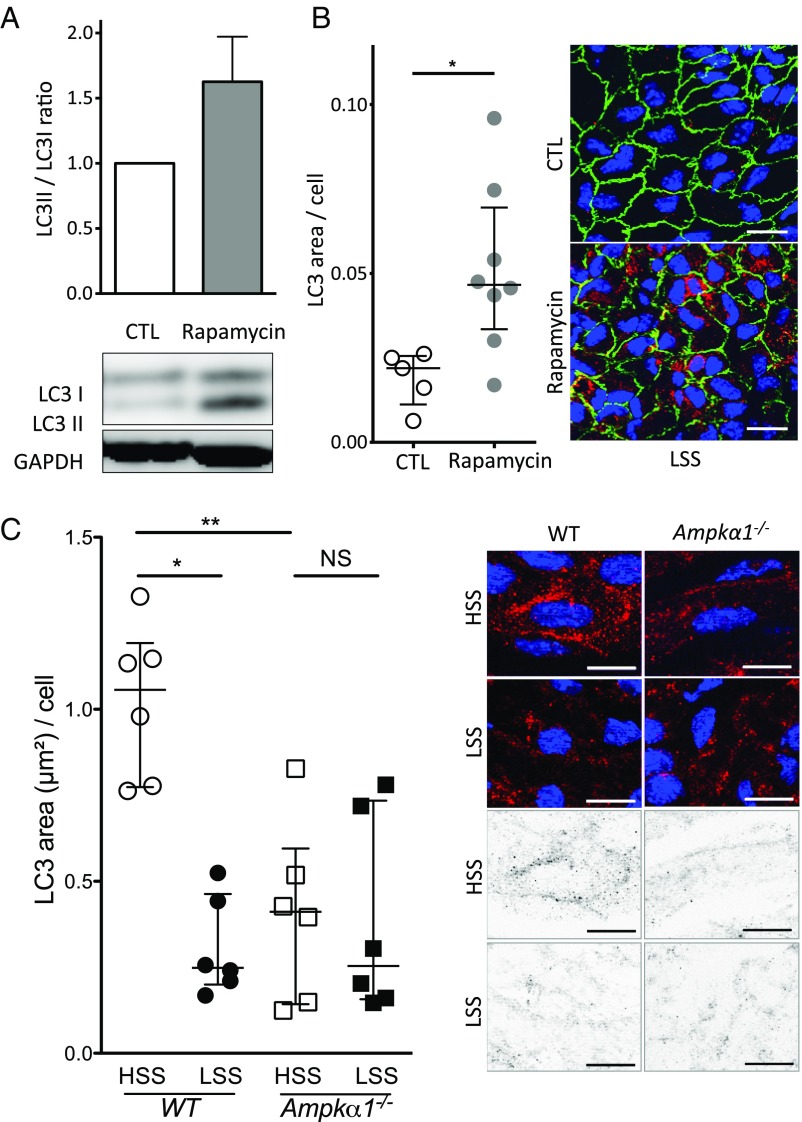
We then investigated the pathways responsible for this defect in endothelial autophagy under low SS. Exposure to SS for as long as 24 h did not alter endothelial expression of the key proteins of the autophagy pathway, namely Beclin1, ATG5, and ATG7 (SI Appendix, Fig. S1C and Table S3). LAMP2 expression was also unaffected (SI Appendix, Fig. S1C). The mammalian target of rapamycin (mTOR) and AMPK pathways are master negative and positive regulators of autophagy, respectively (25). Low SS increased 4EBP1 phosphorylation, confirming the activation of mTOR pathway under these experimental conditions (26) (SI Appendix, Fig. S1D). Inhibition of mTOR by using rapamycin increased autophagy level in HUVECs exposed to low-SS condition (Fig. 3A). Similarly, injection of rapamycin into WT mice increased LC3 staining in endothelial cells in low-SS areas (Fig. 3B). As previously described, we observed reduced phosphorylation of AMPKα and of its substrate, acetyl-CoA carboxylase, under low-SS conditions (26–28) (SI Appendix, Fig. S1 E and F). To ascertain the implication of AMPKα in the regulation of endothelial autophagy by SS, we evaluated LC3 staining in endothelial cells from the aorta of mice deficient in Ampkα1 (Fig. 3C). Endothelial LC3 staining in high-SS areas was significantly lower in Ampkα1-deficient mice than in littermate WT mice. Moreover, endothelial LC3 labeling was not different between high- and low-SS areas of the aorta of Ampkα1-deficient mice, whereas it was significantly lesser in low-SS than in high-SS areas of WT mice. These results support the hypothesis that the AMPKα pathway mediates endothelial autophagy activation by high SS.
Fig. 3.
Decreased AMPKα activity and increased mTOR activity concurrent with endothelial autophagy defect under low SS (LSS). (A) Western blot analysis of LC3II/LC3I ratio in HUVECs exposed to low SS for 24 h in the presence or absence of rapamycin (0.5 μmol/L; n = 3; data are normalized to static condition and are presented as mean ± SEM). (B) LC3 en face staining of the aorta of 9-wk-old C57BL/6 male mice injected i.p. with DMSO alone or with rapamycin (4 mg/kg/d 24 h and 4 h before euthanasia; n = 5 vs. n = 8, respectively; green, CD144; red, LC3; blue, DAPI). (Scale bar, 20 μm.) (Left) Quantification of LC3 area. Data are given as median (horizontal bar) and interquartile range (error bar). (Right) Representative images. (C) LC3 en face staining of the aorta of 12-wk-old Ampkα1-deficient and WT mice (red, LC3; blue, DAPI; n = 6). (Scale bar, 10 μm.) Data are given as median (horizontal bar) and interquartile range (error bar). HSS, high SS.
Taken together, these results demonstrate that the defect in endothelial autophagy under low-SS conditions results from an inhibition of the AMPKα and activation of the mTOR pathways and is associated with a blockade of the autophagic flux.
Atherosclerotic Lesions in Hypercholesterolemic Mice Deficient in Endothelial Autophagy.
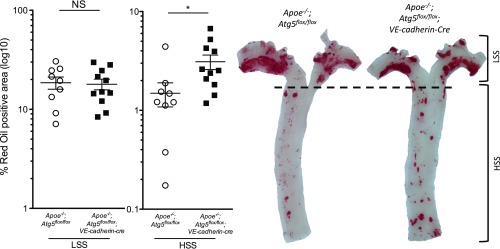
To assess the role of SS-induced autophagy on atherosclerotic plaque development, Apoe−/−;Atg5flox/flox;VE-cadherin-cre and littermate controls were fed a Western diet for 10 wk (SI Appendix, Fig. S2 A and B). In Apoe−/−;Atg5flox/flox mice, atherosclerotic plaques formed preferentially in the curvature of the aorta, whereas the descending thoracic aorta was protected from lesion development (Fig. 4). Plaque size increased by approximately 100% in the descending thoracic aorta of mice deficient in endothelial autophagy compared with littermate controls (Fig. 4). This difference persisted even after excluding plaques at the ostia of branching arteries, which correspond to small areas of the descending thoracic aorta where SS is low (SI Appendix, Fig. S2C). Unlike the descending thoracic aorta, we observed no significant difference in plaque size in the aortic arch between the two strains (Fig. 4).
Fig. 4.
Deficiency in endothelial autophagy promotes atherosclerosis. Twenty-three-week-old Apoe−/−;Atg5flox/flox (n = 9) and Apoe−/−;Atg5flox/flox;VE-cadherin-cre (n = 11) mice were fed a Western diet for 10 wk. Quantification of en face Oil Red O staining of atherosclerotic lesions in the aorta of these mice and representative images. (Scale bar, 1 mm.) Data are given as median (horizontal bar) and interquartile range (error bar; *P < 0.05, **P < 0.01, and ***P < 0.001; HSS, high SS; LSS, low SS).
Endothelial deficiency in ATG5 in the Apoe−/− mice had no effect on arterial blood pressure and cholesterol levels, body and organ weight, or blood cell count (SI Appendix, Table S4). Serum glucose level was significantly higher in Apoe−/−;Atg5flox/flox;VE-cadherin-cre mice than in littermate controls, but remained in the normal range, below 126 mg/dL. These data support a direct effect of endothelial autophagy on atherosclerotic plaque formation rather than an effect on systemic metabolic parameters.
Taken together, these findings demonstrate that deficiency in endothelial autophagy promotes atherosclerotic plaque formation in atheroresistant regions.
Deficiency in Endothelial Autophagy Disturbs Endothelial Alignment in Response to Flow.
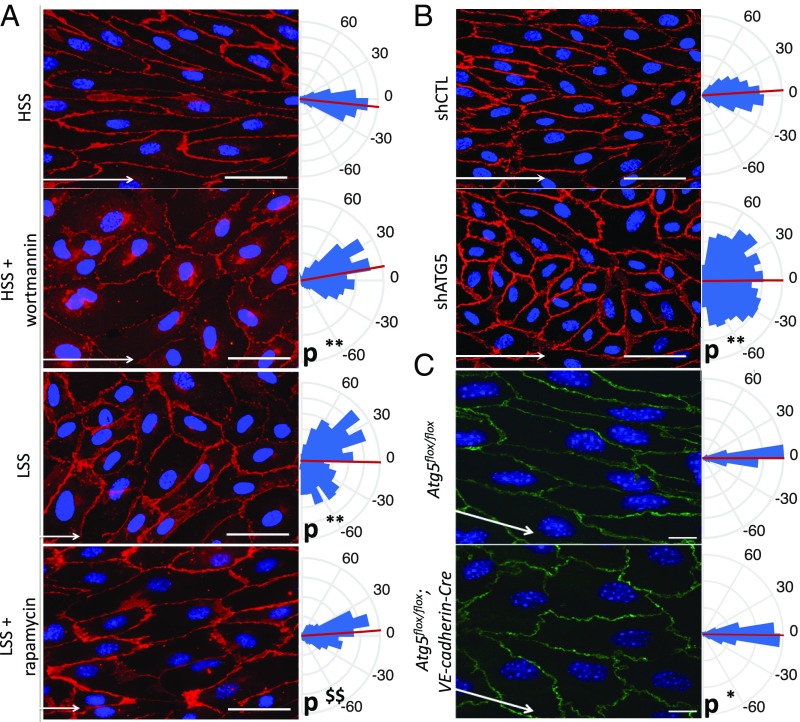
The presence of lesions in areas that are normally resistant to atherosclerosis suggested a role for defective endothelial autophagy in the impairment of flow-dependent atheroprotective mechanisms. We first examined endothelial cell alignment, which is a hallmark of atheroresistant areas and plays an important role in the flow-dependent activation of antiinflammatory vs. proinflammatory pathways (3, 29, 30). We observed that HUVECs failed to align with the direction of flow under high SS when autophagy was inhibited by a pharmacological approach (i.e., wortmannin) or a genetic approach (i.e., a lentivirus expressing an ATG5 shRNA; Fig. 5 A and B). Conversely, activation of autophagy by using rapamycin in HUVECs exposed to low SS induced an alignment in flow direction (Fig. 5A). To investigate the relevance of these findings in vivo, we generated two models of mice deficient in endothelial autophagy, Atg5flox/flox;VE-cadherin-cre and Atg7flox/flox;VE-cadherin-cre mice (SI Appendix, Fig. S3). In these transgenic mice, deficiency in endothelial ATG5 or ATG7 had no effect on arterial blood pressure, serum glucose and cholesterol levels, or body weight, but spleen and heart weights were slightly higher in Atg7flox/flox;VE-cadherin-cre mice but not in Atg5flox/flox;VE-cadherin-cre (SI Appendix, Tables S5 and S6). In line with the observations made in vitro, endothelial alignment in the direction of flow was disturbed in high-SS areas of the aorta of mice deficient in ATG5 or ATG7 (Fig. 5C and SI Appendix, Fig. S4).
Fig. 5.
Deficiency in endothelial autophagy impairs endothelial cells’ ability to align in the direction of flow. (A) Quantification of cell alignment in the direction of flow on HUVECs treated with wortmannin [high SS (HSS)] or with rapamycin [low SS (LSS)] or not treated (red, CD144 staining; blue, DAPI; n = 4; more than 900 cells analyzed). (Scale bar, 50 mm.) Kuiper two-sample test: **Kp < 0.01 vs. WT or high-SS control, respectively; $$Kp < 0.01 vs. low-SS control. White arrows represent flow direction. (B) Quantification of cell alignment in the direction of flow (high SS) on HUVECs infected with an shRNA control or with an shRNA targeting ATG5 (**Kp < 0.01). (C) Quantification of cell alignment in direction of flow in the linear part of the aorta (high SS) of Atg5flox/flox or Atg5flox/flox;VE-cadherin-Cre mice (green, CD144 staining; blue, DAPI; n = 6; *Kp < 0.05). (Scale bar, 10 μm.) All panels display representative images (Left) and quantifications (Right), which are shown as rose-plot representations of endothelial axial polarity. Arcs represent cell angle with flow direction, red lines the mean of cell angle, and blue triangles the percentage of cells aligned in each direction. Each triangle represents a range of 10°.
Role of PECAM-1 and of the Primary Cilium in SS Dependent Regulation of Endothelial Autophagy.
One of the main flow sensors in endothelial cells is the complex formed by PECAM-1 (CD31), VE-cadherin, and VEGFR2 (31). As this complex is involved in cell orientation under flow, we evaluated its contribution to the regulation of endothelial autophagic flux. Decreasing PECAM-1 expression in HUVECs did not change the effect of high and low SS on the LC3II/LC3I ratio (SI Appendix, Fig. S5A). Similarly, LC3 en face staining of the aorta of CD31−/− mice showed the persistence of the enhanced autophagy level in high-SS areas compared with low-SS areas (SI Appendix, Fig. S5B). The primary cilium is another mechanosensor expressed by endothelial cells (32) and differentially regulated between high- and low-SS areas. Recent data indicate that the primary cilium can regulate autophagy in epithelial cells (33). To determine whether the primary cilium mediates the effect of SS on endothelial autophagy in HUVECs, we silenced KIF3a, a protein essential for primary cilium function, and exposed these cells to high and low SS. As shown in SI Appendix, Fig. S5C, the effect of SS on LC3II/LC3I ratio was not modified by the deficiency in KIF3a. Altogether, these data indicate that the mechanosensor mediating endothelial SS effect on autophagy is neither PECAM-1 nor the primary cilium.
Deficiency in Endothelial Autophagy Promotes Endothelial Inflammation.
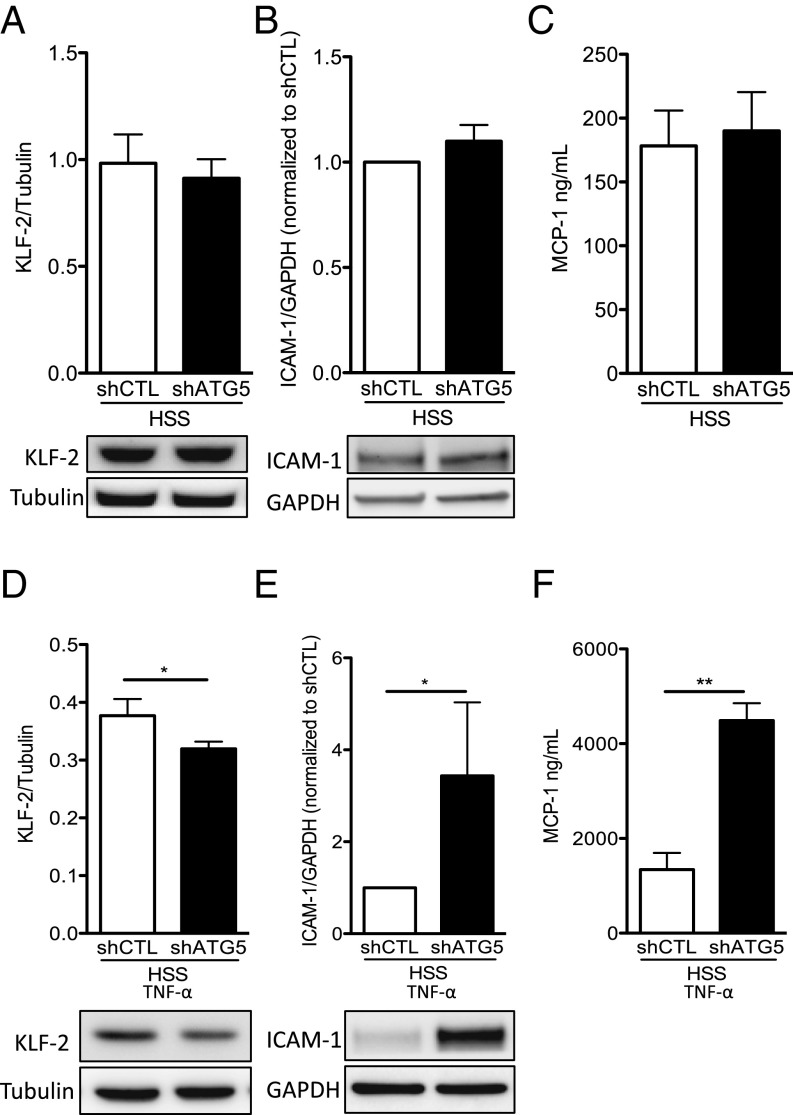
We then tested whether autophagy regulates endothelial inflammatory responses in high-SS conditions. Under control conditions, expression of KLF2 and ICAM-1 and release of MCP-1 were not different between HUVECs transduced with a lentivirus expressing an ATG5 shRNA and control cells (Fig. 6 A–C). By contrast, after exposure to the proinflammatory stimulus TNF-α, HUVECs deficient in autophagy expressed significantly less KLF2 and more ICAM-1 and released more MCP-1 than HUVECs transduced with a control shRNA (Fig. 6 D–F). This effect was not associated with an increase in autophagy level following TNF-α exposure (SI Appendix, Fig. S6). Altogether, these results establish that activation of endothelial autophagy by high SS is required for curbing the response to proinflammatory stimuli.
Fig. 6.
Deficiency in endothelial autophagy promotes endothelial inflammation. HUVECs were transduced with a lentivirus expressing an Atg5 or a control (CTL) shRNA and exposed to high SS (HSS) for 24 h without (A–C) or with (D–F) TNF-α (1 ng/mL) for the last 12 h. (A and D) Western blot quantification of KLF-2 expression in HUVEC (n = 6 and n = 5, respectively). Data are given as mean (horizontal bar) and SEM (error bar). (B and E) Western blot quantification of ICAM-1 expression in HUVEC (n = 4 and n = 6, respectively). (C and F) Quantification of MCP1 in the supernatants of HUVECs by ELISA (n = 8 and n = 6, respectively; *P < 0.05 and **P < 0.01).
Deficiency in Endothelial Autophagy Leads to Endothelial Apoptosis.
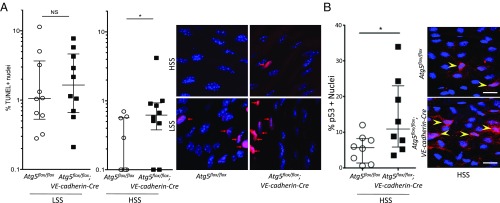
Previous in vitro data have suggested that high SS-induced autophagy could prevent apoptosis induced by H2O2 in endothelial cells (14). In WT mice, as expected, en face TUNEL staining showed more apoptotic nuclei in endothelial cells of the inner part of the curvature of the aortic arch exposed to low SS than in those of the linear part of the aorta exposed to high SS (7) (Fig. 7A). Interestingly, the linear part of the aorta of mice deficient in endothelial ATG5 contained fivefold more apoptotic cells than the same area of WT mice (Fig. 7A). As p53 controls apoptosis, we analyzed endothelial p53 expression in vivo. We exposed 13–17-wk-old mice deficient or not in ATG5 to a high-fat diet for 5 wk as reported previously (9) (SI Appendix, Fig. S7A). We observed that mice deficient in endothelial autophagy had twice as many p53-positive nuclei in the linear part of the aorta as the controls (Fig. 7B). These results show that activation of endothelial autophagy by high SS prevents apoptosis.
Fig. 7.
Deficiency in endothelial autophagy increases apoptosis. (A) En face TUNEL staining of the aorta of 10-wk-old Atg5flox/flox vs. Atg5flox/flox;VE-cadherin-Cre mice (red, TUNEL; blue, DAPI; n = 10). Data are given as median (horizontal bar) and interquartile range (error bar). (B) En face p53 staining of the descendant linear aorta [high SS (HSS)] of 13–17-wk-old Atg5flox/flox vs. Atg5flox/flox;VE-cadherin-Cre mice fed a high-fat diet for 5 wk (red, p53; blue, DAPI; n = 8 per group). (Scale bar, 20 μm.) LSS, low SS; NS, not significant (*P < 0.05).
Deficiency in Endothelial Autophagy Leads to Endothelial Senescence.
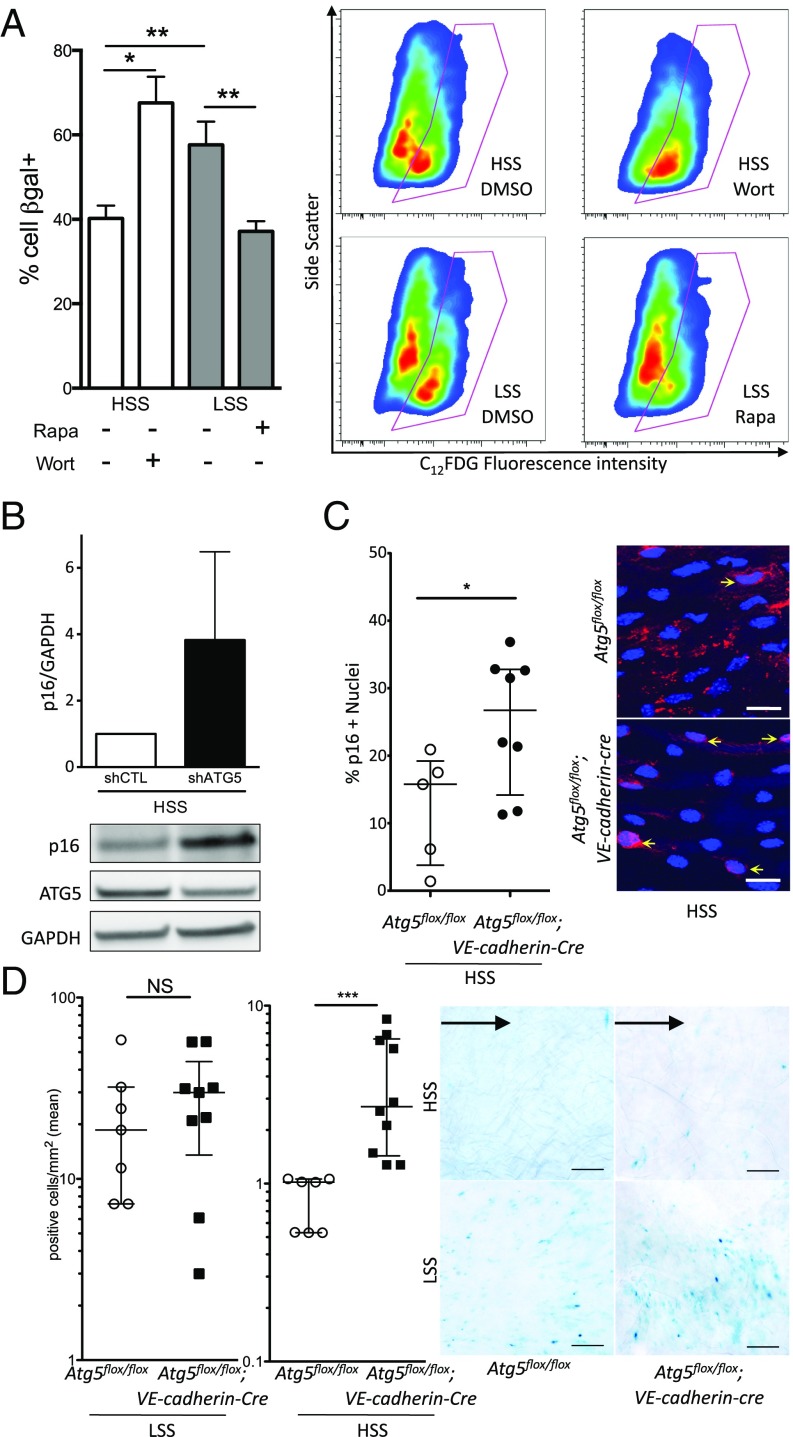
As p53 also regulates senescence, we thus evaluated the role of SS-induced autophagy on endothelial senescence in cultured cells and in mice. HUVECs exposed to low SS displayed higher senescenceassociated (SA)–β-gal activity than those exposed to high SS, confirming that low SS induces senescence in endothelial cells (9) (Fig. 8A). Pharmacological inhibition of autophagy using wortmannin under high SS increased endothelial senescence to levels similar to those of HUVECs exposed to low-SS conditions (Fig. 8A). Similarly, inhibition of autophagy in HUVECs under high SS using a lentivirus expressing an ATG5 shRNA increased p16 protein expression by fourfold (Fig. 8B). Conversely, pharmacological activation of autophagy using rapamycin under low SS reduced senescence to a level similar to that of HUVECs exposed to high SS (Fig. 8A).
Fig. 8.
Deficiency in endothelial autophagy increases senescence. (A) SA–β-gal activity evaluated by flow cytometry in HUVECs exposed for 24 h to high SS (HSS) with or without wortmannin (5 μmol/L) or to low SS (LSS) with or without rapamycin (0.5 μmol/L; n ≥ 6 per condition). (B) Western blot analysis of p16 expression in HUVECs transduced with a lentivirus expressing an Atg5 or a control (CTL) shRNA and exposed to high SS for 24 h (shRNA induction by 1 mmol/L IPTG, n = 5). (C) En face p16 staining of the descendant linear aorta (high SS) of 48-wk-old Atg5flox/flox vs. Atg5flox/flox;VE-cadherin-Cre mice fed a chow diet (red, p16; blue, DAPI; n = 5 and n = 8, respectively). (Scale bar, 20 μm.) (D) En face SA–β-gal staining of the aorta of 48-wk-old Atg5flox/flox vs. Atg5flox/flox;VE-cadherin-Cre mice fed a high-fat diet (n = 6 and n = 9, respectively). (Scale bar, 100 μm.) Black arrow represents flow direction. The inner part of the curvature is exposed to low SS, and the descendant linear part is exposed to high SS. IPTG, isopropyl β-d-1-thiogalactopyranoside; NS, not significant (*P < 0.05, **P < 0.01, and ***P < 0.001).
To assess senescence in vivo, we performed p16 en face staining on the thoracic descending part of the aorta of Atg5flox/flox;VE-cadherin-cre vs. Atg5flox/flox mice, and observed that mice deficient in endothelial autophagy had twice as many p16-positive nuclei as the controls, attesting to a more senescent phenotype (Fig. 8C). To confirm these findings, we exposed 48-wk-old mice deficient in ATG5 or ATG7 and their littermate controls to a high-fat diet for 16 wk, a regimen used to better evidence endothelial senescence in vivo (34) (SI Appendix, Fig. S7B). There was no difference in serum glucose and cholesterol levels or in body and organ weight between mice deficient or not in endothelial autophagy for both models except for a slightly lower liver weight in Atg5flox/flox;VE-cadherin-cre mice and a slightly higher heart weight in Atg7flox/flox;VE-cadherin-cre than in littermate controls (SI Appendix, Tables S7 and S8). We evaluated senescence by en face SA–β-gal staining in both mouse models. As expected, in control animals, endothelial senescence was greater in the inner part of the curvature of the aortic cross, corresponding to a low-SS area, than in areas exposed to high SS (9) (Fig. 8D and SI Appendix, Fig. S7C). Interestingly, mice deficient in endothelial ATG5 as well as those deficient in endothelial ATG7 had 2.5 fold more senescent endothelial cells in high-SS areas of the aorta than littermate controls, whereas senescence in low-SS areas was unchanged (Fig. 8D and SI Appendix, Fig. S7C). Altogether, these data demonstrate that activation of endothelial autophagy by high SS protects against senescence and suggest that defective autophagy in low-SS areas is responsible for premature senescence in these regions.
Discussion
This study demonstrates that a defect in endothelial autophagy occurs in low-SS areas, impairing endothelial cell alignment in response to flow and causing endothelial inflammation, apoptosis, and senescence, thus favoring the development of atherosclerotic lesions.
The first major finding in this study was that low SS induces a defect in endothelial autophagy as a result of mTOR activation and AMPKα pathway inhibition. Conversely, high SS strongly activates autophagy. Previous analyses of the effect of various SS conditions on endothelial autophagy gave conflicting results in cultured cells (14, 16–18, 21). Fewer studies are available on blood vessels, but their results either lack sensitivity, as they were obtained with lysates from the entire arterial wall, where endothelial cells are quantitatively negligible (16, 18, 21), or used p62 immunohistochemistry, a molecule known to be regulated by SS (14, 16). Our results fill this gap in knowledge, as we observed, in human arteries, in aortas from mouse, and in cultured endothelial cells, a lower autophagy level in endothelial cells exposed to low compared with high SS. The difference in autophagic flux between the two conditions is even larger than that reflected by the LC3II/ LC3I ratio and the LC3 punctate signal we present. Indeed, under low SS, autophagic flux is blocked, leading to LC3II accumulation. Although sex differences in autophagy in various tissues have been reported in certain settings, we observed the same regulation of endothelial autophagy by SS in male and in female mice (35).
A second major finding in the present study was that a defect in endothelial autophagy enhances atherosclerotic plaque development specifically in high-SS areas where alignment of endothelial cells in the flow direction was impaired, and inflammation, apoptosis, and senescence were increased. We also tested major endothelial mechanosensors and found that neither PECAM-1, which is part of the PECAM-1/VE-cadherin/VEGFR2 complex, nor the primary cilium were implicated in signal transmission for autophagy regulation (3). The previously described endothelial dysfunction and lipid retention associated with endothelial autophagy deficiency may also contribute to atherosclerosis (13, 36). The effects we observed in the present study were not mediated by an impact on cardiovascular risk factors, as body weight, arterial blood pressure, and plasma cholesterol levels were not influenced by the deficiency in endothelial autophagy in basal conditions or under Western diet. Fasting serum glucose levels were only slightly higher in Apoe−/−;Atg5flox/flox;VE-cadherin-cre mice compared with littermate controls. However, such mild changes likely do not explain the effect we observed on atherosclerosis. Our observation that the increase in the proatherogenic phenotype and in plaque size in mice deficient in endothelial autophagy was restricted to high-SS areas implies that, under high atheroprotective SS, the autophagy level is high and prevents atherosclerosis development. Conversely, under low atherogenic SS, endothelial autophagy is defective, resulting in cell death, senescence, and inflammation, which favor atherosclerosis development. The mechanisms linking SS-regulated endothelial autophagy with these various cell processes deserve further study. We can yet speculate that defective endothelial autophagy in low-SS areas induces the accumulation of damaged mitochondria, which causes increased formation of mitochondrial reactive oxygen species (37) and eventually apoptosis, senescence, and inflammation. Indeed, low or disturbed SS is known to decrease mitochondrial respiration rate and to increase mitochondrial membrane potential and superoxide anion production in endothelial cells, which can lead to endothelial apoptosis, senescence, and inflammation (11, 38, 39). Our results provide insights in the understanding of the mechanisms regulating plaque development preferentially in low- vs. high-SS areas. Our findings showing atheroprotective effects of endothelial autophagy are in line with previous studies showing that defective autophagy in vascular smooth muscle cells and macrophages promotes atherosclerosis formation and/or development (40–43). Altogether, these data indicate that inhibition of autophagy would be unfavorable as a therapeutic approach in the treatment of atherosclerosis, whereas stimulation of autophagy may be an attractive strategy.
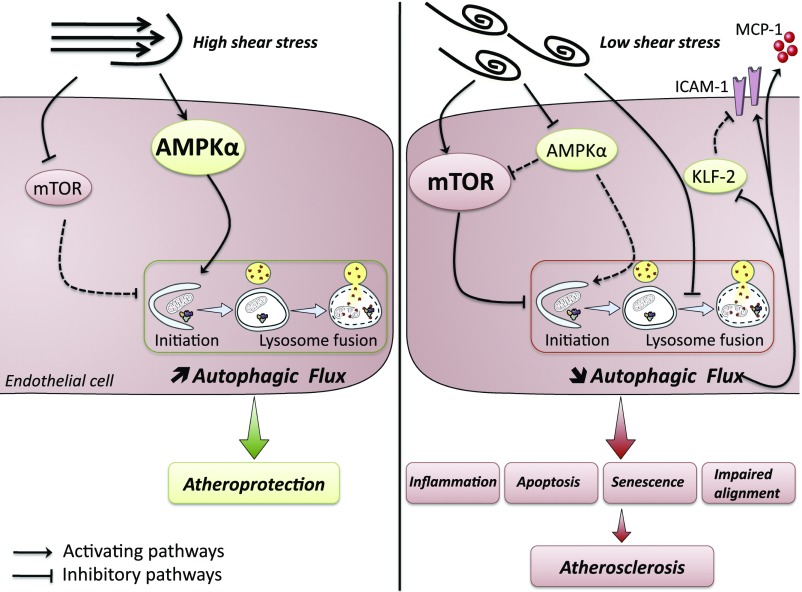
In conclusion, low-SS atheroprone areas are characterized by low and inefficient endothelial autophagy, which triggers a defect in cell alignment as well as endothelial inflammation, apoptosis, and senescence, thereby setting the stage for the initial development of atherosclerotic lesions (Fig. 9). The defect in endothelial autophagy observed in low-SS areas may thus be the missing link between low SS and atherosclerosis development in these specific regions.
Fig. 9.
Schematic illustration depicting the links between SS, autophagy, and atherosclerotic plaque formation. Under high laminar SS, endothelial autophagy is strongly induced and plays an antiapoptotic, antisenescent, antiinflammatory, and antiatherogenic role. Under low SS, a defect in endothelial autophagy occurs as a result of an inhibition of the AMPKα and activation of the mTOR pathways together with a blockade of the fusion between autophagosomes with lysosomes. This defect in endothelial autophagy leads to endothelial apoptosis, senescence, and inflammation, eventually increasing atherosclerosis development. ICAM-1, intercellular adhesion molecule 1; KLF-2, Krüppel-like factor 2; MCP-1, monocyte chemoattractant protein 1. Solid lines indicate up-regulated pathways. Dashed lines indicate down-regulated pathways.
Materials and Methods
The SI Appendix includes further details of the study's materials and methods.
Endothelial Immunofluorescence in Human Carotid Arteries.
Human atherosclerotic plaques obtained from five patients were remnants of the surgical specimens routinely processed for pathologic examination following en bloc carotid endarterectomy surgery, which was performed after patient consent (SI Appendix, Table S1). Institutional review board approval was not required for the human specimens at the time the work was done. The upstream part was identified from the downstream area of the lesion by using a silk thread. Endothelial cells from the upstream (i.e., high-SS) or downstream (i.e., low-SS) part of the plaque were collected separately (7, 44). Cells were fixed in 4% paraformaldehyde, permeabilized, incubated with an anti-LC3 antibody (SI Appendix, Table S2), and costaining with anti-CD31 antibody and DAPI.
HUVEC Culture.
Confluent HUVECs (passage 2–4; 10 different primary cultures; Promocell) were cultured on 0.2% gelatin-coated slides in endothelial cell basal medium containing growth factors, 1% FCS (Promocell), streptomycin (100 IU/mL), penicillin (100 IU/mL), and amphotericin B (10 μg/L).
Plasmid Electroporation.
DNA vector encoding the tandem mRFP-GFP-LC3 was used to transiently express the RFP-GFP–tagged LC3 protein to monitor the LC3 translocation and autophagosome fusion with lysosomes. In the absence of autophagy induction, the LC3 fluorescent signals are evenly distributed; upon autophagy induction, punctate fluorescent signals (i.e., yellow LC3 dots) appear as a result of LC3 accumulation on the membrane of autophagosomes; when fusion with lysosomes occurs, the punctate signal becomes red by acidic degradation of the GFP. Transfection efficacy was assessed by expression of fluorescent LC3 protein.
Lentiviral Transduction.
Lentiviruses expressing inducible shRNA (Sigma-Aldrich) were used to silence Kinesin-like protein (i.e., KIF3A), ATG5, and CD31. HUVECs were infected in the presence of hexadimethrine bromide with lentiviruses. Negative controls were lentiviruses expressing a nontarget shRNA used at the same multiplicity of infection as for the protein of interest. Transduced cells were amplified and selected by using puromycin, and ShRNA expression was induced by using isopropyl β-d-1-thiogalactopyranoside.
SS Experiment in Vitro.
A unidirectional steady laminar SS was applied to confluent HUVECs by using a parallel plate chamber system as described elsewhere (45). Endothelial cell medium previously filtered on a 0.1-μm membrane was perfused at different rates and for different times (1 min to 48 h). Local SS was calculated per Poiseuille’s law and was 20, 2, or 0 dyn/cm2, corresponding to high-SS, low-SS, or static conditions, respectively.
Immunofluorescent Staining and Immunofluorescence Microscopy in Vitro.
To assess autophagy flux, permeabilized cells were incubated with an anti-LC3 antibody and an anti-LAMP2 antibody (SI Appendix, Table S2) and then with secondary antibody. For assessment of the morphology and orientation of endothelial cells under SS, HUVECs were stained with an anti-CD144 antibody. Samples were costained with DAPI to identify cell nuclei.
Transmission EM.
For transmission EM experiments, the term “autophagic vesicle” refers to autophagosome or autolysosome, as it is often not possible to determine from transmission EM images whether an autophagosome has fused with a lysosome (46).
In Vitro LC3 Assessment Using Flow Cytometry.
After exposure to SS, HUVECs were permeabilized by using 0.2% saponin, which specifically extracts the non–autophagosome-associated form of LC3 (47). Then, HUVECs were fixed in ethanol and incubated with an anti-LC3 antibody (47) (SI Appendix, Table S2). Costaining with propidium iodide for 5 min before flow-cytometry analysis was performed to identify live cells and exclude cell aggregates.
Senescence-Associated β-Gal Activity in Vitro.
SA–β-gal activity was assessed by flow cytometry by using a fluorogenic substrate (C12FDG; Invitrogen). After exposure to SS, HUVECs were pretreated with chloroquine diluted in medium without Phenol Red to increase the internal pH of lysosomes to 6. C12FDG was then added to the medium. HUVECs were then washed and analyzed immediately. Cells not treated with C12FDG were used as a negative control.
Animal Models.
All mice were on a C57BL/6 background with the exception of Ampkα1−/− mice, which were on a mixed C57Bl6/129 Sv background as a result of embryonic lethality on C57Bl6 background.
Mice constitutively deficient in endothelial autophagy were obtained by crossing VE-cadherin-Cre transgenic mice provided by Oberlin et al. (48) with Atg5flox/flox mice provided by N. Mizushima as described by Hara et al. (49) or Atg7flox/flox mice provided by Komatsu et al. (50). Baseline morphological and metabolic features were observed, and endothelial apoptosis was assessed, in 8–17-wk-old mice fed a chow diet. For p53 experiments, 13–17-wk-old mice were fed a high fat diet for 5 wk (9). For assessment of endothelial senescence, 42–54 wk-old mice were fed the same high-fat diet for 16 wk (34). For investigation of autophagic flux in vivo, 8–9-wk-old C57BL/6 mice were injected i.p. with chloroquine (51), rapamycin (4 mg/kg/d for two consecutive days), or vehicle. To investigate the effect of endothelial autophagy on atherosclerosis development, mice constitutively deficient in endothelial autophagy (Atg5flox/flox;VE-cadherin-Cre) were crossed with ApoE−/− mice purchased from Charles River Laboratory. Thirteen-week-old mice were fed a Western diet for 10 wk. AMPKα1−/− mice were described previously (52). CD31−/− mice were provided by Duncan et al. (53). All experiments were performed in accordance with the European Community guidelines for the care and use of laboratory animals (no. 07430) and were approved by the institutional ethical committee (no. 02526.02).
Senescence-Associated β-Gal Assay on Mouse Aortas.
SA–β-gal staining was performed by incubating the aortas for 48 h at 37 °C in a CO2-free incubator with a fresh staining solution containing 1 mg/mL X-gal. After staining, aortas were mounted en face on glass slides and imaged by using a bright-field AxioImager Z1 microscope (Zeiss).
Red-Oil Staining.
Aortas were stained with a freshly prepared Oil Red O working solution, differentiated by using 70% ethanol, mounted en face, and then observed by using a bright-field microscope.
Murine Aortic Endothelial Cell Isolation.
After exposure to type II collagenase, mouse aortic endothelial cells (MAECs) were collected from the aortas and seeded in a 0.1% gelatin-coated plate in DMEM supplemented with 20% FCS. MAECs were used for Western blot analysis after one passage.
En Face Immunofluorescence Microscopy on Mouse Aortas.
Mouse aortas were fixed with paraformaldehyde and permeabilized by using Triton X-100. Tissues were then exposed to an anti-LC3, an anti-p53, or an anti-p16 antibody (SI Appendix, Table S2) and then to the respective secondary antibody. To assess apoptosis level, aortas were stained with the in situ cell death detection kit from Roche (red). In all experiments, endothelial cells were recognized by their morphology. Still, in most series of experiments, costaining with anti-CD31 antibody or anti-CD144 antibody was performed. In all mice, 8–10 images were obtained from regions in the aortic arch exposed to low SS and the thoracic aorta exposed to high SS.
Immunoblotting.
HUVEC or MAEC lysates were mixed with reducing sample buffer for electrophoresis and subsequently transferred onto nitrocellulose for all blots except for p16, KLF-2, p-ACC, and ACC (PVDF membranes). Equal loading was checked by using Ponceau red solution. Membranes were incubated with primary antibodies (SI Appendix, Table S2). After secondary antibody incubation, immunodetection was performed by using an enhanced chemiluminescence kit [Immun-Star Western C kit (Bio-Rad) or WesternBright Sirius (Advansta) for p16 blot], and bands were revealed by using the Las-4000 imaging system. After initial immunodetection, membranes were stripped of antibodies and reprobed with anti-GAPDH, anti-actin, or anti anti-tubulin antibodies (SI Appendix, Table S2).
Statistical Analysis.
Data are expressed as mean ± SEM for in vitro experiments and as median (interquartile range) for in vivo experiments. Comparisons between different SS conditions or between control and treatment conditions were performed by using a Wilcoxon test. Comparisons between groups of mice were performed by using the Mann–Whitney U test. Comparison between sexes was performed by using a χ2 test. Statistical analyses and figures were performed by using the SPSS statistical package software for Windows (version 20.0; SPSS) and GraphPad Prism 5 software, respectively. All tests were two-sided and used a significance level of 0.05.
Data Sharing.
The data that support the findings of this study are available from the corresponding author on request.
Supplementary Material
Acknowledgments
The authors acknowledge Lamia Ouchia and Marion Tanguy for their helpful contributions, Alain Grodet and Cyrielle Sophie for technical assistance in EM, the members of the INSERM U970 ERI facility, N. Mizushima for providing Atg5flox/flox mice, M. Komatsu for providing Atg7flox/flox mice, and T. W. Mak and G. Caliguiri for providing CD31−/− mice. This work was supported by the Institut National de la Santé et de la Recherche Médicale, Paris Descartes University; Fondation pour la Recherche Médicale Grant DPC20111122979; Agence Nationale pour la Recherche Grants ANR-14-CE12-0011, ANR-14-CE35-0022, and ANR-16-CE14-0015-01; Association Francaise pour l’Etude du foie Grant AFEF 2014; poste d’accueil INSERM (J.P.); Cardiovasculaire, Obésité, Diabète Domaine d'Interêt Majeur Ile de France (A.-C.V.); Ministère de la Recherche et de l’Enseignement Supérieur (M.K. and A.H.); and Fondation pour la Recherche Médicale Grant FDT20160435690 (to M.K.).
Footnotes
The authors declare no conflict of interest.
This article is a PNAS Direct Submission.
This article contains supporting information online at www.pnas.org/lookup/suppl/doi:10.1073/pnas.1702223114/-/DCSupplemental.
References
- 1.Chiu JJ, Chien S. Effects of disturbed flow on vascular endothelium: Pathophysiological basis and clinical perspectives. Physiol Rev. 2011;91:327–387. doi: 10.1152/physrev.00047.2009. [DOI] [PMC free article] [PubMed] [Google Scholar]
- 2.Gimbrone MA, Jr, García-Cardeña G. Vascular endothelium, hemodynamics, and the pathobiology of atherosclerosis. Cardiovasc Pathol. 2013;22:9–15. doi: 10.1016/j.carpath.2012.06.006. [DOI] [PMC free article] [PubMed] [Google Scholar]
- 3.Hahn C, Schwartz MA. Mechanotransduction in vascular physiology and atherogenesis. Nat Rev Mol Cell Biol. 2009;10:53–62. doi: 10.1038/nrm2596. [DOI] [PMC free article] [PubMed] [Google Scholar]
- 4.Lusis AJ. Atherosclerosis. Nature. 2000;407:233–241. doi: 10.1038/35025203. [DOI] [PMC free article] [PubMed] [Google Scholar]
- 5.Bombeli T, Schwartz BR, Harlan JM. Endothelial cells undergoing apoptosis become proadhesive for nonactivated platelets. Blood. 1999;93:3831–3838. [PubMed] [Google Scholar]
- 6.Dimmeler S, Haendeler J, Rippmann V, Nehls M, Zeiher AM. Shear stress inhibits apoptosis of human endothelial cells. FEBS Lett. 1996;399:71–74. doi: 10.1016/s0014-5793(96)01289-6. [DOI] [PubMed] [Google Scholar]
- 7.Tricot O, et al. Relation between endothelial cell apoptosis and blood flow direction in human atherosclerotic plaques. Circulation. 2000;101:2450–2453. doi: 10.1161/01.cir.101.21.2450. [DOI] [PubMed] [Google Scholar]
- 8.Minamino T, et al. Endothelial cell senescence in human atherosclerosis: Role of telomere in endothelial dysfunction. Circulation. 2002;105:1541–1544. doi: 10.1161/01.cir.0000013836.85741.17. [DOI] [PubMed] [Google Scholar]
- 9.Warboys CM, et al. Disturbed flow promotes endothelial senescence via a p53-dependent pathway. Arterioscler Thromb Vasc Biol. 2014;34:985–995. doi: 10.1161/ATVBAHA.114.303415. [DOI] [PubMed] [Google Scholar]
- 10.Bai B, et al. Cyclin-dependent kinase 5-mediated hyperphosphorylation of sirtuin-1 contributes to the development of endothelial senescence and atherosclerosis. Circulation. 2012;126:729–740. doi: 10.1161/CIRCULATIONAHA.112.118778. [DOI] [PubMed] [Google Scholar]
- 11.Davies PF, Civelek M, Fang Y, Fleming I. The atherosusceptible endothelium: Endothelial phenotypes in complex haemodynamic shear stress regions in vivo. Cardiovasc Res. 2013;99:315–327. doi: 10.1093/cvr/cvt101. [DOI] [PMC free article] [PubMed] [Google Scholar]
- 12.Choi AM, Ryter SW, Levine B. Autophagy in human health and disease. N Engl J Med. 2013;368:1845–1846. doi: 10.1056/NEJMc1303158. [DOI] [PubMed] [Google Scholar]
- 13.Torisu K, et al. Intact endothelial autophagy is required to maintain vascular lipid homeostasis. Aging Cell. 2016;15:187–191. doi: 10.1111/acel.12423. [DOI] [PMC free article] [PubMed] [Google Scholar]
- 14.Liu J, et al. Shear stress regulates endothelial cell autophagy via redox regulation and Sirt1 expression. Cell Death Dis. 2015;6:e1827. doi: 10.1038/cddis.2015.193. [DOI] [PMC free article] [PubMed] [Google Scholar]
- 15.Lien SC, et al. Mechanical regulation of cancer cell apoptosis and autophagy: Roles of bone morphogenetic protein receptor, Smad1/5, and p38 MAPK. Biochim Biophys Acta. 2013;1833:3124–3133. doi: 10.1016/j.bbamcr.2013.08.023. [DOI] [PubMed] [Google Scholar]
- 16.Li R, et al. Disturbed flow induces autophagy, but impairs autophagic flux to perturb mitochondrial homeostasis. Antioxid Redox Signal. 2015;23:1207–1219. doi: 10.1089/ars.2014.5896. [DOI] [PMC free article] [PubMed] [Google Scholar]
- 17.Guo F, et al. Autophagy regulates vascular endothelial cell eNOS and ET-1 expression induced by laminar shear stress in an ex vivo perfused system. Ann Biomed Eng. 2014;42:1978–1988. doi: 10.1007/s10439-014-1033-5. [DOI] [PubMed] [Google Scholar]
- 18.Ding Z, et al. Hemodynamic shear stress modulates endothelial cell autophagy: Role of LOX-1. Int J Cardiol. 2015;184:86–95. doi: 10.1016/j.ijcard.2015.01.065. [DOI] [PubMed] [Google Scholar]
- 19.Bharath LP, et al. Impairment of autophagy in endothelial cells prevents shear-stress-induced increases in nitric oxide bioavailability. Can J Physiol Pharmacol. 2014;92:605–612. doi: 10.1139/cjpp-2014-0017. [DOI] [PMC free article] [PubMed] [Google Scholar]
- 20.Yao P, Zhao H, Mo W, He P. Laminar shear stress promotes vascular endothelial cell autophagy through upregulation with Rab4. DNA Cell Biol. 2016;35:118–123. doi: 10.1089/dna.2015.3041. [DOI] [PubMed] [Google Scholar]
- 21.Hashem SI, et al. Brief report: Oxidative stress mediates cardiomyocyte apoptosis in a human model of Danon disease and heart failure. Stem Cells. 2015;33:2343–2350. doi: 10.1002/stem.2015. [DOI] [PMC free article] [PubMed] [Google Scholar]
- 22.Klionsky DJ, et al. Guidelines for the use and interpretation of assays for monitoring autophagy (3rd edition) Autophagy. 2016;12:1–222, and erratum (2016) 12:443. doi: 10.1080/15548627.2015.1100356. [DOI] [PMC free article] [PubMed] [Google Scholar]
- 23.Ku DN, Giddens DP, Zarins CK, Glagov S. Pulsatile flow and atherosclerosis in the human carotid bifurcation. Positive correlation between plaque location and low oscillating shear stress. Arteriosclerosis. 1985;5:293–302. doi: 10.1161/01.atv.5.3.293. [DOI] [PubMed] [Google Scholar]
- 24.Zarins CK, et al. Carotid bifurcation atherosclerosis. Quantitative correlation of plaque localization with flow velocity profiles and wall shear stress. Circ Res. 1983;53:502–514. doi: 10.1161/01.res.53.4.502. [DOI] [PubMed] [Google Scholar]
- 25.Gatica D, Chiong M, Lavandero S, Klionsky DJ. Molecular mechanisms of autophagy in the cardiovascular system. Circ Res. 2015;116:456–467. doi: 10.1161/CIRCRESAHA.114.303788. [DOI] [PMC free article] [PubMed] [Google Scholar]
- 26.Guo D, Chien S, Shyy JY. Regulation of endothelial cell cycle by laminar versus oscillatory flow: Distinct modes of interactions of AMP-activated protein kinase and Akt pathways. Circ Res. 2007;100:564–571. doi: 10.1161/01.RES.0000259561.23876.c5. [DOI] [PubMed] [Google Scholar]
- 27.Zhang Y, et al. AMP-activated protein kinase is involved in endothelial NO synthase activation in response to shear stress. Arterioscler Thromb Vasc Biol. 2006;26:1281–1287. doi: 10.1161/01.ATV.0000221230.08596.98. [DOI] [PubMed] [Google Scholar]
- 28.Kröller-Schön S, et al. α1AMP-activated protein kinase mediates vascular protective effects of exercise. Arterioscler Thromb Vasc Biol. 2012;32:1632–1641. doi: 10.1161/ATVBAHA.111.243980. [DOI] [PMC free article] [PubMed] [Google Scholar]
- 29.Chien S. Mechanotransduction and endothelial cell homeostasis: The wisdom of the cell. Am J Physiol Heart Circ Physiol. 2007;292:H1209–H1224. doi: 10.1152/ajpheart.01047.2006. [DOI] [PubMed] [Google Scholar]
- 30.Wang C, Baker BM, Chen CS, Schwartz MA. Endothelial cell sensing of flow direction. Arterioscler Thromb Vasc Biol. 2013;33:2130–2136. doi: 10.1161/ATVBAHA.113.301826. [DOI] [PMC free article] [PubMed] [Google Scholar]
- 31.Tzima E, et al. A mechanosensory complex that mediates the endothelial cell response to fluid shear stress. Nature. 2005;437:426–431. doi: 10.1038/nature03952. [DOI] [PubMed] [Google Scholar]
- 32.Egorova AD, van der Heiden K, Poelmann RE, Hierck BP. Primary cilia as biomechanical sensors in regulating endothelial function. Differentiation. 2012;83:S56–S61. doi: 10.1016/j.diff.2011.11.007. [DOI] [PubMed] [Google Scholar]
- 33.Orhon I, Dupont N, Pampliega O, Cuervo AM, Codogno P. Autophagy and regulation of cilia function and assembly. Cell Death Differ. 2015;22:389–397. doi: 10.1038/cdd.2014.171. [DOI] [PMC free article] [PubMed] [Google Scholar]
- 34.Wang CY, et al. Obesity increases vascular senescence and susceptibility to ischemic injury through chronic activation of Akt and mTOR. Sci Signal. 2009;2:ra11. doi: 10.1126/scisignal.2000143. [DOI] [PMC free article] [PubMed] [Google Scholar]
- 35.Gottlieb RA, Andres AM, Sin J, Taylor DP. Untangling autophagy measurements: All fluxed up. Circ Res. 2015;116:504–514. doi: 10.1161/CIRCRESAHA.116.303787. [DOI] [PMC free article] [PubMed] [Google Scholar]
- 36.LaRocca TJ, et al. Translational evidence that impaired autophagy contributes to arterial ageing. J Physiol. 2012;590:3305–3316. doi: 10.1113/jphysiol.2012.229690. [DOI] [PMC free article] [PubMed] [Google Scholar]
- 37.Mai S, Muster B, Bereiter-Hahn J, Jendrach M. Autophagy proteins LC3B, ATG5 and ATG12 participate in quality control after mitochondrial damage and influence lifespan. Autophagy. 2012;8:47–62. doi: 10.4161/auto.8.1.18174. [DOI] [PMC free article] [PubMed] [Google Scholar]
- 38.Bretón-Romero R, et al. Laminar shear stress regulates mitochondrial dynamics, bioenergetics responses and PRX3 activation in endothelial cells. Biochim Biophys Acta. 2014;1843:2403–2413. doi: 10.1016/j.bbamcr.2014.07.003. [DOI] [PubMed] [Google Scholar]
- 39.Paneni F, Diaz Cañestro C, Libby P, Lüscher TF, Camici GG. The aging cardiovascular system: Understanding it at the cellular and clinical levels. J Am Coll Cardiol. 2017;69:1952–1967. doi: 10.1016/j.jacc.2017.01.064. [DOI] [PubMed] [Google Scholar]
- 40.Grootaert MO, et al. Defective autophagy in vascular smooth muscle cells accelerates senescence and promotes neointima formation and atherogenesis. Autophagy. 2015;11:2014–2032. doi: 10.1080/15548627.2015.1096485. [DOI] [PMC free article] [PubMed] [Google Scholar]
- 41.De Meyer GR, et al. Autophagy in vascular disease. Circ Res. 2015;116:468–479. doi: 10.1161/CIRCRESAHA.116.303804. [DOI] [PubMed] [Google Scholar]
- 42.Razani B, et al. Autophagy links inflammasomes to atherosclerotic progression. Cell Metab. 2012;15:534–544. doi: 10.1016/j.cmet.2012.02.011. [DOI] [PMC free article] [PubMed] [Google Scholar]
- 43.Liao X, et al. Macrophage autophagy plays a protective role in advanced atherosclerosis. Cell Metab. 2012;15:545–553. doi: 10.1016/j.cmet.2012.01.022. [DOI] [PMC free article] [PubMed] [Google Scholar]
- 44.Choi G, et al. Coronary artery axial plaque stress and its relationship with lesion geometry: Application of computational fluid dynamics to coronary CT angiography. JACC Cardiovasc Imaging. 2015;8:1156–1166. doi: 10.1016/j.jcmg.2015.04.024. [DOI] [PubMed] [Google Scholar]
- 45.Ramkhelawon B, et al. Shear stress regulates angiotensin type 1 receptor expression in endothelial cells. Circ Res. 2009;105:869–875. doi: 10.1161/CIRCRESAHA.109.204040. [DOI] [PubMed] [Google Scholar]
- 46.Eskelinen EL. Maturation of autophagic vacuoles in mammalian cells. Autophagy. 2005;1:1–10. doi: 10.4161/auto.1.1.1270. [DOI] [PubMed] [Google Scholar]
- 47.Eng KE, Panas MD, Karlsson Hedestam GB, McInerney GM. A novel quantitative flow cytometry-based assay for autophagy. Autophagy. 2010;6:634–641. doi: 10.4161/auto.6.5.12112. [DOI] [PubMed] [Google Scholar]
- 48.Oberlin E, et al. VE-cadherin expression allows identification of a new class of hematopoietic stem cells within human embryonic liver. Blood. 2010;116:4444–4455. doi: 10.1182/blood-2010-03-272625. [DOI] [PubMed] [Google Scholar]
- 49.Hara T, et al. Suppression of basal autophagy in neural cells causes neurodegenerative disease in mice. Nature. 2006;441:885–889. doi: 10.1038/nature04724. [DOI] [PubMed] [Google Scholar]
- 50.Komatsu M, et al. Impairment of starvation-induced and constitutive autophagy in Atg7-deficient mice. J Cell Biol. 2005;169:425–434. doi: 10.1083/jcb.200412022. [DOI] [PMC free article] [PubMed] [Google Scholar]
- 51.Orhon I, et al. Primary-cilium-dependent autophagy controls epithelial cell volume in response to fluid flow. Nat Cell Biol. 2016;18:657–667. doi: 10.1038/ncb3360. [DOI] [PubMed] [Google Scholar]
- 52.Jørgensen SB, et al. Knockout of the alpha2 but not alpha1 5′-AMP-activated protein kinase isoform abolishes 5-aminoimidazole-4-carboxamide-1-beta-4-ribofuranosidebut not contraction-induced glucose uptake in skeletal muscle. J Biol Chem. 2004;279:1070–1079. doi: 10.1074/jbc.M306205200. [DOI] [PubMed] [Google Scholar]
- 53.Duncan GS, et al. Genetic evidence for functional redundancy of platelet/endothelial cell adhesion molecule-1 (PECAM-1): CD31-deficient mice reveal PECAM-1-dependent and PECAM-1-independent functions. J Immunol. 1999;162:3022–3030. [PubMed] [Google Scholar]
Associated Data
This section collects any data citations, data availability statements, or supplementary materials included in this article.


