Significance
How a homogeneous group of cells is partitioned into domains of different identities is a common problem in embryogenesis. Partitioning, in some cases, takes places within a static tissue field and, in other cases, in a progressively growing tissue. A curious case is the partitioning of insect bodies into a head, thorax, and abdomen, which may take place in an elongating or in a nonelongating embryo (short- vs. long-germ insects). Through evolution, the first type of segmentation can easily evolve into the second. In our studies of Tribolium segmentation, we elucidated a patterning mechanism based on speed regulation of genetic cascades. The mechanism functions in both elongating and nonelongating tissues, and could potentially have parallels in other tissues and organisms.
Keywords: clock-and-wavefront, evolution, kinematic waves, cascade, enhancer switching
Abstract
During the anterior−posterior fate specification of insects, anterior fates arise in a nonelongating tissue (called the “blastoderm”), and posterior fates arise in an elongating tissue (called the “germband”). However, insects differ widely in the extent to which anterior−posterior fates are specified in the blastoderm versus the germband. Here we present a model in which patterning in both the blastoderm and germband of the beetle Tribolium castaneum is based on the same flexible mechanism: a gradient that modulates the speed of a genetic cascade of gap genes, resulting in the induction of sequential kinematic waves of gap gene expression. The mechanism is flexible and capable of patterning both elongating and nonelongating tissues, and hence converting blastodermal to germband fates and vice versa. Using RNAi perturbations, we found that blastodermal fates could be shifted to the germband, and germband fates could be generated in a blastoderm-like morphology. We also suggest a molecular mechanism underlying our model, in which gradient levels regulate the switch between two enhancers: One enhancer is responsible for sequential gene activation, and the other is responsible for freezing temporal rhythms into spatial patterns. This model is consistent with findings in Drosophila melanogaster, where gap genes were found to be regulated by two nonredundant “shadow” enhancers.
Rhythmic and sequential gene activity has been implicated in the spatial patterning of many embryonic structures. For example, a molecular clock mediates stripes of gene expression that delimit vertebrate somites (1–3), segments in short-germ arthropods (4–10), and lateral roots in plants (11, 12). Aperiodic sequential activation of genes regulates the spatial patterning of Drosophila neuroblasts (13, 14) and the vertebrate neural tube (15). However, different strategies are used in each case to translate a temporal process into a spatial one. Two main mechanisms have been described: (i) one based on the continuous retraction of a steep gradient or boundary (usually called a “wavefront”) and (ii) the other based on a static or nonretracting gradient. The “clock-and-wavefront” model exemplifies the first type, and was originally proposed in the context of vertebrate somitogenesis (16). In this model, an arrest front sweeps the tissue and freezes oscillations of a molecular clock into stripes. The “spatial and temporal gradient” model exemplifies the latter, which was proposed in the context of vertebrate neural tube development (15, 17–19). In this model, the concentration of and exposure time to a more or less static (nonretracting) gradient regulates the sequential activation of genes.
Models that use a wavefront (henceforth called “wavefront-based” models) are best suited for patterning elongating tissues, since axial elongation offers a natural mechanism for continuous and sustained gradient retraction. On the other hand, models that use a static gradient (henceforth called “gradient-based” models) are best suited for patterning nonelongating tissues, since such tissues are stable enough to support the formation of gradients of the desired shape and level.
Often in evolution, the morphology of a certain embryonic structure changes, but still exhibits the same gene expression pattern. A notable example is the evolution of anterior−posterior (AP) patterning during early embryogenesis of insects. The AP fates of most insects are specified in two different phases (20): (i) the blastoderm, where the AP axis does not undergo any axial elongation, and (ii) the germband, where the AP axis undergoes gradual axis elongation. Insects differ in the number of fates specified in the blastoderm vs. germband. In short-germ insects [e.g., the grasshopper Schistocerca americana (21)], most fates form in the germband, while, in long-germ insects [e.g., the fruit fly Drosophila melanogaster (22) and the beetle Callosobruchus maculatus (23)], most fates form in the blastoderm. Intermediate-germ insects lie somewhere between those two extreme cases. For example, in the intermediate-germ insects Tribolium castaneum and Oncopeltus fasciatus, the gnathal and thoracic fates are specified in the blastoderm, while abdominal fates are specified in the germband (23, 24). In the intermediate-germ beetle, Dermestes maculatus, gnathal, thoracic, and some of the abdominal fates form in the blastoderm and the rest form in the germband (25), making it closer to the long-germ end of the short-germ/long-germ spectrum of insect embryogenesis. Throughout evolution, the specification of AP fates seems to shift easily from the germband to the blastoderm, resulting in a trend of short-germ to long-germ evolution [with some reports of the opposite evolutionary path (26)]. Given such dramatic flexibility of AP patterning in insects, we hypothesize that both blastoderm and germband are patterned using similar or related mechanisms.
In this paper, we propose the “speed regulation” model, in which the concentration of a molecular factor modulates the speed of sequential activation of genes. The model is flexible and can operate in a gradient-based or a wavefront-based fashion. We give theoretical and experimental evidence that the flexibility of the speed regulation model is behind the apparent ease with which many short-germ insects independently evolved into long-germ insects throughout evolution. Specifically, we show that, in the beetle, Tribolium castaneum, gap genes are activated sequentially in both the blastoderm and the germband. We also provide evidence that a gradient of the homeodomain transcription factor caudal (cad) (or a factor whose expression correlates with it) regulates the speed of gap genes sequential activation, patterning the blastoderm by the gradient-based mode and patterning the germband by the wavefront-based mode of the speed regulation model. Manipulating the levels and retraction dynamics of cad leads to the shifting of AP fates back and forth between the blastoderm and germband, mimicking short- to long-germ evolution and vice versa.
Based on insight from recent discoveries in cis-regulatory analysis, where most genes were found to be regulated by multiple “shadow” enhancers (27), we propose a computational model that realizes, in molecular terms, the concept of speed regulation. In this model, a gradient/wavefront regulates the switch between two enhancers: The first enhancer is responsible for sequential gene activation, and the second is responsible for freezing the temporal rhythms into spatial patterns. This model provides a molecular mechanism for short-germ to long-germ evolution in insects and functions equally well for gradient-based or wavefront-based patterning.
To place our experiments in context, we present the concept of “speed regulation” first. Based on this concept, we suggest a simple mechanism for short-germ to long-germ evolution. To test this idea, we studied gap gene dynamics in the beetle Tribolium castaneum in wild type (WT) and several RNAi knockdown backgrounds. We then present a computational model for a molecular realization of wavefront/gradient-mediated speed regulation. We show that a Tribolium-specific version of this model recapitulates the spatiotemporal patterns of gap genes in WT, gap gene RNAi knockdowns, and cad gradient manipulations. Finally, we present testable predictions for the suggested molecular model.
Results
Speed Regulation Is a Flexible Mechanism That Can Pattern both Elongating and Nonelongating Tissues.
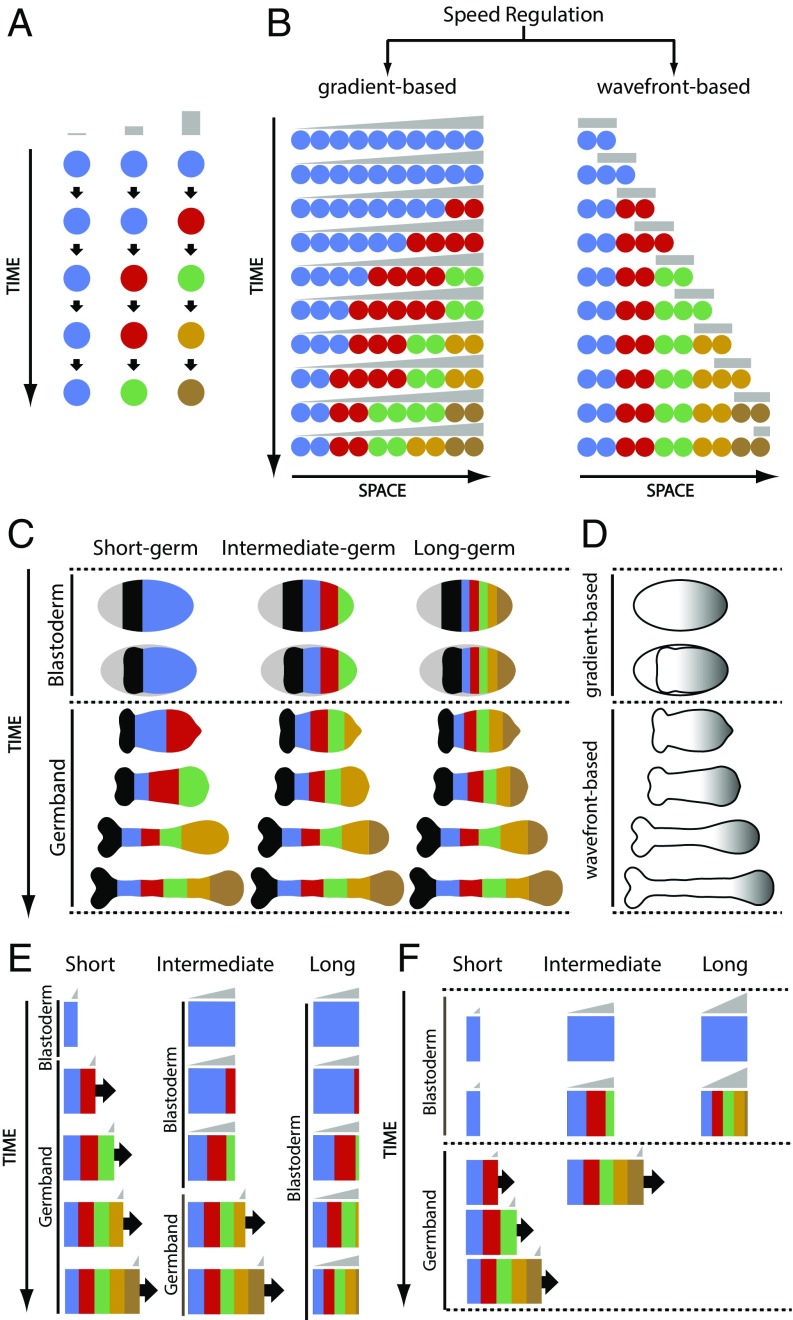
Consider a group of cells, each of which has the capacity to transit through successive states. In Fig. 1A, each state is shown in a different color and represents the expression of one gene or the coexpression of several genes. The speed of state transitions is regulated by a molecular factor (that we call a “speed regulator,” shown in gray in Fig. 1A). At low, intermediate, and high values of the speed regulator, cells transit through successive states at low, intermediate, and high speed, respectively (Fig. 1A, Left, Middle, and Right, respectively).
Fig. 1.
The core mechanism of speed regulation model is flexible, can pattern elongating and nonelongating tissues, and can explain short-germ to long-germ evolution in insects. (A) Core mechanism of speed regulation model: The speed of sequential activation of states (or fates) is regulated by the concentration of a speed regulator. Different states are shown in different colors (in the order of sequential transitioning): blue, red, green, gold, and brown. The speed regulator is shown in gray. (B) Speed regulation model can operate in a gradient-based mode to pattern nonelongating tissues (Left) and in a wavefront-based mode to pattern elongating tissues (Right). (C) AP fates (shown in different colors) are specified during two different phases of insect early development: blastoderm and germband. Most AP fates are specified during the germband stage in short-germ insects (Left), and during the blastoderm stage in long-germ insects (Right). In intermediate-germ insects (Middle), anterior fates are specified in the blastoderm, whereas posterior fates are specified in the germband. (D) Presumed expression of speed regulator (gray) in insects. Blastoderm can be patterned with the gradient-based mode of speed regulation model, whereas germband can be patterned with the wavefront-based mode. (E and F) Computer simulation of two strategies for short- to intermediate- to long-germ evolution based on the speed regulation model. (E) A short-germ insect can evolve into an intermediate germ by delaying the blastoder-to-germband transition; similarly, an intermediate-germ insect can evolve into a long germ by introducing a further delay to blastoderm-to-germ transition (Movie S1). (F) A short-germ insect can evolve into an intermediate germ by boosting the speed regulator; similarly, an intermediate-germ insect can evolve into a long germ by further boosting the speed regulator (Movie S2).
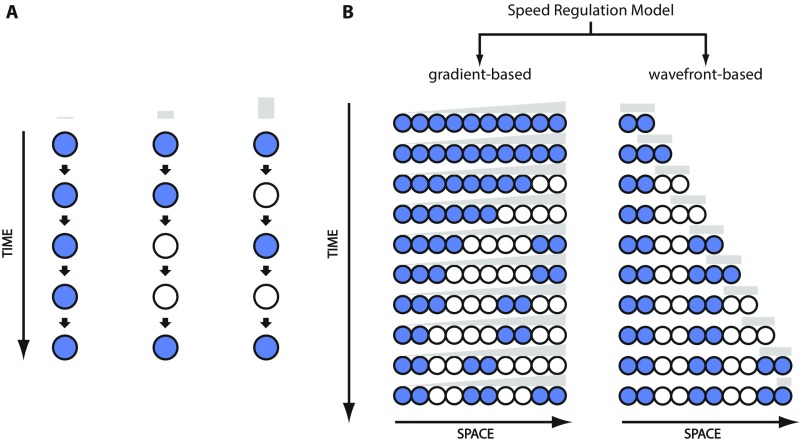
Next, consider a group of the aforementioned cells arranged along a spatial axis and subject to a static (i.e., not retracting) gradient of the speed regulator (which we will call a “speed gradient”; gray in Fig. 1B, Left). All cells transit through successive states, but they do so more slowly at lower values of the speed gradient, giving the appearance of waves of gene expression propagating from high to low levels of the speed gradient. With time, cells along the spatial axis are subdivided into domains of different states (Fig. 1B, Left, last row). We will call this mode of speed regulation gradient-based. Note that the “kinematic” or “pseudo” waves (described in refs. 1, 5, 7, and 28–33 and Fig. 1B, Left) do not require diffusion or cell−cell communication. However, the kinematic waves previously described in these references are oscillatory waves generated by regulating an oscillator with a frequency gradient (Fig. S1B, Left), whereas the waves in Fig. 1B, Left are generated by regulating a sequential process by a speed gradient.
Fig. S1.
Speed (here frequency) regulation model can segment elongating and nonelongating tissues. (A) Core mechanism of speed/frequency regulation model: The speed/frequency of a molecular clock is regulated by the concentration of a speed/frequency regulator. High phase of the oscillator is shown in blue, and low phase is shown in white. The speed/frequency regulator is shown in gray. (B) Speed/frequency regulation model can operate in a gradient-based mode to pattern nonelongating tissues (Left) and in a wavefront-based mode to pattern elongating tissues (Right).
If the gradient is very steep (forming a step function or a boundary) and retracts toward high levels of the gradient (we will call this retracting boundary a wavefront), we end up with a model similar to the clock-and-wavefront model (with the clock replaced by an aperiodic sequential process; Fig. 1B, Right). In this mode, all cells start in the blue state, covered by the wavefront. As the wavefront retracts, some cells transit from the high to zero value of the wavefront. Cells still covered by the wavefront eventually transit to the next state (red in Fig. 1B, Right), whereas cells left behind by the wavefront stay in the blue state. This repeats until all cells along the spatial axis are subdivided into domains of different states (Fig. 1B, Right, last row of cells). We call this mode of speed regulation wavefront-based.
These considerations show that the same core mechanism (a temporal process whose speed of state transitioning is controlled by a speed regulator; Fig. 1A) can function in a gradient-based mode to pattern a nonelongating field of cells (Fig. 1B, Left), or in a wavefront-based mode to pattern an elongating field of cells (Fig. 1B, Right). Note that the same model can be used to generate a periodic pattern (i.e., segments), if the sequential process is replaced by an oscillator (Fig. S1).
Speed Regulation Model Offers a Mechanism for Short-Germ to Long-Germ Evolution in Insects.
The anterior fates of insects arise in a blastoderm (a structure with a fixed AP length), whereas more-posterior fates are specified in a germband (whose AP axis lengthens by convergent extension and/or cell divisions) (Fig. 1C). Insects differ in the number of fates specified in blastoderm vs. germband. In short-germ insects, most fates form during the germband stage (Fig. 1C, Left), while, in long-germ insects, most fates form during the blastoderm stage (Fig. 1C, Right). Intermediate-germ insects lie somewhere between those two extreme cases (Fig. 1C, Middle). Short-germ embryogenesis is thought to be the ancestral mode of insect development, but it is not clear how it evolved into intermediate- and long-germ modes.
Since both gradient-based (Fig. 1B, Left) and wavefront-based (Fig. 1B, Right) patterning use the same core mechanism of speed regulation (Fig. 1A), it is easy to imagine one mode converting to the other, offering a mechanism for short-germ to long-germ evolution in insects. In this mechanism, a posteriorly localized gradient of a speed regulator (gray in Fig. 1D) is static in the blastoderm stage, and it retracts with AP axis elongation during the germband stage (Fig. 1D). In a short-germ insect, AP fates would be specified during the germband stage in a wavefront-based mode (Fig. 1E, Left and Movie S1A). To evolve into an intermediate-germ insect, the wavefront gets shallower (forming a speed gradient) and the blastoderm-to-germband transition is delayed, allowing the first few fates to propagate into the blastoderm in a gradient-based fashion. After the blastoderm-to-germband transition, fates continue to form in a wavefront-based fashion (Fig. 1E, Middle and Movie S1B). To further evolve into a long-germ insect, the blastoderm-to-germband transition is delayed until all fates are specified in the blastoderm (Fig. 1E, Right and Movie S1C). This strategy assumes that there exists a mechanism to control the timing of blastoderm-to-germband transition. Alternatively, the level of the speed regulator could be boosted such that fate transitions speed up, causing more fates to form in the blastoderm (Fig. 1F and Movie S2), or the sequential gene activation process itself could evolve to run faster at the same speed gradient level.
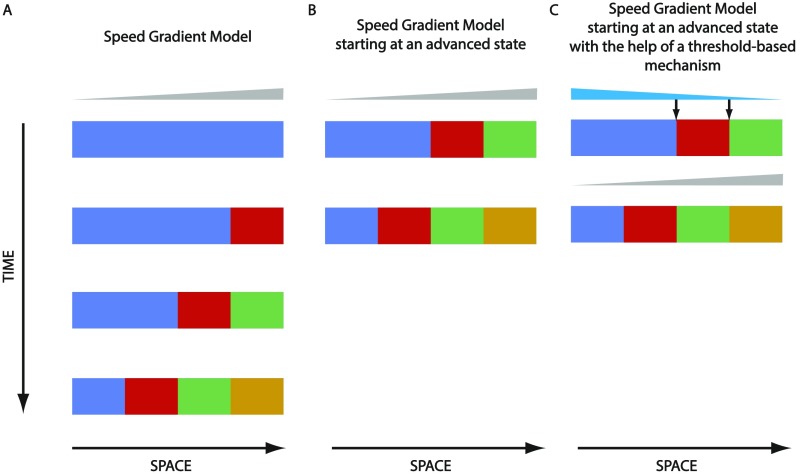
However, another possible mechanism for short- to long-germ evolution would be to start the patterning process at an advanced state (Fig. S2B). Such an advanced state (or initial pattern) could be reached using a threshold-based mechanism (Fig. S2C). For a more detailed discussion of the different possible mechanisms for short- to long-germ evolution, see SI Comparison Between the Proposed Short-Germ to Long-Germ Evolutionary Mechanisms.
Fig. S2.
Speeding up gradient-based patterning by initialization with an advanced state. (A) Shown is the gradient-based mode of speed regulation model. (B) Instead of initializing all cells with the first state (here blue), patterning could be sped up by prepatterning the cells along space with an advanced state (here blue, red, and green, from left to right). In this way, it takes a shorter time to reach the final state (here blue, red, green, and gold, from left to right). (C) Initializing the spatial axis with a prepattern could be achieved using a threshold-based mechanism (via another gradient, here in cyan), assuming that a threshold-based mechanism is faster than the speed regulation mechanism. Speed regulator is shown in gray.
Patterning the AP axis of insects has been previously proposed to depend on activation thresholds of a continuously increasing morphogen gradient (termed a “timer”) (34). The speed regulation model stands in contrast to threshold-based models in that it does not require a morphogen of large dynamic range to pattern the whole AP axis or a tight control of the morphogen concentration over time.
Gap Genes Are Expressed in Sequential Waves in Tribolium.
AP patterning in insects is carried out by two groups of genes: gap genes and pair-rule genes (35). Gap genes are primarily responsible for specifying AP fates by regulating Hox genes [in addition to a possible role in segment counting (36)], while pair-rule genes divide the AP axis into segments. Here we describe AP fate specification by gap genes in the beetle Tribolium castaneum and discuss them in the context of our patterning and evolutionary models.
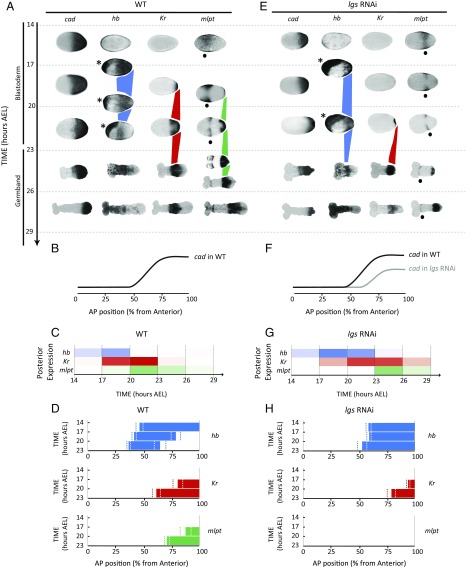
First, we examined the expression patterns of four essential gap genes in Tribolium: hunchback (hb) (37, 38), Krüppel (Kr) (39), milles-pattes (mlpt) (40), and giant (gt) (41) in consecutive 3-h egg lays at 24 °C, starting at the onset of AP patterning (Fig. 2A and Fig. S3A; see SI Detailed Description of Gap Gene Expression in WT and axn RNAi Embryos for detailed description of WT expression patterns; see Fig. S4 for gt expression with higher temporal resolution). As shown in Fig. 2A and Fig. S3A, gap genes are expressed in sequential waves that emanate from the posterior, propagate toward the anterior, then stabilize for a while, before they slowly decay.
Fig. 2.
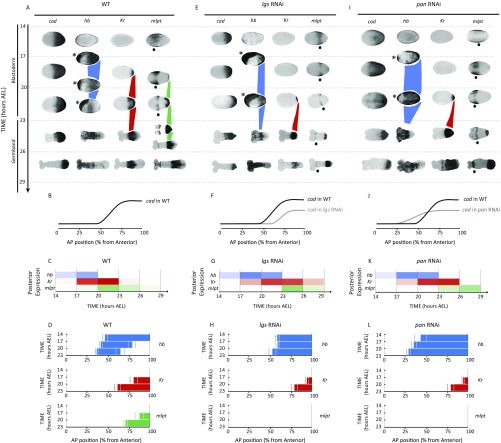
Dynamics and regulation of gap genes in Tribolium blastoderm. (A–D) Gap genes are expressed as sequential waves in WT Tribolium embryos within cad expression domain; cad is expressed as a posterior-to-anterior gradient in the blastoderm (cad in A; quantification of the gradient is shown in B) and retracts to the posterior end (growth zone) of the embryo in the germband stage (23 h AEL onward). The hb, Kr, and mlpt waves are traced in blue, red, and green, respectively, in A. Extraembryonic expression of hb is marked with an asterisk. Head expression of mlpt (not considered in our analysis) is marked with a black dot. (C) Temporal profile of gap genes expression at the posterior end of WT embryo demonstrates their sequential (yet overlapping) expression. Color intensity of a bar within a time window reflects the percentage of embryos having a high level of gene expression of the corresponding gene in that time window (Materials and Methods). (D) Spatial distribution of gap genes along the AP axis of WT Tribolium blastoderm over time (Materials and Methods) demonstrates their posterior-to-anterior shifts over time. Dashed lines show expression domain borders ± SE. For detailed description of gap gene expression in WT, see SI Detailed Description of Gap Gene Expression in WT and axn RNAi Embryos. (E–H) The cad gradient is reduced and shifted toward posterior in lgs RNAi embryos. Correspondingly, gap gene waves are slower and shifted toward posterior. B and F are reproduced with permission from ref. 7. In all embryos shown, anterior is to the left.
Fig. S3.
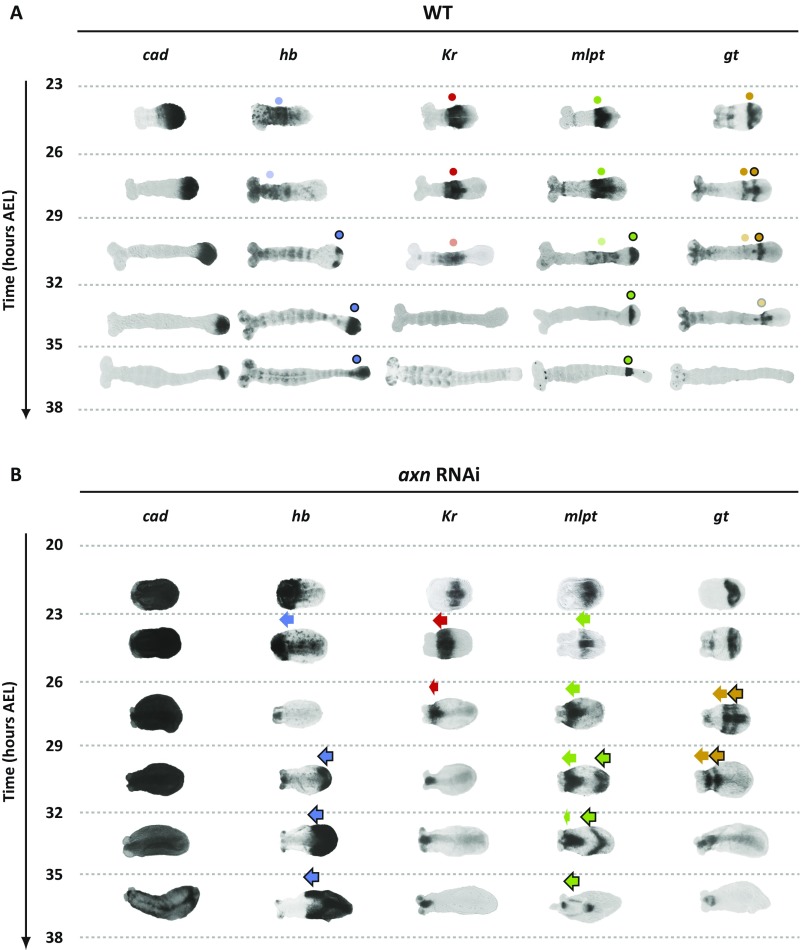
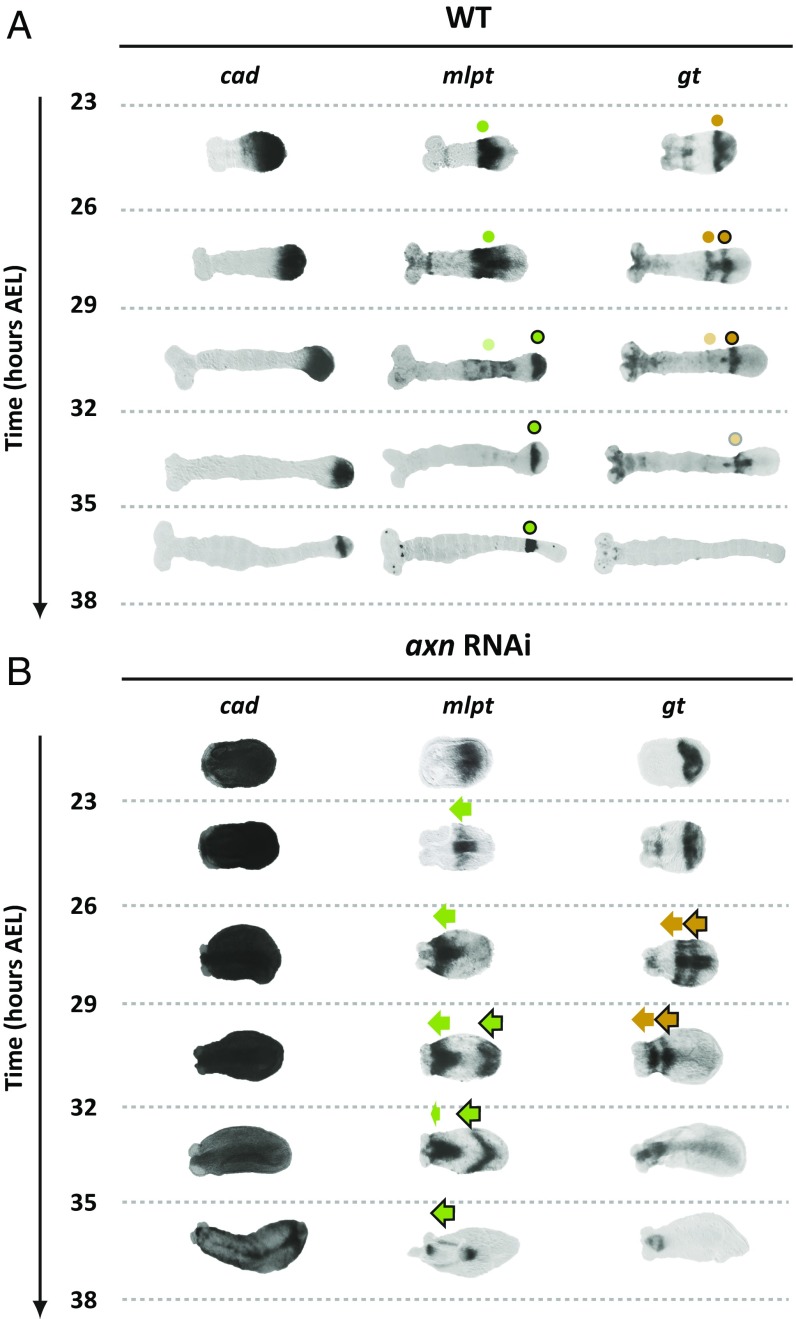
Dynamics and regulation of gap genes in Tribolium germband (full dataset). (A) Gap genes continue to be expressed sequentially in the posterior end of WT Tribolium germband (the so-called growth zone); cad is expressed in the growth zone and retracts as the germband elongates. More to the anterior, early expressed gap gene domains stabilize and eventually fade. Expression patterns are tracked by dots. Faint dots represent decaying expression. Dots outlined in black signify the second domain of genes that have two expression domains in the germband (hb, mlpt, and gt). (B) In axn RNAi embryos, germband experiences very limited axial elongation, and cad expression does not retract. Nevertheless, gap genes continue to emanate from the posterior and propagate toward anterior until they reach the (much reduced in size) head lobes. Expression patterns are tracked by arrows. Arrows outlined in black signify the second domain of genes that have two expression domains in the germband (hb, mlpt, and gt). For a detailed description of gap gene expression in WT and axn RNAi embryos, see SI Detailed Description of Gap Gene Expression. In all embryos shown, anterior is to the left.
Fig. S4.
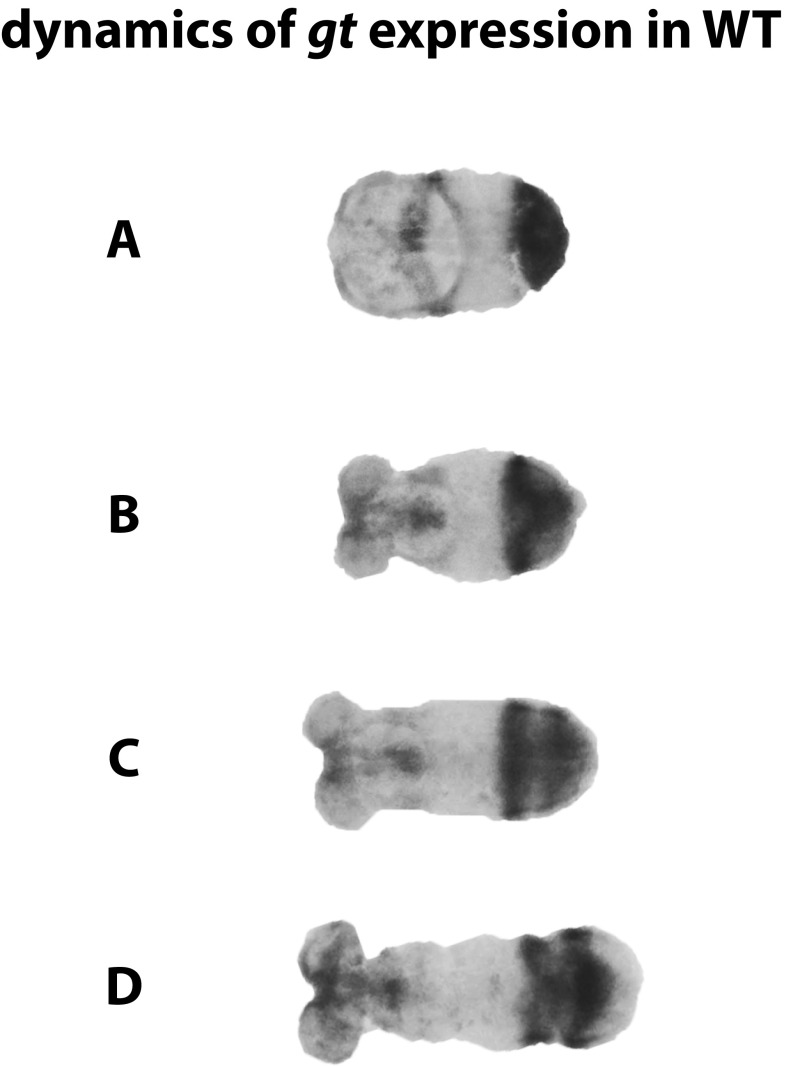
Dynamics of gt expression in WT embryos. (A) The gt expression turns on in the posterior end of early Tribolium germband, (B) then turns off, (C) turns on again, and (D) then finally turns off, creating two stripes of expression more anteriorly. Anterior is to the left.
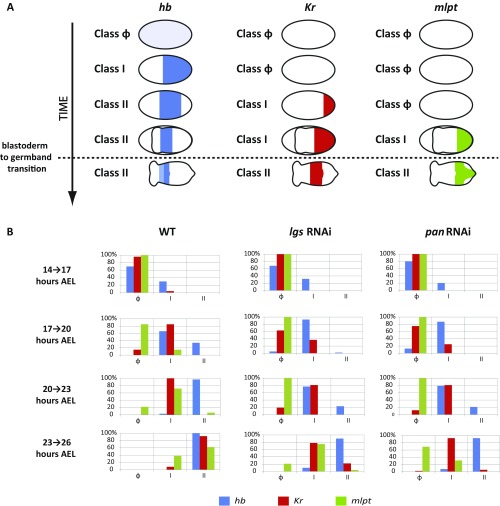
A temporal profile of gap gene expression patterns at the posterior end of the blastoderm was constructed based on analysis of gene activities at different time points (Materials and Methods and Fig. 2C and Fig. S5). As shown in Fig. 2C, gap genes are activated in sequential, yet overlapping, temporal order.
Fig. S5.
Distribution of temporal classes of gap gene expression patterns in timed egg collections. (A) Early gap gene (hb, Kr, and mlpt) expression patterns are each classified into three temporally consecutive classes: class Φ for early weak maternal expression (hb) or no expression (Kr and mlpt), class I for high expression at the posterior, and class II for an expression turning off at posterior. (B) Percentages of embryos belonging to each class are calculated for consecutive 3-h developmental windows covering the blastoderm and early germband stages of Tribolium: 14 h to 17 h, 17 h to 20 h, 20 h to 23 h, and 23 h to 26 h AEL.
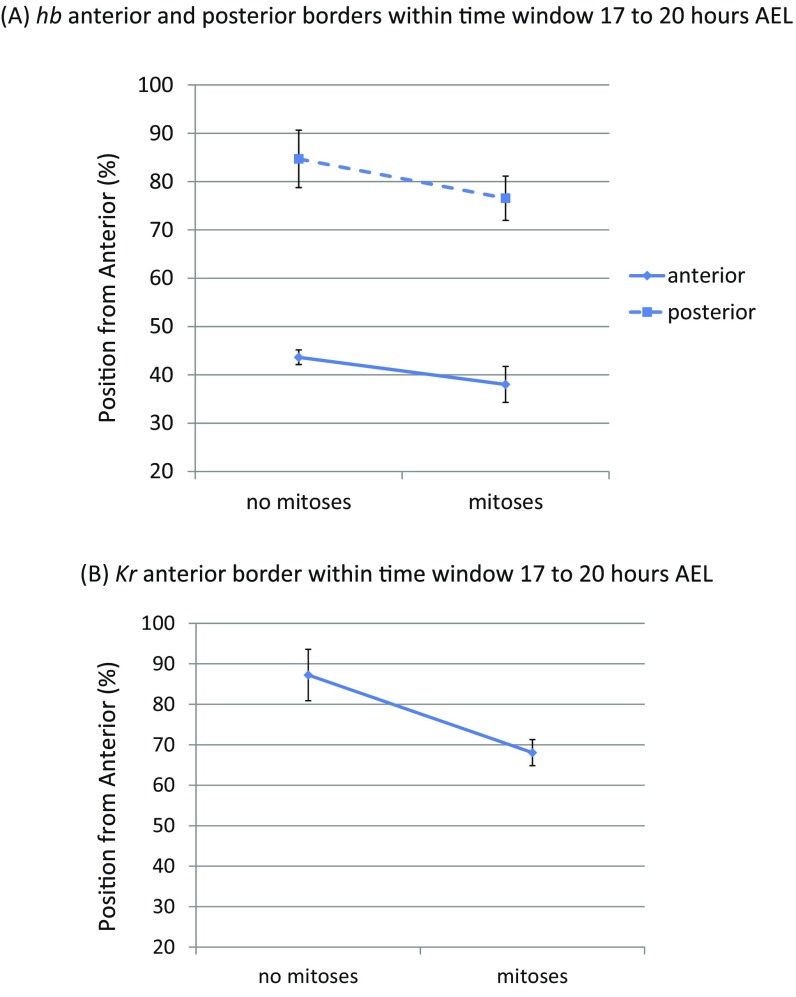
To determine whether the domains of gap gene expression propagate in waves, we analyzed the spatiotemporal dynamics of the anterior expression borders of hb, Kr, and mlpt, and the posterior border of hb during the blastoderm stage in timed egg collections (Materials and Methods and Fig. 2D). From Fig. 2D, it is clear that gap gene expression domains indeed propagate in waves from posterior to anterior in the Tribolium blastoderm. To examine if the shifting of hb and Kr expression domain borders is smooth, we analyzed their dynamics with higher temporal resolution between 17 h and 20 h after egg lay (AEL) (Fig. S6), and found them indeed to shift smoothly.
Fig. S6.
The hb and Kr expression domain borders undergo dynamic shifts within 17 h to 20 h AEL in Tribolium blastoderm. To examine if the shifting of hb and Kr expression domain borders is smooth, we analyzed their dynamics with higher temporal resolution. The last cycle of synchronous mitoses in the Tribolium blastoderm stops before 14 h AEL (5). Midway during the 17- to 20-h window, the blastoderm starts a phase of asynchronous mitoses that lasts until 23 h AEL. We compared border positions of hb and Kr expression domains in early versus later times within the 17- to 20-h window, marked by the lack and possession of mitoses, respectively. We found that the anterior borders of both hb and Kr indeed shift smoothly from posterior to anterior. (A) Positions of anterior and posterior borders of hb expression domain along the AP axis of Tribolium blastoderm during the no mitosis phase (early within 17 h to 20 h AEL) and the mitosis phase (late within 17 h to 20 h AEL). (B) Position of anterior border of Kr expression domain along the AP axis of Tribolium blastoderm during the no mitosis phase and the mitosis phase.
Gap Gene Waves Are Arrested into Stable Domains upon the Retraction of cad.
The homeodomain transcription factor caudal (cad) is involved in posterior specification and patterning in many bilateria (42–44). In Tribolium, cad is expressed in a posterior-to-anterior gradient during the blastoderm stage (from 0 h to 23 h AEL; shown 14 h to 23 h AEL in Fig. 2A), then retracts to the posterior end during the germband stage (7, 42) (from 23 h to 38 h AEL, Fig. S3A) and remains restricted to the posterior end (usually called the “growth zone”), retracting posteriorly as the germband elongates (Fig. S3A).
We note that gap gene expression domains are only activated sequentially at the posterior end of the embryo, more specifically within the cad expression domain (Fig. 2A and Fig. S3A). Outside this region, gap gene expression domains seem to be stable for a while before eventually fading. To determine whether retraction of the cad gradient correlates with the arrest of gap gene expression waves, we compared gap gene expression within and outside of the cad-expressing domain in doubly stained embryos (Fig. S7). We found that, indeed, gap gene waves are dynamic in the presence of cad and are stabilized upon retraction of the cad gradient.
Fig. S7.
Characterization of gap gene wave dynamics upon the retraction of cad gradient. Here we carefully examine if the retraction of cad gradient correlates with the arrest of gap gene expression waves. The cad retracts to posterior at the onset of the germband stage. Since the AP axis of the germband undergoes continuous elongation, we need stable nonshifting positional markers to which we can compare gap gene borders. It was previously shown that the pair-rule gene even-skipped (eve) is expressed in waves that slow down while propagating from posterior to anterior until they finally stabilize and split into two secondary domains (5). This is clear from comparing eve transcripts to Eve proteins in the same embryos in A (5). As eve emanates from the posterior, there is a clear shift between eve transcripts and proteins. These shifts become progressively smaller as eve stripes propagate away from the posterior. Finally, eve transcripts and proteins completely overlap at the time when their expressions split into two secondary domains (in A). This indicates that eve secondary domains are stable and undergo no further shifts. Due to the stability of the splitting Eve stripes, we will use them as positional markers along the AP axis. Late within 20 h to 23 h AEL, the anterior border of hb coincides with the anterior border of the first stripe of Eve (white arrow in C). At that time, the first Eve stripe has not split yet, but its expression is already stable, judging from the complete overlap between eve mRNA and Eve proteins (A, 20 h to 23 h AEL). By that time, cad gradient has retracted to abut the posterior border of the second Eve stripe (white arrow in B), away from the anterior border of hb. Early within 23 h to 26 h AEL, the anterior border of hb was found to be still coinciding with the anterior border of first Eve stripe (now fully split, cyan arrow in C). At later times, the anterior half of hb expression decays, precluding further analysis (late 23 h to 26 h AEL, C). On the other hand, mlpt expression is more to the posterior of hb and is within the spatial limit of cad expression during both 20 h to 23 h AEL and 23 h to 26 h AEL (compare D to B). Correspondingly, the anterior border of mlpt continues to propagate toward anterior until it reaches the posterior border of the second (splitting) Eve stripe and remains there (compare the relative positions of red and green dashed lines in D with time). This suggests that gap gene waves are dynamic in the presence of cad and are stabilized upon the retraction of cad gradient.
Speed Regulation Model for Gap Genes in Tribolium.
In the speed regulation model for AP patterning in insects (Fig. 1), a speed regulator can function in the form of a speed gradient to pattern the blastoderm and in the form of a wavefront to pattern the germband. In this model, the speed gradient induces waves of AP fate-determining genes to propagate from posterior to anterior. Upon speed gradient retraction (and transition into a wavefront), these gene expression patterns stabilize into specific expression domains. This describes the situation in Tribolium, where cad fills the role of a speed regulator, a hypothesis that will be examined in the subsequent sections.
In the basic speed regulation models shown in Fig. 1, we assumed that AP fate-determining genes are expressed in a nonoverlapping fashion. However, gap genes in Tribolium are expressed in overlapping and nested domains. Modifying the temporal process in our model to reflect that of gap genes in Tribolium embryos, and assuming cad (or a factor whose expression correlates with that of cad) to act as a speed regulator, simulates the experimentally observed results (Fig. 3, WT; Movie S3A; compare with gap genes expression in Fig. 2A and Fig. S3A).
Fig. 3.
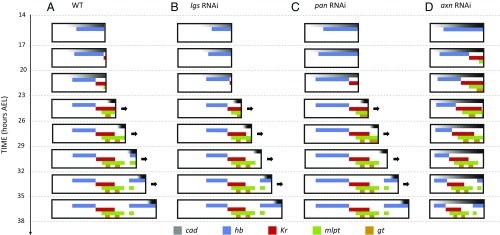
Speed regulation model recapitulates gap gene expression in Tribolium WT, lgs RNAi, pan RNAi, and axn RNAi embryos. (A) In a computer simulation, where the speed of Tribolium gap gene sequence is regulated by cad gradient (black/gray; darker corresponds to higher concentration), gap gene (hb, blue; Kr, red; mlpt, green; gt, gold) spatiotemporal dynamics were recapitulated during blastoderm and germband stages of WT Tribolium embryos (compare with Fig. 2A and Fig. S3A). (B) To simulate lgs RNAi background, cad gradient was reduced and shifted toward posterior. Accordingly, gap gene waves were slower and shifted toward posterior (compare with Fig. 2E). (C) To simulate pan RNAi background, cad gradient was reduced, stretched, and shifted toward anterior. Accordingly, gap gene waves were slower, stretched, and shifted toward anterior (compare with Fig. S8I). (D) To simulate axn RNAi background, germband elongation and cad gradient retraction were halted. Accordingly, gap gene waves continued to propagate and shrink in the germband and never stabilized (compare with Fig. S3B). See Movie S3.
The Intermediate-Germ Insect Tribolium Is Induced to Develop More as a Short Germ upon Reducing cad.
If cad acts as the speed regulator of gap genes, then, according to the speed regulation model, changes affecting the cad gradient should also affect the dynamics of gap gene expression, including their sequential activation at the posterior end of the Tribolium embryo. To test this assumption, we analyzed the timing of gap gene regulation after knocking down legless (lgs, a positive regulator of cad through Wnt) (7, 45–47) by maternal RNAi. We have previously shown that, in lgs RNAi embryos, the cad gradient shifts posteriorly and its maximum value at the posterior end of the embryo is reduced (7) (compare cad in Fig. 2 E and F to Fig. 2 A and B; see ref. 7 for quantification of the cad gradient in WT and after knockdown of several Wnt regulators, some of which are summarized in Fig. 2 B and F and Fig. S8 B, F, and J). In lgs RNAi knockdown embryos, gap genes are still expressed in sequential waves emanating from the posterior end of the embryo (Fig. 2 E, G, and H). However, the timing of gap gene sequential activation in lgs RNAi embryos is slower than in WT (whereas the timing of morphological events is not affected, including the blastoderm-to-germband transition, which takes place around 20 h to 23 h AEL in both WT and lgs RNAi embryos). In addition, gap gene domains in the blastoderm are shifted posteriorly, in accordance with the posterior shift of the cad gradient (compare Fig. 2 E–H to Fig. 2 A–D). The temporal slowdown and the spatial shift of gap gene expression upon the reduction and posterior shift of cad are consistent with our speed regulation model for gap genes in Tribolium (compare lgs RNAi with WT in Fig. 3, and compare Movie S3 B and A).
Fig. S8.
Dynamics and regulation of gap genes in the Tribolium blastoderm (full dataset). (A–D) Gap genes are expressed as sequential waves in WT Tribolium embryos within cad expression domain; cad is expressed as a posterior-to-anterior gradient in the blastoderm (cad in A; quantification of the gradient is shown in B) and retracts to the posterior end (growth zone) of the embryo in the germband stage (23 h AEL onward). The hb, Kr, and mlpt waves are traced in blue, red, and green, respectively, in A. Extraembryonic expression of hb is marked with an asterisk. Head expression of mlpt (not considered in our analysis) is marked with a black dot. (C) Temporal profile of gap genes expression at the posterior end of WT embryo demonstrates their sequential (yet overlapping) expression. Color intensity of a bar within a time window reflects the percentage of embryos having high level of gene expression of the corresponding gene in that time window (Materials and Methods). (D) Spatial distribution of gap genes along the AP axis of WT Tribolium blastoderm over time (Materials and Methods) demonstrates their posterior-to-anterior shifts over time. Dashed lines show expression domain borders ± SE. For detailed description of gap gene expression in WT, see SI Detailed Description of Gap Gene Expression. (E–H) The cad gradient is reduced and shifted toward posterior in lgs RNAi embryos. Correspondingly, gap gene waves are slower and shifted toward posterior. (I–L) The cad gradient is reduced, stretched, and shifted toward anterior in pan RNAi embryos. Correspondingly, gap gene waves are slower, stretched, and shifted toward anterior. B, F, and J are reproduced with permission from ref. 7. Anterior is to the left.
In applying the speed regulation model to the evolution of insect patterning modes, one strategy for the evolution of long-germ to a more short-germ-like mode of embryogenesis (where more fates are specified in the germband) would be to reduce the level of the speed regulator gradient, while maintaining the timing of the blastoderm-to-germband transition (Fig. 1F and Movie S2). This was observed in the lgs RNAi knockdown embryos, where gap gene sequential activation was slower compared with WT, while the timing of the blastoderm-to-germband transition was not affected (compare Fig. 2 E and G to Fig. 2 A and C). We noticed that, while most of hb, Kr, and mlpt expression took place during the blastoderm stage in WT, most of Kr and all of the mlpt expression occurred during the germband stage in lgs RNAi embryos (compare Fig. 2 E and A). Thus, in the lgs RNAi background, Tribolium embryos appear to develop in a more short-germ mode.
In our evolutionary model, reduction of the speed regulator concentration is essential for transitioning toward short-germ embryogenesis, but posterior shifting of the speed regulator gradient is not. We have previously shown that, in pangolin (pan, a Wnt effector) RNAi knockdown embryos, the cad gradient is reduced, stretched, and shifted anteriorly (in the opposite direction from the shift observed in lgs RNAi embryos; compare Fig. S8 I and J to Fig. S8 A and B and Fig. S8 E and F). Indeed, sequential gap gene activation is slower in pan RNAi embryos, in accord with reduced cad. The spatial extent of the leading gap gene (hb) is stretched and shifted anteriorly, in accord with the stretch and shift of the cad gradient (compare Fig. S8 I–L with Fig. S8 A–D). The anterior shift and reduced speed of gap gene expression upon the anterior shift and reduction of cad is consistent with our speed regulation model of gap genes in Tribolium (compare pan RNAi with WT in Fig. 3; compare Movie S3 C and A). Thus, pan RNAi embryos also developed more like a short-germ insect, similarly to the lgs RNAi embryos. In both lgs and pan RNAi embryos, most of Kr and mlpt expression occurred in the germband (compare Fig. S8 A, E, and I).
The Intermediate-Germ Insect Tribolium Is Induced to Develop More Like a Long Germ upon Halting cad Retraction.
According to our speed regulation model of insect evolution, one strategy by which a short-germ mode of insect development might evolve into a long-germ mode is to arrest the blastoderm-to-germband transition (Fig. 1E and Movie S1). In this strategy, the speed gradient would not retract, and new fates would continue to propagate into the blastoderm. Axin (axn) is a negative regulator of Wnt signaling. In axn RNAi Tribolium embryos, the blastoderm develops into a germband that does not undergo appreciable axis elongation (compare Fig. 4B and A). Moreover, the cad gradient does not undergo any anterior-to-posterior retraction in these germbands (Fig. 4B, cad). Hence, in many aspects, axn RNAi germbands physically and molecularly resemble a blastoderm.
Fig. 4.
Dynamics and regulation of gap genes in Tribolium germband. (A) Gap genes continue to be expressed sequentially in the posterior end of WT Tribolium germband (the so-called growth zone); cad is expressed in the growth zone and retracts as the germband elongates. More to the anterior, early expressed gap gene domains stabilize and eventually fade. Expression patterns are tracked by dots. Faint dots represent decaying expression. Dots outlined in black signify the second expression domains of mlpt and gt. (B) In axn RNAi embryos, germband experiences very limited axial elongation, and cad expression does not retract. Nevertheless, gap genes continue to emanate from the posterior and propagate toward anterior until they reach the (much reduced in size) head lobes. Expression patterns are tracked by arrows. Arrows outlined in black signify the second domain of mlpt and gt. For detailed description of axn RNAi phenotype, see SI Detailed Description of Gap Gene Expression in WT and axn RNAi Embryos. For the full dataset of all gap gene expression dynamics during germband stage, see Fig. S3. In all embryos shown, anterior is to the left.
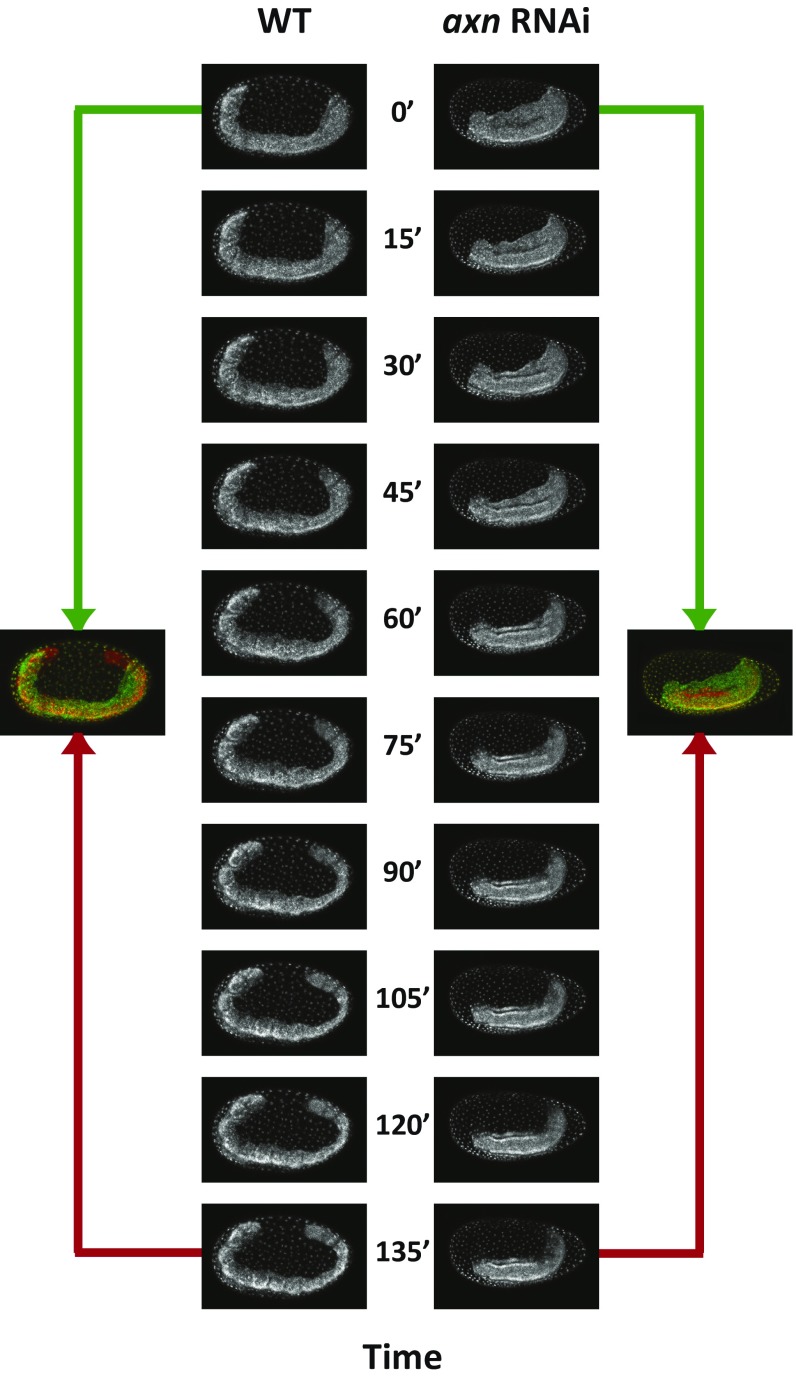
In a time series of axn RNAi embryos, the germband seemed to experience very limited axis elongation (Fig. 4B). However, since it is difficult to compare the sizes of different embryos due to embryo-to-embryo variation, we analyzed axis elongation in individual embryos using live imaging of a nuclear GFP line in Tribolium (4) for both WT and axn RNAi embryos (Movie S4). In Fig. S9, live imaging snapshots of single WT and axn RNAi embryos are shown. In the WT embryo, progressive elongation of the germband along the AP axis was evident. In comparison, axn RNAi embryos extended dorsoventrally but no appreciable AP axis elongation was observed. Although late axn RNAi germbands undergo some elongation in the AP direction, this was not accompanied by retraction of the cad gradient (Fig. 4B, cad; however, overall decay of cad expression in axn RNAi embryo was observed at 32 h to 38 h AEL).
Fig. S9.
Germbands of axn RNAi embryos undergo limited AP axis elongation compared with WT. Shown are snapshots of live imaging of WT and axn RNAi Tribolium embryos during germband stage (Movie S4). As clear from the overlay of early (green) and late (red) time points, WT germband experiences substantial growth along the AP axis. On the other hand, axn RNAi germbands experience little or no growth in the AP direction. Note that, in the axn RNAi embryo shown, the embryo slides dorsally (upward) inside the egg. In all embryos shown, anterior is to the left, and dorsal is up.
Halting axis elongation and cad gradient retraction in axn RNAi embryos has dramatic consequences on gap gene expression dynamics. The gap gene expression domains never stabilize and continue to propagate anteriorly until they reach the edge of the cad gradient, abutting the tiny residual head lobes (Fig. 4B for mlpt and gt expression, and see Fig. S3B for the full dataset; see SI Detailed Description of Gap Gene Expression in WT and axn RNAi Embryos for detailed description of the axn RNAi phenotype). This is consistent with our speed regulation model for gap genes in Tribolium, in which gap gene expression domains continue to shrink and propagate from posterior to anterior within the stabilized cad gradient (compare axn RNAi with WT in Fig. 3, Fig. S3, and Movie S3). In addition, these results suggest that germband elongation and cad retraction is not necessary for gap gene domain formation (however, they might be necessary for domain stabilization and for producing the required expression domain widths). This suggests a simple mechanism for short- to long-germ evolution: Halt axis elongation and cad retraction, such that more gap genes can be accommodated in the blastoderm. Retracting or reducing the cad gradient should occur at some point to stabilize the final pattern, however. This is consistent with the evolutionary model presented in Fig. 1E.
A General Molecular Mechanism for the Speed Regulation Model: Gradual Enhancer Switching.
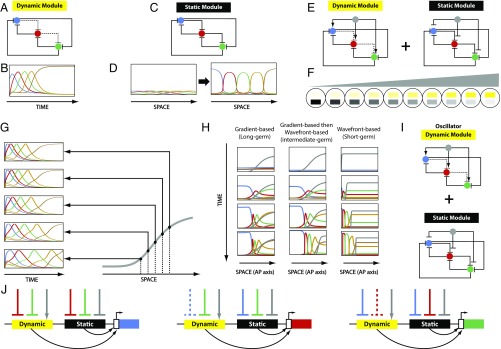
We have described a phenomenological model (i.e., without specifying any molecular realization) for speed regulation (Fig. 1). Now we attempt to find a general underlying molecular model (i.e., applicable but not specific to Tribolium). The phenomenological model of speed regulation has two components (Fig. 1A): (i) a mechanism for sequential gene activation and (ii) a mechanism for tuning the speed of sequential activation by the concentration of a molecular factor. One type of gene regulatory network (GRN) that generates sequential gene expression is the genetic cascade shown in ref. 48 and Fig. 5A, in which all of the genes mutually repress one another. However, the repression exerted by each gene on the gene immediately following it in the cascade is weak. For one cell, this genetic module works as follows. If the cell is initially expressing the first gene in the cascade (the blue gene in Fig. 5A), then all other genes are strongly repressed, except for the gene immediately following it (red). Hence, the red gene turns on. Since the red gene strongly represses the blue gene, the blue gene turns off. Now the blue gene is off, and since the red gene is only weakly repressing the green gene, the green gene turns on. Since the green gene strongly represses both the red and blue genes, the red gene turns off and the blue gene is kept off. In this way, we end up with a sequential activation of genes in time in the order: blue, red, and then green (Fig. 5B; Note that the simulation in this figure is done using a five-gene version of the cascade shown in Fig. 5A, with gene order blue, red, green, gold, then brown). We will call this network (and any network that induces sequential gene activation) a “dynamic module.”
Fig. 5.
Gradual enhancer switching model. (A) A three-gene cascade (dynamic module). Solid line, strong repression; dashed line, weak repression. (B) Computer simulation of a five-gene cascade (same structure as the three-gene cascade: Every gene is strongly repressing all other genes, except only weakly repressing its immediate successor in the cascade). Shown are expression profiles of the cascade constituent genes over time. (C) A three-gene mutual exclusion gene network (static module). (D) Shown is an array of cells along a spatial axis. Active in each cell is a five-gene mutual exclusion gene network (same structure as the three-gene mutual exclusion network: Every gene is strongly repressing all others). Cells along the spatial axis are initialized with a broad and diffuse domains of the expression of five genes (Left). Over time, the diffuse domains get stronger and sharper (Right). (E) The gradual enhancer switching gene network: A speed regulator (gray) is activating all of the genes in the dynamic module, while repressing all of the genes in the static module. (F) Shown is an array of cells in which the gradual enhancer switching gene network is active. Applied to the array is a gradient of the speed regulator (gray). This results in the gradual switching from the dynamic module (yellow) to the static module (black) as we go from high to low values of the gradient. (G) Computer simulations of the gradual enhancer switching model at different positions along the spatial axis (i.e., different values of the gradient, shown in gray): The higher the concentration of the gradient, the higher the speed of sequential activation of genes. (H) Computer simulations of the gradual enhancer switching model under different conditions: nonretracting speed regulator (gradient-based, long-germ insects; Left), retracting speed regulator (wavefront-based, short-germ insects; Right), and nonretracting then retracting speed regulator (gradient-based then wavefront-based, intermediate-germ insects; Middle). See Movie S5. (I) The gradual enhancer switching model with an oscillator as a dynamic module. The model induces oscillatory kinematic waves of gene expression, observed in vertebrates and insects (Movie S7). (J) Encoding dynamic and static modules by separate enhancers ensures modularity, since each module requires different regulatory logic. Shown is the regulatory wiring required for each gene in the combined dynamic+static gene network in E. Solid lines, strong interactions; dashed lines, weak interactions.
Next, we turn to a mechanism to regulate the speed of this dynamic module. To do so, we introduce a (tunable) brake or stabilizer to the sequential process, such as the mutually exclusive gene circuit shown in Fig. 5C. Here all genes are repressing each other equally strongly. In this circuit, an initial bias in the expression of one of the genes in one cell gets amplified and stabilized, while the expression of the other genes is attenuated. This circuit eventually sharpens initially overlapping and diffuse spatial patterns (Fig. 5D). This strategy is thought to be used in gap gene regulation in Drosophila (49). We call such a network (and any network that helps stabilize a pattern) a “static module.”
Finally, we combine the static module with a gradient to modulate the speed of the dynamic module. We do so by regulating each gene by the additive activity of the two modules. If the dynamic module is positively regulated by the gradient, and the static module is negatively regulated by the same gradient (Fig. 5E, gradient is in gray), we see a gradual switching between the two modules as we go from high to low values of the gradient (Fig. 5F). In cells exposed to high doses of the gradient, the gene cascade will run full speed, whereas, in cells exposed to progressively lower doses of the gradient, the gene cascade will experience progressively higher resistance from the static module, and run progressively slower.
Indeed, simulations show that this scheme is able to modulate the speed of sequential gene activation: Progressively lower values of the gradient generate progressively more dilated (i.e., slower) temporal profiles of the gene cascade output (Fig. 5G). This is manifested in the induction of sequential waves of gene expression that propagate from high to low values of the gradient (Fig. 5H, Left and Movie S5C).
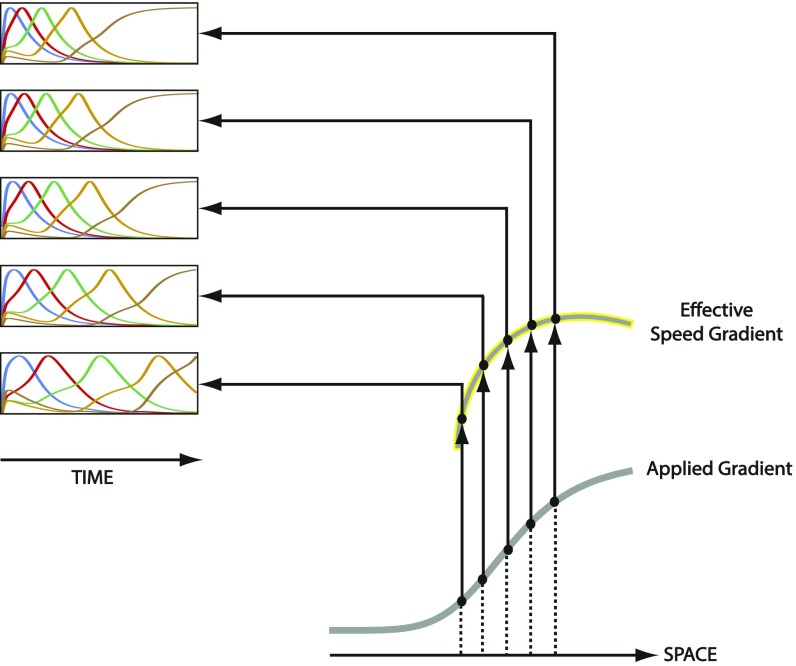
However, we noted that the generated gene expression domains in Movie S5C continue to propagate and shrink toward the lower end of the gradient to the limit of being diminishingly small. This is a characteristic of patterning by a nonretracing speed gradient (compare Movie S3 D and A), and can be remedied by retracting or decaying the gradient once a satisfactory expression pattern emerges. However, we also noted that the generated gene expression domains are compressed toward the lower end of the gradient compared with the higher end (Movie S5C). This is due to the fact that the effective speed gradient generated by our molecular model is more downwardly concave than the applied gradient (Fig. S10). This could be corrected by applying a more upwardly concave gradient, so that the effective speed gradient is linear and gene expression domains with equal widths are generated (Movie S6). For further discussion, see SI Possible Limitations to the Proposed Patterning and Evolutionary Models and Their Applicability to Different Insects.
Fig. S10.
The gradual enhancer switching model results in a more downwardly concave effective speed gradient than the applied gradient. Shown are computer simulations of the gradual enhancer switching model at different positions along the spatial axis (i.e., different values of the applied gradient, gray). Equal changes in applied gradient values result in unequal changes in speeds of sequential activation. Specifically, changes around lower values of the gradient induce bigger changes in speed, resulting in a downwardly concave effective speed gradient (gray outlined in yellow).
All in all, our model was successful in molecularly implementing the gradient-based model of speed regulation (Fig. 1B, Left), suitable for patterning the AP axis of long-germ insects (Fig. 5H, Left and Movie S5C). The model also works if the gradient is continuously retracting (Fig. 5H, Right and Movie S5A), i.e., it is successful in implementing the wavefront-based mode of speed regulation (Fig. 1B, Right), which is suitable for patterning the AP axis of short-germ insects. Finally, the model tolerates the switching from gradient-based to wavefront-based patterning (Fig. 5H, Middle and Movie S5B); hence, it is suitable for patterning the AP axis of intermediate-germ insects as well.
Our model is also able to molecularly realize a “frequency gradient” by simply having an oscillator as a dynamic module instead of a genetic cascade (Fig. 5I). This scheme is able to generate oscillatory waves that can be stabilized into periodic stripes, suitable for segmenting the AP axis of vertebrates as well as short-, intermediate-, and long-germ insects (Movie S7).
The central idea behind the proposed molecular model is the gradual switching between two modules or GRNs. This scheme could possibly be realized by just one enhancer per gene, if such an enhancer would be able to switch its wiring scheme depending on the concentration of the graded molecular factor (gray in Fig. 5). However, we suggest a molecular strategy that uses a separate enhancer for each wiring scheme (Fig. 5J). We think that this strategy, while not the only conceivable, is a biologically plausible one, for two reasons. First, while it is possible to change the logic of an enhancer upon the binding of a certain factor, this might be too complex to implement, especially if the wiring of the two networks is very different. A modular (and possibly more feasible) approach is to use different enhancers for different wiring schemes. Second, if the wiring of one network needs to change with evolution, it is more feasible to evolve one enhancer independently from the other (although the feasibility of a particular molecular scheme is, in the end, highly dependent on specific evolutionary history). This is again a consequence of the better modularity of the two-enhancer solution, which is the main advantage of regulating genes with different independent enhancers. For these reasons, and mainly because it is a direct realization of our computational modeling (where we simply added the activities of two separate gene activation functions; see SI Computational Modeling), we call this model “gradual enhancer switching.”
In summary, our gradual enhancer switching model (Fig. 5) is a molecular realization of the speed regulation principle (Fig. 1). It works under both gradient-based and wavefront-based conditions, and ensures convertibility between them.
A Molecular Realization for Tribolium Gap Gene Regulation.
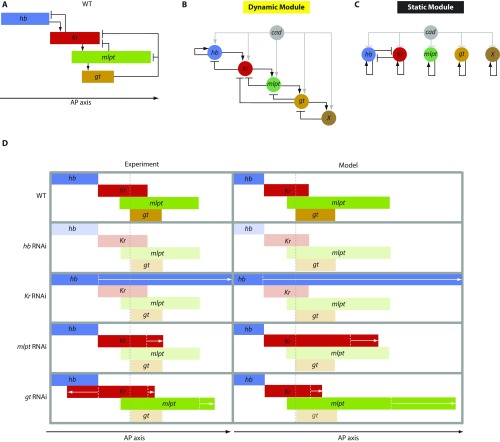
A gene network for Tribolium gap gene regulation has been previously constructed (35, 50). A summary of the genetic interactions in addition to a simplified schematic diagram for the relative positions of the final stable gap gene expression domains are shown in Fig. S11A. Although the gene network in Fig. S11A is indeed a genetic cascade and explains the sequential activation of gap genes at the very posterior end of Tribolium embryos, it is not obvious how the temporal output of the cascade is translated into a spatial pattern. However, a computational model in which cad mediates gradual switching between dynamic and static enhancers (Fig. S11 B and C; see SI Tribolium-Specific Enhancer Switching Model for detailed description of the model) successfully reproduced the spatiotemporal patterns of gap genes in WT (Fig. S11D, WT and Movie S8A). The model also recapitulates the spatiotemporal patterns of gap genes in lgs and pan RNAi embryos (Movie S8 B and C), which invoke evolution from a long- to a short-germ mode of development. The model recapitulates the spatiotemporal patterns of gap genes in axn RNAi embryos (Movie S8D), which appears equivalent to the evolution to a long-germ mode of development. The model also reproduces documented gap gene RNAi phenotypes in Tribolium (50) (Fig. S11D and Movie S9). We would like to note here that, while the dynamic module of our Tribolium model is data-driven, the wiring of the static module is mostly speculative (SI Tribolium-Specific Enhancer Switching Model), and, hence, we present the Tribolium enhancer switching model as a proof of principle and a working hypothesis.
Fig. S11.
Tribolium enhancer switching model vs. experiment (see also SI Tribolium-Specific Enhancer Switching Model). (A) A simplified schematic diagram showing final gap gene expression patterns along the AP axis, and genetic interactions between gap genes as deduced from genetic manipulations. (B and C) A two-enhancer model for gap gene regulation. An unknown factor (gene X) is assumed to repress gt from posterior. (D) Gap gene expression patterns in WT and different gap gene RNAi knockdowns as observed experimentally (Left) and as predicted by the two enhancers model (Right). For simplicity, the striped expression of gt and the posterior expression of hb are considered neither in experiment nor in model schematic diagrams. See Movie S8 and SI Tribolium-Specific Enhancer Switching Model.
Predictions.
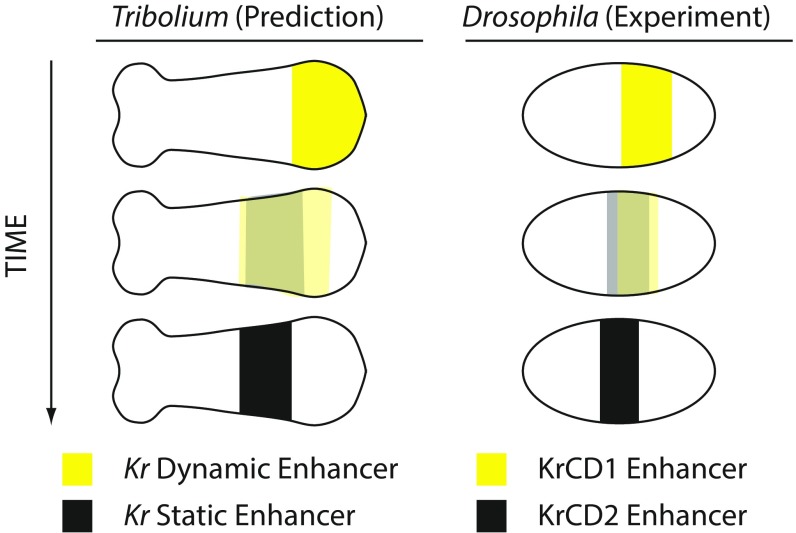
Our enhancer switching model (Fig. 5 and Fig. S11) predicts that each gap gene in Tribolium is regulated by two enhancers: a dynamic enhancer responsible for initialization and a static enhancer for stabilization. Movie S10 shows the predicted spatiotemporal expression of the dynamic and static enhancers for the gap gene Kr in our Tribolium enhancer switching model (Fig. S11 B and C). The model predicts both temporal and spatial differences in the expression driven by each of the two enhancers. The dynamic enhancer is activated early and posteriorly, and it drives progressively weaker expression in more-anterior cells. Meanwhile, the static enhancer turns on, and drives expression that progressively builds up and eventually stabilizes anteriorly (Fig. 6, Left).
Fig. 6.
Predictions of the enhancer switching model in Tribolium and recapitulation in Drosophila. (Left) The predicted expression of the dynamic (yellow) and static (black) enhancers of Kr in Tribolium according to the enhancer switching model (see also Movie S10). The dynamic enhancer turns on early and progressively decays with time while shifting toward anterior; meanwhile, the static enhancer is building up and forms a stable expression at a more anterior location. (Right) The expression dynamics of the two enhancers driving Kr expression in Drosophila: KrCD1 (yellow) and KrCD2 (black). KrCD1 is active first and progressively decays; meanwhile, KrCD2 turns on and stays active slightly more to the anterior. Faint colors signify weaker expression.
Interestingly, the gap gene Kr in Drosophila is regulated by two enhancers: KrCD1 and KrCD2, whose expression dynamics were recently described in detail using live imaging techniques (51). KrCD1 is activated first. With time, KrCD1 loses expression, while the expression of KrCD2 builds up. The expression of KrCD2 eventually stabilizes slightly more to the anterior (Fig. 6, Right). The gap gene gt is also regulated by two enhancers in Drosophila, one enhancer for initialization and the other for stabilization (52). Furthermore, two genetic programs have recently been implicated to be involved in regulating pair-rule genes in Drosophila (53, 54).
In summary, our gradual enhancer switching model predicts that each gap gene in Tribolium is regulated by two enhancers: one early and active posteriorly and the other late and active anteriorly (Fig. 6, Left).
SI Comparison Between the Proposed Short-Germ to Long-Germ Evolutionary Mechanisms
Short- to long-germ evolution took place independently several times throughout evolution [with some reports of the opposite evolutionary path (26)]. Since many long-germ insects complete patterning of their AP axis in a shorter time span compared with short-germ insects, fast patterning was usually assumed to be the drive for short- to long-germ evolution. In this case, the evolutionary strategy shown in Fig. 1F is more suitable. However, AP patterning in some long-germ insects [e.g., the long-germ beetle Callosobruchus maculatus (63) and the honey bee Apis mellifera (64)] is as slow as or even slower than some intermediate-germ insects (e.g., Tribolium castaneum). This could be explained either by the existence of a past evolutionary pressure for fast development that was subsequently relaxed or by other unknown evolutionary drives. In the latter case, the evolutionary path shown in Fig. 1E remains possible.
A third possible mechanism for short- to long-germ evolution that is more applicable to long-germ insects like Drosophila and Nasonia would be to start the patterning process at an advanced state (Fig. S2B). Such an advanced state (or initial pattern) could be reached using a threshold-based mechanism (Fig. S2C). This strategy might have the advantage of fast patterning, as required in the development of insects like Drosophila and Nasonia, if the used threshold-based mechanism happens to be faster than the speed regulation model. Such a threshold-based mechanism (or French Flag model) could be regulated by an anterior organizer (bicoid in Drosophila or otd in Nasonia; cyan in Fig. S2C).
SI Detailed Description of Gap Gene Expression in WT and axn RNAi Embryos
Detailed Description of Gap Gene Expression in WT Embryos.
A weak maternal expression of hb is initially detected (Fig. 2A, 14 h to 17 h AEL). Eventually, the zygotic expression of hb turns on at the posterior end of the blastoderm at late 14 h to 17 h AEL and stays on during 17 h to 20 h AEL (in addition to an extraembryonic expression, asterisk in Fig. 2A; posterior is to the right in all embryos shown). At around 20 h to 23 h AEL, hb expression clears from the posterior, leaving an anterior band of expression (Fig. 2A; blue dot in Fig. S3A). The embryo then transits to the germband phase, and the posterior stays void of hb expression up until 29 h to 32 h AEL (Fig. S3A), where hb expression turns on again (blue dot outlined in black, Fig. S3A) at the posterior end and stays on until the end of the AP patterning (35 h to 38 h AEL, Fig. S3A). The expression of Kr is first detected around 17 h to 20 h AEL at the posterior end of the blastoderm, then eventually clears from the posterior around 23 h to 26 h AEL (Fig. 2A; red dot in Fig. S3A) and stays clear from the posterior end until the end of the AP patterning (35 h to 38 h AEL, Fig. S3A). The expression of mlpt is detected mainly at 20 h to 23 h AEL at the posterior end of the blastoderm, and eventually clears around 23 h to 26 h AEL, leaving a domain of mlpt expression at more-anterior locations (Fig. 2A; green dot in Fig. S3A). The mlpt expression turns on again at 29 h to 32 h AEL (Fig. S3A) but clears quickly at 32 h to 35 h AEL leaving a narrow stripe of expression (green dot outlined in black, Fig. S3A). The expression of gt is first detected mainly at 23 h to 26 h AEL (Fig. S3A). From 23 h to 29 h AEL, gt expression quickly clears, then turns on, then clears again, forming two stripes of expression (Fig. S4).
The anterior border of zygotic hb expression starts at a 46% of the AP axis of the embryo (measured from anterior) around 14 h to 17 h AEL, then gradually shifts toward the anterior to reach 40% position at 17 h to 20 h AEL and 38% at 20 h to 23 h AEL. The anterior border of Kr starts at 80% position at 17 h to 20 h and reaches 62% position at 20 h to 23 h AEL. Similarly, the anterior border of mlpt and the posterior border of hb gradually shift from posterior to anterior (Fig. 2D).
Detailed Description of Gap Gene Expression in axn RNAi Embryos.
In time window 23 h to 26 h AEL, the first hb expression in WT embryos (blue dot in Fig. S3A) stops the continuous shrinkage and posterior-to-anterior propagation it was experiencing during the blastoderm stage. However, in axn RNAi embryos, this domain continues to shrink and shift toward the anterior during the germband stage, until it vanishes at 29 to 32 h AEL (blue arrow in Fig. S3B). The second domain of hb (blue dot outlined by back in Fig. S3A) appears in WT during 29 h to 32 h AEL and does not seem to propagate much toward the anterior. However, in axn RNAi embryos, the second domain of hb continues to propagate toward the anterior to cover more than half the embryo (blue arrow outlined by black in Fig. S3B).
In WT, Kr domain stabilizes at midway position along the germband during 23 h to 32 h AEL (red dot in Fig. S3A). In axn RNAi embryos, however, Kr expression domain continues to shrink and propagate toward the anterior until it reaches the anterior border of cad expression (Fig. S3B).
These observations are strikingly more obvious for mlpt and gt expressions. In WT, the first abdominal domain of mlpt expression (green dot in Fig. S3A) stabilizes into a stable domain at a midway location in the germband. The second mlpt domain (green dot outlined by black in Fig. S3A) follows shortly after, and stabilizes posterior to the first mlpt domain. In axn RNAi embryos, however, the first and second mlpt expression domains (green arrows in Fig. S3B) continue to propagate toward the anterior until they reach the border of cad expression. The same scenario is observed for the two striped domains of gt expression (compare gold dots in WT embryos in Fig. S3A and gold arrows in axn RNAi embryos in Fig. S3B).
SI Possible Limitations to the Proposed Patterning and Evolutionary Models and Their Applicability to Different Insects
According to our speed regulation model, a static speed gradient can pattern the blastoderm of intermediate-germ insects (e.g., Tribolium, Oncopeltus, and Dermestes) in a gradient-based fashion. Axis elongation could then mediate the retraction of the speed gradient to (i) stabilize the domains already formed in the blastoderm and (ii) pattern the germband of these insects in a wavefront-based fashion. A static speed gradient can, in theory, also pattern the whole AP axis of the blastoderm of long-germ insects (e.g., Drosophila, Nasonia, and Apis). However, there are a number of possible limitations to this strategy. First, the pattern generated by a gradient-based mechanism (Fig. 1B, Left) will remain dynamic and continue to shrink and propagate toward the lower end of the gradient as long as the speed gradient is applied. However, processes downstream of gap genes (e.g., Hox gene regulation) could read out this information on the run as gap gene domains are shifting [interestingly, it has been suggested that the dynamic readout of shifting gap gene domains by pair-rule genes is functionally important in Drosophila (54)]. Alternatively, dynamic gap gene expression patterns could stabilize if the speed gradient retracted at some point in time. This retraction could be mediated by the gradual decay of the speed gradient, as might be the case in Drosophila, Nasonia, and Apis, in which cad is observed to decay gradually (65–67).
Another possible limitation to using a pure gradient-based mechanism for patterning the AP axis of long-germ insects is the failure of the enhancer switching model to induce indefinitely faster sequential activation of genes upon increasing the level of the regulatory gradient (i.e., the dependence of the speed of sequential activation of genes upon the speed regulator hits a saturation point). This limits the ability of a static gradient to speed up patterning, a possible requirement in insects such as Drosophila and Nasonia (and even a possible drive for their evolution to their long-germ mode of embryogenesis). In this case, a speed gradient mechanism could evolve into a threshold-based simultaneous strategy (that might prove faster than patterning by sequential gene activation), observed in long-germ insects like Apis, Nasonia, and Drosophila. However, even in the extreme case of simultaneous patterning (e.g., in Drosophila), gap and pair-rule gene expression dynamics exhibit a hint of sequential regulation in the form of slight posterior-to-anterior shifts (51, 66, 68–71). This is evident near the shifting border, where the expression of one gene turns off and the expression of another gene turns on. This “simultaneous-plus-shift” mode of patterning can be explained within the speed regulation framework by assuming that an anterior gradient (like bicoid in Drosophila) would initialize the pattern in a threshold-dependent fashion, and then a posterior speed gradient (like cad) kicks in to mediate the posterior-to-anterior shifts (SI Comparison Between the Proposed Short-Germ to Long-Germ Evolutionary Mechanisms and Fig. S2). This could be implemented molecularly within the enhancer switching framework presented here, if an anterior gradient activates either the dynamic or static enhancer in a threshold-dependent fashion. Interestingly, Nasonia exhibits a dual mode of sequential and simultaneous patterning (72), which might be a midway between pure speed regulation and a threshold-based model.
SI Computational Modeling
All computational models were created using Matlab. Speed gradient simulations (Movies S1–S3) are based on a straightforward implementation of the qualitative model shown in Fig. 1 A and B.
For GRN modeling, the activity of an enhancer E of gene G to which Na activators (Ai, i = 1 to Na) and Nr repressors (Rj, j = 1 to Nr) bind is modeled by multiplying Hill functions of individual binding proteins
where E is the activity of enhancer E, Ai is the concentration of activator Ai, Rj is the concentration of repressor Rj, nai is the cooperativity of Ai binding to the enhancer E, nrj is the cooperativity of Rj binding to the enhancer E, Ki is the dissociation constant of activator Ai, and K′j is the dissociation constant of repressor Rj.
The transcription rate of gene G (G) regulated by two separate enhancers (E1 and E2) is modeled as a weighted sum of the activity of the two enhancers: . Below are complete differential equations for GRN models used to generated Movies S5–S10.
-
i)
The following are the equations used for modeling the five-gene gradual enhancer switching model (five-gene version of the GRN in Fig. 5A). XDi is the activity of the dynamic enhancer of gene Xi. XSi is the activity of the static enhancer of gene Xi. Xi is the mRNA concentration transcribed by gene Xi. G is the concentration of the (speed regulator) gradient G.
Dynamic enhancers.
Static enhancers.
Combining the activities of dynamic and static enhancers.
Initial conditions.
X1 = 0.1, X2=X3=X4=X5 = 0.
-
ii)
The following are the equations used for modeling a three-gene gradual enhancer switching model, with an oscillator used as a dynamic enhancer (Fig. 5I) and a three-gene mutually exclusive GRN as a static enhancer (Fig. 5C). XDi is the activity of the dynamic enhancer of gene Xi. XSi is the activity of the static enhancer of gene Xi. Xi is the mRNA concentration transcribed by gene Xi. G is the concentration of the (speed regulator) gradient G.
Dynamic enhancers.
Static enhancers.
Combining the activities of dynamic and static enhancers.
-
iii)
The following are the equations used for modeling the Tribolium GRN model in Fig. S11.
Dynamic enhancers.
Static enhancers.
Combining the activities of dynamic and static enhancers.
SI Tribolium-Specific Enhancer Switching Model
A gene network for Tribolium gap gene regulation has been previously constructed (35, 50). A summary of the genetic interactions in addition to relative positions of gap gene expression domains are shown in Fig. S11A. However, it is not obvious how this network results in the spatial pattern observed experimentally. For example, since mlpt expression is absent in Kr RNAi knockdown embryos, Kr was assumed to be an activator of mlpt (Fig. S11A). However, Kr and mlpt are only partially overlapping. An anterior portion of the Kr domain is void of mlpt expression, and a posterior portion of mlpt expression is present without a corresponding Kr expression. It was also deduced that mlpt is repressing Kr, since the Kr domain extends to the posterior in mlpt RNAi embryos. However, it is not clear how the overlapping domains of Kr and mlpt could form in this case. Nonetheless, the network in Fig. S11A is able to explain the temporal order of gap genes in the very posterior end of the embryo since it is wired as a genetic cascade, but fails to explain the spatial pattern formed in more-anterior regions.
These seemingly paradoxical observations can be reconciled using the speed regulation model (Figs. 1 and 3 and Movie S3). The network in Fig. S11A is responsible for the sequential activation of gap genes, while a posterior-to-anterior gradient (potentially cad) acts as a speed gradient that translates gap gene sequential activation into spatial domains. Here we are going to suggest a gene network realization for gap gene regulation in Tribolium based on our gradual enhancer switching model (Fig. 5). Since the data-driven network in Fig. S11A is in good agreement with observations in the very posterior end, it is a good candidate for the dynamic enhancer in our model (Fig. S11B).
The static enhancer in Fig. 5C ensures that genes are mutually exclusive. However, we notice that not all gap genes are mutually exclusive in Tribolium (Fig. S11A). Hence, we used a simple realization for the static enhancer: an autoactivation circuit (Fig. S11C). However, since both hb and Kr are observed to be mutually exclusive in WT, we made those genes mutually exclusive (Fig. S11C). It is not known what factor contributes to the repression of gt from posterior or what causes its striped pattern (a potential candidate is one or more of pair-rule genes). We assumed, then, an additional factor X to repress gt posteriorly, and we sought to model gt expression as one contiguous domain, disregarding its striped expression. Also, we did not model the generation of the posterior-most expressions of mlpt and hb (respectively, green and blue dots outlined in black in Fig. S3A) since the factors involved in their generation are still unknown.
Indeed, a computational model in which cad mediates a gradual switching between the dynamic and static enhancers was successful in producing the spatiotemporal patterns of gap genes in WT (Movie S8A). The model recapitulates the spatiotemporal pattern of gap genes in lgs and pan RNAi embryos (Movie S8 B and C), which is also equivalent to the evolution to a short-germ insect. The model recapitulates the spatiotemporal patterns of gap genes in axn RNAi embryos (Movie S8D), which is also equivalent to the evolution to a long-germ insect.
Our model also reproduces the documented gap gene RNAi phenotypes (Fig. S11D and Movie S9). Upon knocking down hb by RNAi, the expressions of all other gap genes were undetectable. Upon knocking down Kr by RNAi, hb is extended toward the posterior in both experiments and in our model. Upon knocking down mlpt by RNAi, hb was found to be intact, gt to be absent, and Kr to have a limited shift toward the posterior in both experiments and our model. Upon knocking down gt by RNAi, hb was found to be intact, and both Kr and mlpt shift toward the posterior. Kr also experiences a shift toward the anterior in gt RNAi embryos (Fig. S11D). This is potentially due to a repression effect from the anterior expression of gt (not shown here). However, we don’t believe that the anterior expression of gt is the sole determinant of the anterior Kr border, since Kr and gt domains do not abut each other, while Kr and hb do.
Discussion
In this paper, we presented the speed regulation model, a patterning mechanism in which the speed of sequential activation of genes is regulated by a gradient. The model is capable of operating in two different modes, depending on the steepness of the gradient and its retraction dynamics. In the gradient-based mode (Fig. 1B, Left), the gradient is smooth and nonretracting. In the wavefront-based mode (Fig. 1B, Right), the gradient is steep (forming a boundary) and retracting. We used this observation to present a simple model for short-germ to long-germ evolution (Fig. 1 E and F).
The capacity of a nonretracting and smooth speed/frequency gradient (i.e., the gradient-based mode of speed regulation, Fig. 1B, Left) to generate spatial patterns by means of kinematic waves was first described in the context of oscillations in chemical reactions (30) and in the slime mold Physarum (29, 55), and later was shown to be involved in the patterning of Tribolium blastoderm (5). The gradient-based mode of the speed regulation model has also many similarities to the “temporal and spatial gradient” model proposed for neural tube patterning in vertebrates (15, 17, 19) and other models suggested for various developmental systems (56, 57). During neural tube patterning, for example, Shh forms a ventral to dorsal gradient. Neural fates emanate sequentially from the ventral end of the neural tube and expand toward more dorsal regions in the high-to-low directions of the Shh gradient. Moreover, both the concentration and duration of exposure of Shh regulate which fate a neural tube explant would reach in a given time window. This model is very similar to the gradient-based mode of speed regulation (Fig. 1B, Left), although usually described using different terminology. Curious similarities, indeed, between AP patterning in Drosophila and vertebrate neural tube patterning have been previously discussed (58).
The patterning capacity of the wavefront-based mode of speed regulation (Fig. 1B, Right) was first devised by Cooke and Zeeman (16) as a theoretical model for vertebrate somitogenesis and was termed the “clock-and-wavefront.” In 1997, the clock-and-wavefront model received experimental support when oscillations in the expression of the gene hairy were detected in the presomitic mesoderm of chicken embryos during somitogenesis (1). However, it was also observed that hairy oscillations are expressed in kinematic waves that propagate from posterior to anterior. Julian Lewis proposed that these wave dynamics are due to the gradual arrest of hairy oscillations (appendix of ref. 1). In other words, the somitogenesis clock is regulated by a retracting smooth “frequency gradient” as opposed to the steep frequency gradient in the original formulation of the clock-and-wavefront. However, the frequency gradient in these models is used merely as a cosmetic means to reproduce the observed kinematic waves, with no significant effect on the pattern generated by the original clock-and-wavefront model. Indeed, the retraction of the wavefront is the cause of the resulting spatial pattern, whether the wavefront is realized by a steep or smooth frequency gradient (7, 32). However, it was argued that a smooth frequency (or speed) gradient might ensure scaling (59) and robustness of the clock-and-wavefront model against noise in the expression of the wavefront (7).
Two classes of genes are involved in the earliest stages of AP patterning of insects: gap genes and pair-rule genes. Gap genes have aperiodic expression and are responsible for dividing the AP axis into different fates, whereas pair-rule genes have periodic expression and are responsible for dividing the AP axis into segments. In this paper, we described a speed gradient model for gap gene regulation in insects, where cad (or a factor whose expression correlates with cad) acts as the speed regulator. In an earlier paper, we described a frequency gradient model for pair-rule regulation in insects, where cad acts as the frequency regulator (7). The two models are essentially similar, and could run independently and in parallel, with cad acting as a common regulator.
In Fig. 5, we suggested a molecular realization for our phenomenological model of speed regulation. Most gene network modeling studies in development assume a simple regulatory function (enhancer) to regulate the transcription of each gene in the network. However, complex spatial patterns (e.g., multiple eve stripes in Drosophila) were found to be regulated by multiple enhancers, each driving a subset of the complete pattern (60). Even some single bands of gene expression were found to be regulated by multiple enhancers; in some cases, these enhancers are redundant (61), but, in others, they drive different expression dynamics (51) and encode different regulatory logics (62). This inspired us to use a different formalism for modeling gene networks. In our molecular realization of speed regulation, a gradient regulates the gradual transition between two enhancers encoding two different regulatory logics. This model recapitulated the spatiotemporal dynamics involved in AP fate specification in insects and offered a molecular mechanism for their evolution. However, the main prediction of our molecular model, namely the regulation of Tribolium gap genes by sets of two enhancers and the gradient-mediated switching between them, awaits experimental verification.
Materials and Methods
Immunocytochemistry, in situ hybridization, RNAi, egg collections for developmental time windows, calculating class distribution graph, and performing spatial measurements are done using procedures similar to those described in ref. 7. For more details, see SI Materials and Methods.
SI Materials and Methods
In Situ Hybridization, Immunocytochemistry, RNAi, and Imaging of Fixed Embryos.
In situ hybridization was performed using DIG-labeled RNA probes and anti-Digoxigenin::AP antibody (Roche). Signal was developed using BM-Purple (Roche), or Fast Red (Roche). Immunocytochemistry was performed using anti-Eve (mouse monoclonal antibody 2B8, hybridoma bank; University of Iowa) as primary antibody, and anti-mouse::POD as secondary antibody (ABC kit; Vector). AlexaFluor 488 tyramide (Invitrogen) was used to give green fluorescent signal. All expression analyses were performed using embryos from uninjected females or females injected with double-stranded RNA (dsRNA) of gene of interest. The dsRNA was synthesized using the T7 megascript kit (Ambion) and mixed with injection buffer (5 mM KCl, 0.1 mM KPO4, pH 6.8) before injection. Used dsRNA concentrations were 200 ng/µL for lgs, 200 ng/µL for pan, and 100 ng/µL for axn. Blastoderm-stage embryos were imaged with a Nikon Digital DXM 1200F camera on an Olympus BX50 microscope using Nikon ACT-1 version 2.62 software. Germband stage embryos were imaged with a ProgRes CFcool camera on Zeiss Axio Scope.A1 microscope using ProgRes CapturePro image acquisition software. Brightness and contrast of all images were adjusted and placed on a white background using Adobe Photoshop.
Live Imaging.
Embryos from uninjected (WT) and axn dsRNA injected (axn RNAi) females from a nuclear GFP line (4) were dechorionated by immersion in 1% bleach for 30 s. Embryos were mounted using the hanging drop method, with halocarbon oil 700 (Sigma). Time-lapse movies were taken by capturing 12 planes every 15 min, over ∼18 h at 26 °C to 28 °C with a Leica SP5 II confocal. A magnification of 10× was used at a resolution of 1,024 × 1,024.
Egg Collections for Developmental Time Windows.
Three-hour developmental windows were generated by incubating 3-h egg collections at 23 °C to 24 °C for the desired length of time. Beetles were reared in whole-wheat flour supplemented with 5% dried yeast.
Calculating Class Distribution Graphs and Temporal Profile of Gap Gene Expression at the Posterior End of the Embryo.
Class distribution graphs (Fig. S5B) were created by counting embryos belonging to different temporal classes of gap gene expression patterns (Fig. S5A) in each of the 3-h developmental windows: 14 h to 17, 17 h to 20, 20 h to 23 h, and 23 h to 26 h AEL. Gap gene temporal profiles (Fig. 2 C and G and Fig. S8 C, G, and K) were created by translating class percentages (in Fig. S5B) into colored bar intensities; 100% of class I is given maximum intensity, and 100% of classes Φ and II is given minimum intensity.
Performing Spatial Measurements of Gap Gene Expression Patterns in the Blastoderm Stage.
For each embryo within a timed egg collection in situ stained to show gap genes hb, Kr, and mlpt, the positions of the anterior and posterior borders along the AP axis were measured and normalized to embryo AP length, using a similar procedure to the one described in ref. 7 to measure eve expression pattern borders. For each timed egg collection in situ stained for hb, Kr, and mlpt, the average and SE for each spatial measurement were calculated.
Supplementary Material
Acknowledgments
We thank Michael Akam and James Briscoe for their comments on an early version of the manuscript.
Footnotes
The authors declare no conflict of interest.
This article is a PNAS Direct Submission. N.B. is a guest editor invited by the Editorial Board.
This article contains supporting information online at www.pnas.org/lookup/suppl/doi:10.1073/pnas.1702478114/-/DCSupplemental.
References
- 1.Palmeirim I, Henrique D, Ish-Horowicz D, Pourquié O. Avian hairy gene expression identifies a molecular clock linked to vertebrate segmentation and somitogenesis. Cell. 1997;91:639–648. doi: 10.1016/s0092-8674(00)80451-1. [DOI] [PubMed] [Google Scholar]
- 2.Dequéant ML, et al. A complex oscillating network of signaling genes underlies the mouse segmentation clock. Science. 2006;314:1595–1598. doi: 10.1126/science.1133141. [DOI] [PubMed] [Google Scholar]
- 3.Li Y, Fenger U, Niehrs C, Pollet N. Cyclic expression of esr9 gene in Xenopus presomitic mesoderm. Differentiation. 2003;71:83–89. doi: 10.1046/j.1432-0436.2003.700608.x. [DOI] [PubMed] [Google Scholar]
- 4.Sarrazin AF, Peel AD, Averof M. A segmentation clock with two-segment periodicity in insects. Science. 2012;336:338–341. doi: 10.1126/science.1218256. [DOI] [PubMed] [Google Scholar]
- 5.El-Sherif E, Averof M, Brown SJ. A segmentation clock operating in blastoderm and germband stages of Tribolium development. Development. 2012;139:4341–4346. doi: 10.1242/dev.085126. [DOI] [PMC free article] [PubMed] [Google Scholar]
- 6.Choe CP, Miller SC, Brown SJ. A pair-rule gene circuit defines segments sequentially in the short-germ insect Tribolium castaneum. Proc Natl Acad Sci USA. 2006;103:6560–6564. doi: 10.1073/pnas.0510440103. [DOI] [PMC free article] [PubMed] [Google Scholar]
- 7.El-Sherif E, Zhu X, Fu J, Brown SJ. Caudal regulates the spatiotemporal dynamics of pair-rule waves in Tribolium. PLoS Genet. 2014;10:e1004677. doi: 10.1371/journal.pgen.1004677. [DOI] [PMC free article] [PubMed] [Google Scholar]
- 8.Brena C, Akam M. An analysis of segmentation dynamics throughout embryogenesis in the centipede Strigamia maritima. BMC Biol. 2013;11:112. doi: 10.1186/1741-7007-11-112. [DOI] [PMC free article] [PubMed] [Google Scholar]
- 9.Stollewerk A, Schoppmeier M, Damen WG. Involvement of Notch and Delta genes in spider segmentation. Nature. 2003;423:863–865. doi: 10.1038/nature01682. [DOI] [PubMed] [Google Scholar]
- 10.Pueyo JI, Lanfear R, Couso JP. Ancestral Notch-mediated segmentation revealed in the cockroach Periplaneta americana. Proc Natl Acad Sci USA. 2008;105:16614–16619. doi: 10.1073/pnas.0804093105. [DOI] [PMC free article] [PubMed] [Google Scholar]
- 11.Moreno-Risueno MA, et al. Oscillating gene expression determines competence for periodic Arabidopsis root branching. Science. 2010;329:1306–1311. doi: 10.1126/science.1191937. [DOI] [PMC free article] [PubMed] [Google Scholar]
- 12.Petricka JJ, Winter CM, Benfey PN. Control of Arabidopsis root development. Annu Rev Plant Biol. 2012;63:563–590. doi: 10.1146/annurev-arplant-042811-105501. [DOI] [PMC free article] [PubMed] [Google Scholar]
- 13.Kohwi M, Doe CQ. Temporal fate specification and neural progenitor competence during development. Nat Rev Neurosci. 2013;14:823–838. doi: 10.1038/nrn3618. [DOI] [PMC free article] [PubMed] [Google Scholar]
- 14.Li X, et al. Temporal patterning of Drosophila medulla neuroblasts controls neural fates. Nature. 2013;498:456–462. doi: 10.1038/nature12319. [DOI] [PMC free article] [PubMed] [Google Scholar]
- 15.Dessaud E, et al. Interpretation of the sonic hedgehog morphogen gradient by a temporal adaptation mechanism. Nature. 2007;450:717–720. doi: 10.1038/nature06347. [DOI] [PubMed] [Google Scholar]
- 16.Cooke J, Zeeman EC. A clock and wavefront model for control of the number of repeated structures during animal morphogenesis. J Theor Biol. 1976;58:455–476. doi: 10.1016/s0022-5193(76)80131-2. [DOI] [PubMed] [Google Scholar]
- 17.Balaskas N, et al. Gene regulatory logic for reading the Sonic Hedgehog signaling gradient in the vertebrate neural tube. Cell. 2012;148:273–284. doi: 10.1016/j.cell.2011.10.047. [DOI] [PMC free article] [PubMed] [Google Scholar]
- 18.Panovska-Griffiths J, Page KM, Briscoe J. A gene regulatory motif that generates oscillatory or multiway switch outputs. J R Soc Interface. 2012;10:20120826. doi: 10.1098/rsif.2012.0826. [DOI] [PMC free article] [PubMed] [Google Scholar]
- 19.Cohen M, Page KM, Perez-Carrasco R, Barnes CP, Briscoe J. A theoretical framework for the regulation of Shh morphogen-controlled gene expression. Development. 2014;141:3868–3878. doi: 10.1242/dev.112573. [DOI] [PMC free article] [PubMed] [Google Scholar]
- 20.Davis GK, Patel NH. Short, long, and beyond: Molecular and embryological approaches to insect segmentation. Annu Rev Entomol. 2002;47:669–699. doi: 10.1146/annurev.ento.47.091201.145251. [DOI] [PubMed] [Google Scholar]
- 21.Patel NH, et al. Grasshopper hunchback expression reveals conserved and novel aspects of axis formation and segmentation. Development. 2001;128:3459–3472. doi: 10.1242/dev.128.18.3459. [DOI] [PubMed] [Google Scholar]
- 22.Schroeder MD, Greer C, Gaul U. How to make stripes: Deciphering the transition from non-periodic to periodic patterns in Drosophila segmentation. Development. 2011;138:3067–3078. doi: 10.1242/dev.062141. [DOI] [PMC free article] [PubMed] [Google Scholar]
- 23.Patel NH, Condron BG, Zinn K. Pair-rule expression patterns of even-skipped are found in both short- and long-germ beetles. Nature. 1994;367:429–434. doi: 10.1038/367429a0. [DOI] [PubMed] [Google Scholar]
- 24.Ben-David J, Chipman AD. Mutual regulatory interactions of the trunk gap genes during blastoderm patterning in the hemipteran Oncopeltus fasciatus. Dev Biol. 2010;346:140–149. doi: 10.1016/j.ydbio.2010.07.010. [DOI] [PubMed] [Google Scholar]
- 25.Xiang J, Forrest IS, Pick L. Dermestes maculatus: An intermediate-germ beetle model system for evo-devo. Evodevo. 2015;6:32. doi: 10.1186/s13227-015-0028-0. [DOI] [PMC free article] [PubMed] [Google Scholar]
- 26.Sucena É, Vanderberghe K, Zhurov V, Grbić M. Reversion of developmental mode in insects: Evolution from long germband to short germband in the polyembrionic wasp Macrocentrus cingulum Brischke. Evol Dev. 2014;16:233–246. doi: 10.1111/ede.12086. [DOI] [PubMed] [Google Scholar]
- 27.Cannavò E, et al. Shadow enhancers are pervasive features of developmental regulatory networks. Curr Biol. 2016;26:38–51. doi: 10.1016/j.cub.2015.11.034. [DOI] [PMC free article] [PubMed] [Google Scholar]
- 28.Murray JD. 2007. Mathematical Biology: I. An Introduction, Interdisciplinary Applied Mathematics (Springer, New York), 3rd Ed.
- 29.Winfree AT. 2010. The Geometry of Biological Time, Interdisciplinary Applied Mathematics (Springer, New York), 2nd Ed.
- 30.Beck MT, Váradi ZB. One, two and three-dimensional spatially periodic chemical reactions. Nature. 1972;235:15–16. [Google Scholar]
- 31.Thoenes D. Spatial oscillations in the Zhabotinskii reaction. Nature. 1973;243:18–20. [Google Scholar]
- 32.Oates AC, Morelli LG, Ares S. Patterning embryos with oscillations: Structure, function and dynamics of the vertebrate segmentation clock. Development. 2012;139:625–639. doi: 10.1242/dev.063735. [DOI] [PubMed] [Google Scholar]
- 33.Morelli LG, et al. Delayed coupling theory of vertebrate segmentation. HFSP J. 2009;3:55–66. doi: 10.2976/1.3027088. [DOI] [PMC free article] [PubMed] [Google Scholar]
- 34.François P, Siggia ED. Predicting embryonic patterning using mutual entropy fitness and in silico evolution. Development. 2010;137:2385–2395. doi: 10.1242/dev.048033. [DOI] [PubMed] [Google Scholar]
- 35.El-Sherif E, Lynch JA, Brown SJ. Comparisons of the embryonic development of Drosophila, Nasonia, and Tribolium. Wiley Interdiscip Rev Dev Biol. 2012;1:16–39. doi: 10.1002/wdev.3. [DOI] [PMC free article] [PubMed] [Google Scholar]
- 36.Nakao H. Analyses of interactions among pair-rule genes and the gap gene Krüppel in Bombyx segmentation. Dev Biol. 2015;405:149–157. doi: 10.1016/j.ydbio.2015.06.012. [DOI] [PubMed] [Google Scholar]
- 37.Wolff C, Schröder R, Schulz C, Tautz D, Klingler M. Regulation of the Tribolium homologues of caudal and hunchback in Drosophila: Evidence for maternal gradient systems in a short germ embryo. Development. 1998;125:3645–3654. doi: 10.1242/dev.125.18.3645. [DOI] [PubMed] [Google Scholar]
- 38.Marques-Souza H, Aranda M, Tautz D. Delimiting the conserved features of hunchback function for the trunk organization of insects. Development. 2008;135:881–888. doi: 10.1242/dev.018317. [DOI] [PubMed] [Google Scholar]
- 39.Cerny AC, Bucher G, Schröder R, Klingler M. Breakdown of abdominal patterning in the Tribolium Kruppel mutant jaws. Development. 2005;132:5353–5363. doi: 10.1242/dev.02154. [DOI] [PubMed] [Google Scholar]
- 40.Savard J, Marques-Souza H, Aranda M, Tautz D. A segmentation gene in Tribolium produces a polycistronic mRNA that codes for multiple conserved peptides. Cell. 2006;126:559–569. doi: 10.1016/j.cell.2006.05.053. [DOI] [PubMed] [Google Scholar]
- 41.Bucher G, Klingler M. Divergent segmentation mechanism in the short germ insect Tribolium revealed by giant expression and function. Development. 2004;131:1729–1740. doi: 10.1242/dev.01073. [DOI] [PubMed] [Google Scholar]
- 42.Copf T, Schröder R, Averof M. Ancestral role of caudal genes in axis elongation and segmentation. Proc Natl Acad Sci USA. 2004;101:17711–17715. doi: 10.1073/pnas.0407327102. [DOI] [PMC free article] [PubMed] [Google Scholar]
- 43.Marlétaz F, Maeso I, Faas L, Isaacs HV, Holland PW. Cdx ParaHox genes acquired distinct developmental roles after gene duplication in vertebrate evolution. BMC Biol. 2015;13:56. doi: 10.1186/s12915-015-0165-x. [DOI] [PMC free article] [PubMed] [Google Scholar]
- 44.Le Gouar M, Lartillot N, Adoutte A, Vervoort M. The expression of a caudal homologue in a mollusc, Patella vulgata. Gene Expr Patterns. 2003;3:35–37. doi: 10.1016/s1567-133x(02)00091-1. [DOI] [PubMed] [Google Scholar]
- 45.Bolognesi R, Farzana L, Fischer TD, Brown SJ. Multiple Wnt genes are required for segmentation in the short-germ embryo of Tribolium castaneum. Curr Biol. 2008;18:1624–1629. doi: 10.1016/j.cub.2008.09.057. [DOI] [PMC free article] [PubMed] [Google Scholar]
- 46.Bolognesi R, et al. Tribolium Wnts: Evidence for a larger repertoire in insects with overlapping expression patterns that suggest multiple redundant functions in embryogenesis. Dev Genes Evol. 2008;218:193–202. doi: 10.1007/s00427-007-0170-3. [DOI] [PMC free article] [PubMed] [Google Scholar]
- 47.Fu J, et al. Asymmetrically expressed axin required for anterior development in Tribolium. Proc Natl Acad Sci USA. 2012;109:7782–7786. doi: 10.1073/pnas.1116641109. [DOI] [PMC free article] [PubMed] [Google Scholar]
- 48.Tufcea DE, François P. Critical timing without a timer for embryonic development. Biophys J. 2015;109:1724–1734. doi: 10.1016/j.bpj.2015.08.024. [DOI] [PMC free article] [PubMed] [Google Scholar]
- 49.Kraut R, Levine M. Mutually repressive interactions between the gap genes giant and Krüppel define middle body regions of the Drosophila embryo. Development. 1991;111:611–621. doi: 10.1242/dev.111.2.611. [DOI] [PubMed] [Google Scholar]
- 50.Marques-Souza H. 2007. Evolution of the gene regulatory network controlling trunk segmentation in insects. Doctoral dissertation (Univ Cologne, Cologne, Germany)
- 51.El-Sherif E, Levine M. Shadow enhancers mediate dynamic shifts of gap gene expression in the Drosophila embryo. Curr Biol. 2016;26:1164–1169. doi: 10.1016/j.cub.2016.02.054. [DOI] [PMC free article] [PubMed] [Google Scholar]
- 52.Hoermann A, Cicin-Sain D, Jaeger J. A quantitative validated model reveals two phases of transcriptional regulation for the gap gene giant in Drosophila. Dev Biol. 2016;411:325–338. doi: 10.1016/j.ydbio.2016.01.005. [DOI] [PubMed] [Google Scholar]
- 53.Clark E, Akam M. Odd-paired controls frequency doubling in Drosophila segmentation by altering the pair-rule gene regulatory network. Elife. 2016;5:e18215. doi: 10.7554/eLife.18215. [DOI] [PMC free article] [PubMed] [Google Scholar]
- 54.Clark E. 2017. Dynamic patterning by the Drosophila pair-rule network reconciles long-germ and short-germ segmentation. bioRxiv:10.1101/099671.
- 55.Hejnowicz Z, Wohlfarth-Bottermann KE. Propagated waves induced by gradients of physiological factors within plasmodia of Physarum polycephalum. Planta. 1980;150:144–152. doi: 10.1007/BF00582358. [DOI] [PubMed] [Google Scholar]
- 56.Harfe BD, et al. Evidence for an expansion-based temporal Shh gradient in specifying vertebrate digit identities. Cell. 2004;118:517–528. doi: 10.1016/j.cell.2004.07.024. [DOI] [PubMed] [Google Scholar]
- 57.Zeller R. It takes time to make a pinky: Unexpected insights into how SHH patterns vertebrate digits. Sci STKE. 2004;2004:pe53. doi: 10.1126/stke.2592004pe53. [DOI] [PubMed] [Google Scholar]
- 58.Briscoe J, Small S. Morphogen rules: Design principles of gradient-mediated embryo patterning. Development. 2015;142:3996–4009. doi: 10.1242/dev.129452. [DOI] [PMC free article] [PubMed] [Google Scholar]
- 59.Lauschke VM, Tsiairis CD, François P, Aulehla A. Scaling of embryonic patterning based on phase-gradient encoding. Nature. 2013;493:101–105. doi: 10.1038/nature11804. [DOI] [PubMed] [Google Scholar]
- 60.Goto T, Macdonald P, Maniatis T. Early and late periodic patterns of even skipped expression are controlled by distinct regulatory elements that respond to different spatial cues. Cell. 1989;57:413–422. doi: 10.1016/0092-8674(89)90916-1. [DOI] [PubMed] [Google Scholar]
- 61.Perry MW, Boettiger AN, Bothma JP, Levine M. Shadow enhancers foster robustness of Drosophila gastrulation. Curr Biol. 2010;20:1562–1567. doi: 10.1016/j.cub.2010.07.043. [DOI] [PMC free article] [PubMed] [Google Scholar]
- 62.Wunderlich Z, et al. Krüppel expression levels are maintained through compensatory evolution of shadow enhancers. Cell Rep. 2015;12:1740–1747. doi: 10.1016/j.celrep.2015.08.021. [DOI] [PMC free article] [PubMed] [Google Scholar]
- 63.Benton MA, Kenny NJ, Conrads KH, Roth S, Lynch JA. Deep, staged transcriptomic resources for the novel coleopteran models Atrachya menetriesi and Callosobruchus maculatus. PLoS One. 2016;11:e0167431. doi: 10.1371/journal.pone.0167431. [DOI] [PMC free article] [PubMed] [Google Scholar]
- 64.Pires CV, Freitas FC, Cristino AS, Dearden PK, Simões ZL. Transcriptome analysis of honeybee (Apis Mellifera) haploid and diploid embryos reveals early zygotic transcription during cleavage. PLoS One. 2016;11:e0146447. doi: 10.1371/journal.pone.0146447. [DOI] [PMC free article] [PubMed] [Google Scholar]
- 65.Olesnicky EC, et al. A caudal mRNA gradient controls posterior development in the wasp Nasonia. Development. 2006;133:3973–3982. doi: 10.1242/dev.02576. [DOI] [PubMed] [Google Scholar]
- 66. Manu, et al. (2009) Canalization of gene expression and domain shifts in the Drosophila blastoderm by dynamical attractors. PLOS Comput Biol 5:e1000303. [DOI] [PMC free article] [PubMed]
- 67.Wilson MJ, Havler M, Dearden PK. Giant, Krüppel, and caudal act as gap genes with extensive roles in patterning the honeybee embryo. Dev Biol. 2010;339:200–211. doi: 10.1016/j.ydbio.2009.12.015. [DOI] [PubMed] [Google Scholar]
- 68.Jaeger J, et al. Dynamic control of positional information in the early Drosophila embryo. Nature. 2004;430:368–371. doi: 10.1038/nature02678. [DOI] [PubMed] [Google Scholar]
- 69.Keränen SV, et al. Three-dimensional morphology and gene expression in the Drosophila blastoderm at cellular resolution II: Dynamics. Genome Biol. 2006;7:R124. doi: 10.1186/gb-2006-7-12-r124. [DOI] [PMC free article] [PubMed] [Google Scholar]
- 70.Verd B, Crombach A, Jaeger J. Dynamic maternal gradients control timing and shift-rates for Drosophila gap gene expression. PLOS Comput Biol. 2017;13:e1005285. doi: 10.1371/journal.pcbi.1005285. [DOI] [PMC free article] [PubMed] [Google Scholar]
- 71.Verd B, et al. 2016. A damped oscillator imposes temporal order on posterior gap gene expression in Drosophila. bioRxiv:10.1101/068072.
- 72.Rosenberg MI, Brent AE, Payre F, Desplan C. Dual mode of embryonic development is highlighted by expression and function of Nasonia pair-rule genes. Elife. 2014;3:e01440. doi: 10.7554/eLife.01440. [DOI] [PMC free article] [PubMed] [Google Scholar]
Associated Data
This section collects any data citations, data availability statements, or supplementary materials included in this article.


