Significance
Mycobacterium tuberculosis (Mtb), the causative agent of the disease tuberculosis, grows in macrophages, cells that normally kill bacteria. Recent work has defined a macrophage pathway called “LC3-associated phagocytosis” (LAP) that can eliminate other microbes. LAP is characterized by the recruitment of NADPH oxidase to phagosomes, followed by phagosomal association with LC3 and delivery of the bacteria to a degradative lysosome. Here, we show that LAP does not effectively clear Mtb. The ability of Mtb to inhibit LAP and therefore cause disease depends upon CpsA, a member of the LytR-CpsA-Psr (LCP) protein family, which has previously been implicated in cell-wall metabolism. We demonstrate that Mtb CpsA plays an unexpected role in antagonizing host innate immunity by inhibiting NADPH oxidase and LAP.
Keywords: M. tuberculosis, autophagy, LC3-associated phagocytosis, NADPH oxidase, LytR-CpsA-Psr
Abstract
Mycobacterium tuberculosis’ success as a pathogen comes from its ability to evade degradation by macrophages. Normally macrophages clear microorganisms that activate pathogen-recognition receptors (PRRs) through a lysosomal-trafficking pathway called “LC3-associated phagocytosis” (LAP). Although M. tuberculosis activates numerous PRRs, for reasons that are poorly understood LAP does not substantially contribute to M. tuberculosis control. LAP depends upon reactive oxygen species (ROS) generated by NADPH oxidase, but M. tuberculosis fails to generate a robust oxidative response. Here, we show that CpsA, a LytR-CpsA-Psr (LCP) domain-containing protein, is required for M. tuberculosis to evade killing by NADPH oxidase and LAP. Unlike phagosomes containing wild-type bacilli, phagosomes containing the ΔcpsA mutant recruited NADPH oxidase, produced ROS, associated with LC3, and matured into antibacterial lysosomes. Moreover, CpsA was sufficient to impair NADPH oxidase recruitment to fungal particles that are normally cleared by LAP. Intracellular survival of the ΔcpsA mutant was largely restored in macrophages missing LAP components (Nox2, Rubicon, Beclin, Atg5, Atg7, or Atg16L1) but not in macrophages defective in a related, canonical autophagy pathway (Atg14, Ulk1, or cGAS). The ΔcpsA mutant was highly impaired in vivo, and its growth was partially restored in mice deficient in NADPH oxidase, Atg5, or Atg7, demonstrating that CpsA makes a significant contribution to the resistance of M. tuberculosis to NADPH oxidase and LC3 trafficking in vivo. Overall, our findings reveal an essential role of CpsA in innate immune evasion and suggest that LCP proteins have functions beyond their previously known role in cell-wall metabolism.
The pathogen Mycobacterium tuberculosis (Mtb) causes one of the world’s deadliest infections. Mtb survives within macrophages by preventing its own delivery to the degradative, phagolysosomal compartment (1). Recent work distinguished two related phagolysosomal pathways that are characterized by the association of LC3 with the phagosomal membrane, macroautophagy (hereafter autophagy) and LC3-associated phagocytosis (LAP) (2–5). Autophagy involves the capture of cytoplasmic components by a double-membrane compartment called the “autophagosome.” When this process sequesters microorganisms, it is called “xenophagy.” In both xenophagy and LAP, LC3-decorated organelles fuse with lysosomes, resulting in bacterial degradation. However, neither pathway is effective against Mtb. Only a small fraction of Mtb colocalizes with LC3, and autophagy-related (Atg) proteins that are required for both LAP and xenophagy make only a modest contribution toward Mtb control (6–13), suggesting that Mtb is able to circumvent both processes. A number of host and bacterial factors contribute to Mtb’s ability to evade autophagy (14–17). How Mtb inhibits LAP is unclear.
LAP is initiated by bacterial binding to pathogen-recognition receptors (PRRs) (Fig. S1). LAP requires NADPH oxidase and the class III phosphatidylinositol 3-kinase complex, which generate reactive oxygen species (ROS) and phosphatidylinositol 3-phosphate [PI(3)P], respectively, at the incipient phagosome (2, 3, 5). ROS directly kill bacteria and, along with PI(3)P, recruit the Atg conjugation systems that deposit LC3 on the phagosomal membrane. Mtb activates numerous PRRs, so it is surprising that Mtb does not robustly trigger LAP. This incongruity suggests that Mtb has a LAP evasion strategy.
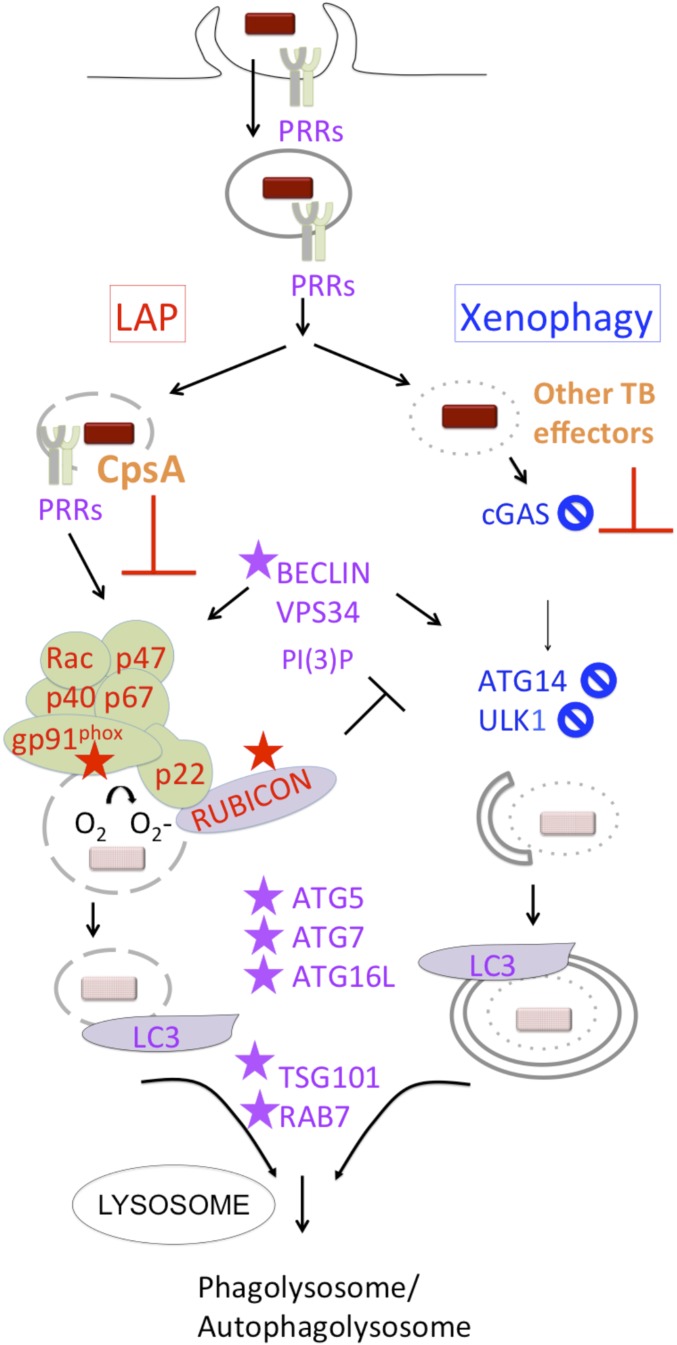
Fig. S1.
LAP and xenophagy pathways. LAP and xenophagy deliver bacteria to lysosomal compartments. Both require PI(3)P production and common machinery to recruit LC3 and promote lysosomal fusion, but they also have distinct requirements. PI(3)P and ROS from NADPH oxidase are required for LAP, which uses ATG conjugation systems to generate a single-membrane LC3+ compartment and culminates in phagolysosomal fusion. RUBICON is part of the PI(3)P kinase (VPS34) complex and stabilizes NADPH oxidase. It inhibits autophagy and is required for LAP. Proteins discussed in the text that are LAP-specific are shown in red, xenophagy-specific proteins are shown in blue, and proteins utilized by both are in purple. The proteins required for clearance of the ΔcpsA mutant are indicated by a star. A circle with a diagonal slash indicates proteins for which gene deletion or silencing did not restore growth of the ΔcpsA mutant. Our data suggest that CpsA interferes with NADPH oxidase recruitment and LAP trafficking. Other Mtb effectors that are not shown inhibit xenophagy and lysosome fusion.
Here, we show that an exported Mtb protein, CpsA (Rv3484), prevents clearance of Mtb by NADPH oxidase and LAP. CpsA contains two domains: a LytR-CpsA-Psr (LCP) domain, which is found widely in Gram-positive bacteria, and a LytR domain, which has an unknown function. LCP domains can transfer cell-wall teichoic acids from their lipid-bound precursors to peptidoglycan (PGN) (18–20). Although mycobacteria do not have teichoic acid, arabinogalactan (AG) is linked to PGN in an analogous manner. Mtb has three proteins with LCP and LytR domains: Rv3267/Lcp1/CpsA1, Rv3484/CpsA/CpsA2, and Rv0822c. Rv3267 is highly conserved in mycobacteria and is the main ligase responsible for catalyzing the transfer of AG to PGN (21, 22). CpsA shares 36% sequence identity with Rv3267; however, unlike Rv3267, CpsA is not conserved in rapidly growing, nonpathogenic mycobacteria (23), and the ΔcpsA mutant does not exhibit significant cell-wall defects (21). Here, we demonstrate that Mtb CpsA plays an unexpected role in antagonizing host innate immunity by inhibiting NADPH oxidase and LAP. Our findings provide an explanation for the limited oxidative burst seen in response to Mtb and establish a role for CpsA in inhibiting innate immune clearance of Mtb.
Results
CpsA Protects Mtb from Lysosomal Clearance.
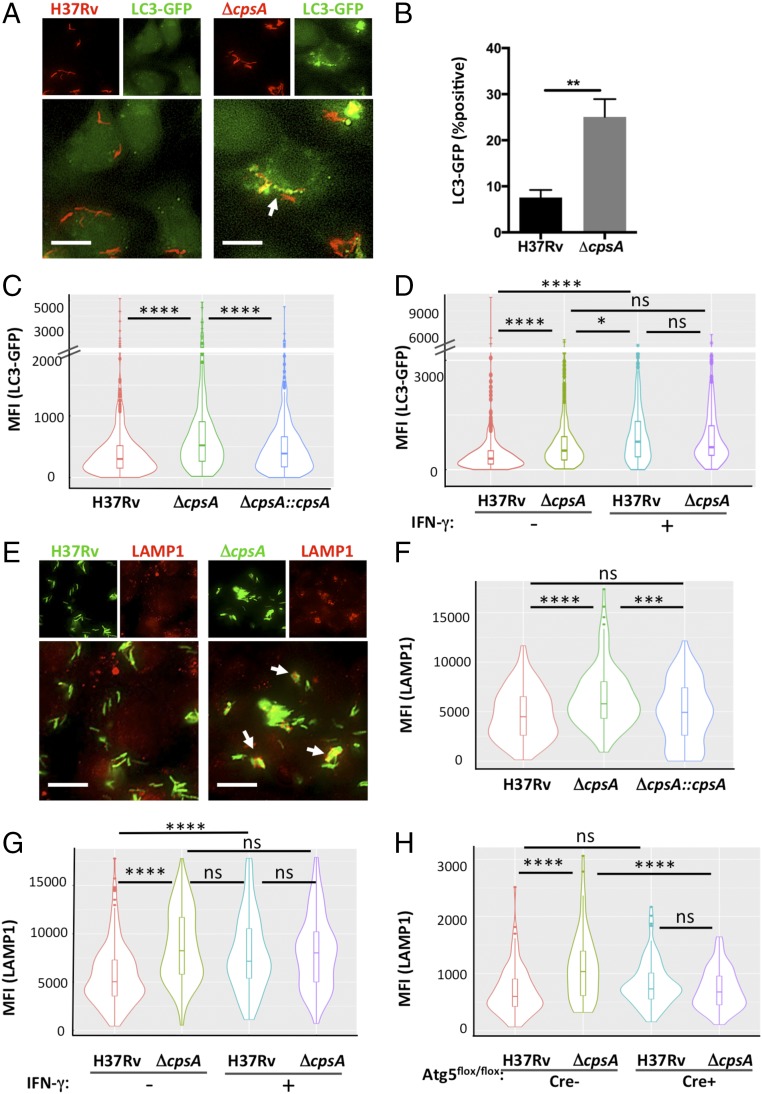
Previously, we screened secreted Mtb proteins for interactions with human proteins using a high-throughput yeast two-hybrid assay (24). CpsA was included in this screen because it had a predicted signal peptide, and it had been found in culture filtrate in mass spectrometry studies (25–27). We found that CpsA interacts with T-cell leukemia virus type I binding protein 1 (TAX1BP1) and nuclear dot protein 52 kDa (NDP52), two paralogs involved in xenophagy (13, 28, 29). This prompted us to delete cpsA from the WT H37Rv strain of Mtb to characterize its effect on autophagy (Fig. S2). When we infected LC3-GFP–expressing murine bone marrow-derived macrophages (BMDMs), we found that the ΔcpsA mutant was three times more likely to be in an LC3-GFP+ compartment than the WT strain at 4 h postinfection (hpi) (Fig. 1 A and B). We quantified the mean fluorescence intensity (MFI) around individual phagosomes using automated image analysis, as previously described in detail (24). We found a significant shift in ΔcpsA mutant phagosomes to brighter GFP populations compared with WT Mtb phagosomes (Fig. 1C), which closely approximated our visual scoring. The enhanced colocalization of the mutant with LC3-GFP was restored to WT levels in the complemented strain (ΔcpsA::cpsA) (Fig. 1C). As shown previously, activating macrophages with IFN-γ before infection enhanced LC3 association with WT Mtb (Fig. 1D) (7, 11, 30, 31). In contrast to the marked enhancement of LC3 association with the ΔcpsA mutant in unactivated macrophages, there was little difference between WT and ΔcpsA in IFN-γ–activated macrophages (Fig. 1D). Thus, CpsA inhibited LC3-associated trafficking specifically in unactivated macrophages.
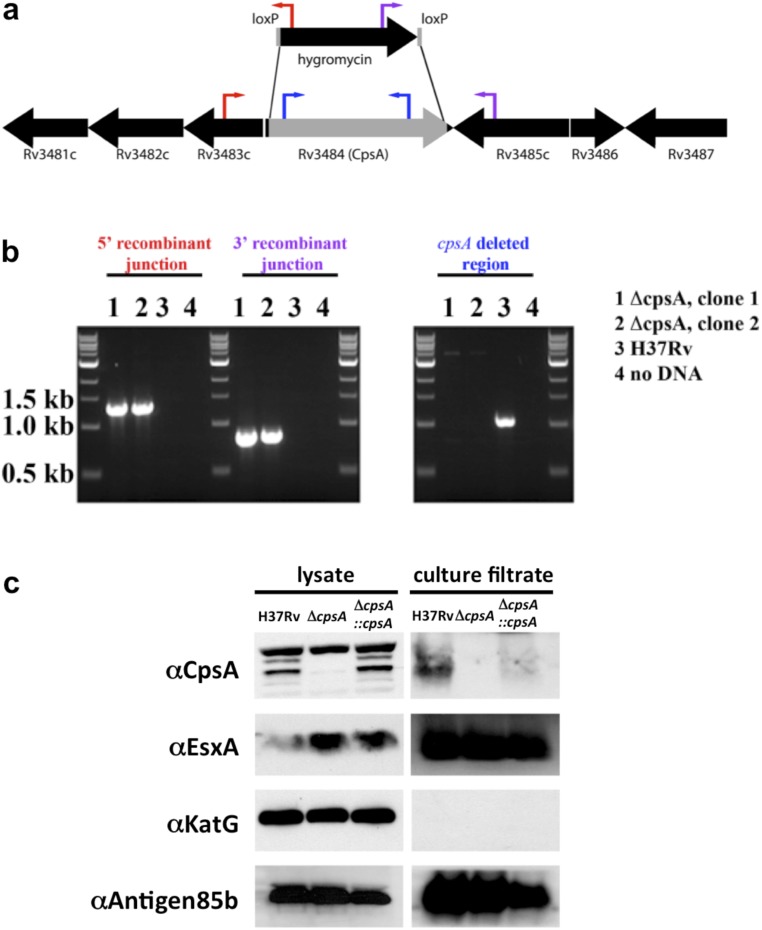
Fig. S2.
Deletion of cpsA in Mtb. (A) Genomic organization of the cpsA (Rv3484) region. Genes are depicted as black arrows, and the gene fragment replaced by a hygromycin-resistance cassette is shown in gray. The red, purple, and blue arrows indicate the location of oligonucleotide binding used to confirm the deletion. (B) PCR of genomic DNA demonstrated the deletion of cpsA from ΔcpsA strains (lanes 1 and 2) but not from WT Mtb (lane 3). Amplification resulted in products of 1.3 kb from the 5′ junction with the hygromycin-resistance cassette (indicated by red oligonucleotides) and 0.8 kb from the 3′ junction (indicated by purple oligonucleotides) in the cpsA-deletion strains, while in both cases no DNA amplification product was found from H37Rv. PCR using oligonucleotides that bind within cpsA (in blue) resulted in a product only for H37Rv. (C) Cell lysate and culture filtrate of H37Rv, ΔcpsA, and ΔcpsA::cpsA were examined by Western blotting using antibodies against CpsA, EsxA, KatG, and Antigen 85b.
Fig. 1.
CpsA inhibits LC3-associated lysosomal trafficking. (A) Fluorescence imaging of DsRed-expressing H37Rv or ΔcpsA (red) 4 hpi in murine BMDMs expressing GFP-LC3 (green). (B) The percentage of bacteria in an LC3-GFP+ phagosome at 4 hpi was quantified by a blinded observer from over 500 bacteria in two independent experiments. **P = 0.0017, Student’s t test. (C) Automated image analysis was used to quantify the GFP MFI colocalized with over 250 bacilli, as shown in violin plots (described below). (D) Phagosomal LC3-GFP was quantified 4 hpi from BMDMs pretreated with IFN-γ or vehicle control before infection. (E) Immunofluorescence (IF) microscopy of LAMP1- (red) and GFP-expressing H37Rv or ΔcpsA (green) 4 hpi in BMDMs. (F and G) Phagosomal LAMP1 MFI in BMDMs pretreated with IFN-γ or vehicle control before infection was quantified at 4 hpi (F) and 24 hpi (G) from at least 100 bacilli. (H) Phagosomal LAMP1 MFI was quantified 4 hpi from Atg5-KO BMDMs (Atg5flox/flox LysM-Cre+) and controls (Atg5flox/flox LysM-Cre−) from at least 70 bacilli per sample. In A and E, arrows indicate bacilli that colocalize with the cellular marker. (Scale bars, 10 μm.) In C, D, and F–H, no contrast adjustment was performed before automated image analysis. The violin plots show the distribution of the data (the MFI of the indicated cellular marker associated with distinct intracellular bacteria) as its probability density. Within the violin plot, the box and whiskers plot indicates the median (horizontal line) and interquartile range (IQR) (boxes). The upper whisker extends to 1.5 × IQR from the top of the top box, and the lower whisker extends from the lower box by 1.5 × IQR IQR. Any data beyond the end of the whiskers are outlying points that are plotted individually. Data show one representative experiment from at least two independent experiments. *P ≤ 0.05; ***P ≤ 0.0005; ****P ≤ 0.0001; ns, not significant; one-way ANOVA with Tukey’s multiple comparisons test.
To determine whether enhanced LC3 trafficking resulted in increased lysosomal delivery, we quantified the colocalization of the ΔcpsA mutant with lysosomal-associated membrane protein 1 (LAMP1), a late endosomal and lysosomal marker. We found that LAMP1 colocalized with the ΔcpsA mutant significantly more than it did with WT Mtb at 4 hpi, similar to what was seen when macrophages were pretreated with IFN-γ, which promotes lysosomal trafficking (Fig. 1 E–G). LAMP1 colocalization was restored to WT levels in the complemented strain (Fig. 1F). There was no increased association of LAMP1 with the ΔcpsA mutant relative to WT Mtb in IFN-γ–activated macrophages, again suggesting that the altered trafficking was predominantly seen in unactivated macrophages (Fig. 1G). To determine whether the increased phagolysosomal trafficking depended upon autophagy proteins, we examined LAMP1 colocalization with Mtb in macrophages genetically lacking Atg5, which is required for both xenophagy and LAP (Fig. S1). In such macrophages, the enhanced association of LAMP1 with the ΔcpsA mutant was abrogated (Fig. 1H).
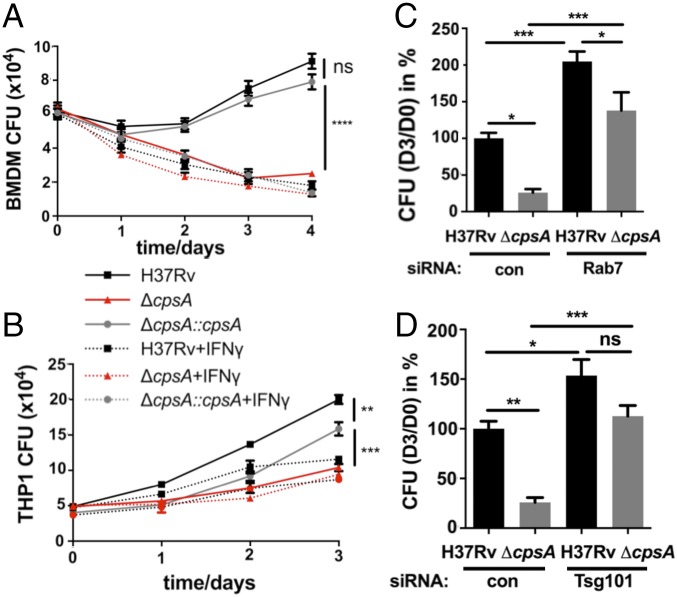
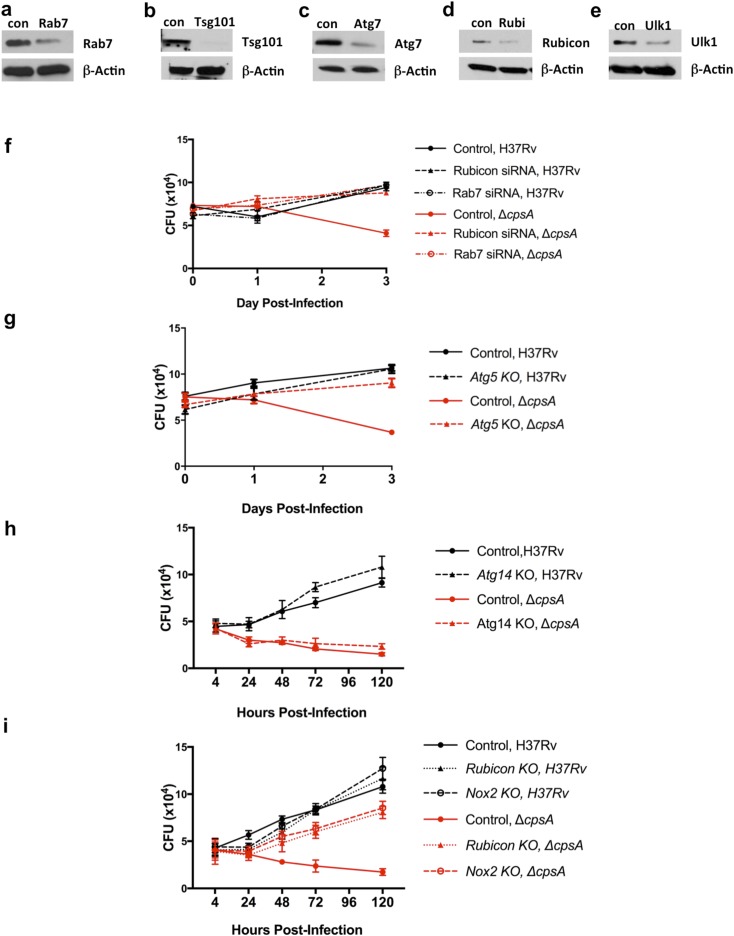
Next, we examined whether the failure of the ΔcpsA mutant to arrest lysosomal trafficking impaired its intracellular survival. We found that the ΔcpsA mutant, which grew normally in liquid medium (Fig. S3A), was killed by murine BMDMs, whereas WT Mtb and the complemented strain survived (Fig. 2A). IFN-γ–naive BMDMs cleared the ΔcpsA mutant to a similar degree as IFN-γ–activated macrophages controlled WT Mtb. We had similar findings in human THP-1 macrophages (Fig. 2B). To evaluate whether ΔcpsA was killed as a consequence of lysosomal trafficking, we used previously validated siRNA pools to deplete Ras-related protein Rab-7a (RAB7) or tumor-susceptibility gene 101 (TSG101), which are required for phagosome maturation (Fig. S4) (24, 32, 33). Silencing Rab7 or Tsg101 before infection partially restored the intracellular survival of ΔcpsA (Fig. 2 C and D and Fig. S4). Combined, these results suggested that CpsA protects Mtb from killing by an LC3-associated lysosomal-trafficking pathway.
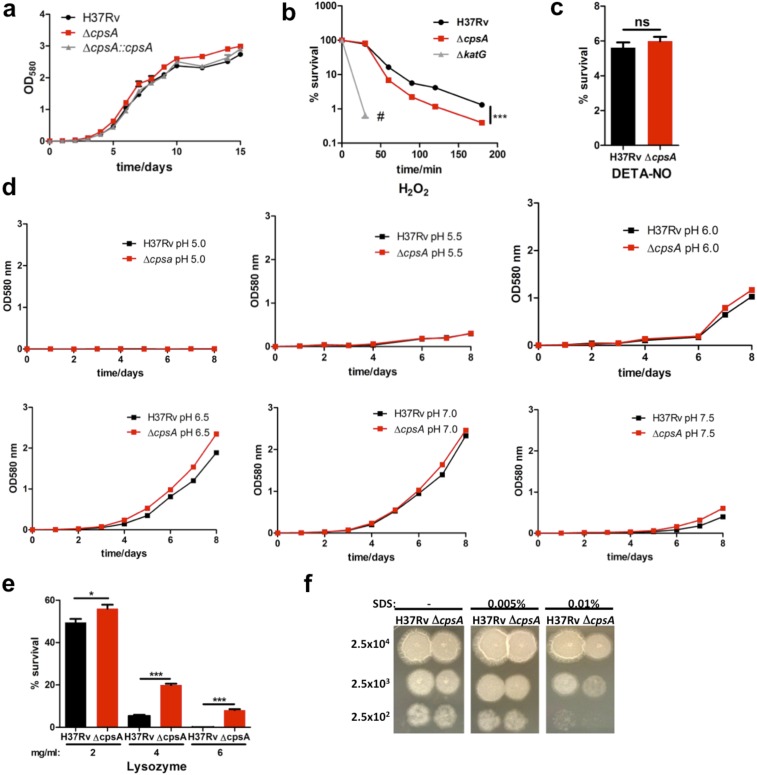
Fig. S3.
Survival of ΔcpsA under in vitro stress conditions. (A) Growth curve of H37Rv, ΔcpsA, and ΔcpsA::cpsA grown in 7H9 medium. (B) Survival of H37Rv, ΔcpsA, and ΔkatG in the presence of 5 mM H2O2. Samples were plated after 30, 60, 90, 120, and 180 min. No colonies were observed for ΔkatG after 30 min (#). ***P = 0.0005. (C) Survival of H37Rv and ΔcpsA after the addition of 200 μM diethylenetriamine/nitric oxide (DETA-NO) every 24 h for 3 d. ns, not significant; Student’s t test. (D) In vitro growth curves of H37Rv and ΔcpsA in 7H9 medium under different pHs (range 5.0–7.5). Data are representative of two experiments. (E) Sensitivity of H37Rv or ΔcpsA in the presence of lysozyme. The indicated concentration of lysozyme was added to 7H11 plates. Data are representative of two independent experiments. *P ≤ 0.05, ***P ≤ 0.0005; Student’s t test. (F) Sensitivity of H37Rv and ΔcpsA to SDS. The indicated bacterial numbers were spotted on 7H11 agar plates with SDS (0.005%, 0.01%) or without SDS. Pictures were taken 15 d after spotting. Data represent the results of three independent experiments.
Fig. 2.
Mtb require CpsA to survive in macrophages. (A and B) Survival of H37Rv, ΔcpsA, and ΔcpsA::cpsA in BMDMs (A) and human THP-1 cells (B) that were pretreated with either IFN-γ or vehicle. Data show the mean ± SEM of one representative experiment from at least two independent experiments. In some cases the error bar is shorter than the height of the symbol. **P ≤ 0.01, ***P ≤ 0.001, ****P ≤ 0.0001, ns, not significant, one-way ANOVA with Tukey’s multiple comparisons test of H37Rv, ΔcpsA, and ΔcpsA::cpsA at the last time point. (C and D) Survival of H37Rv and ΔcpsA in BMDMs treated with siRNA control (con) or siRNA-targeting Rab7 (C) or Tsg101 (D) for 2 d before infection. The ratios of cfu 3 d after infection relative to day 0 were normalized to the H37Rv control samples. Data show the mean + SEM from one representative experiment with at least three replicates from at least two independent experiments; *P ≤ 0.05; **P ≤ 0.01; ***P ≤ 0.0005; ns, not significant; one-way ANOVA with Tukey’s multiple comparisons test.
Fig. S4.
Intracellular growth of ΔcpsA in mutant macrophages. (A–E) BMDMs were treated for 2 d with siRNAs to silence Rab7 (A), Tsg101 (B), Atg7 (C), Rubicon (D), or Ulk1 (E), and subsequently cell lysates were examined by Western blotting. Actin served as a loading control. (F) Survival of H37Rv and ΔcpsA in BMDMs treated with control siRNA or siRNA targeting Rab7 and Rubicon for 2 d before infection. (G) Survival of H37Rv and ΔcpsA in Atg5-KO (Atg5flox/flox LysM-Cre+) and control (Atg5flox/flox Cre−) BMDMs. (H) Survival of H37Rv and ΔcpsA in Atg14-KO (Atg14flox/flox LysM-Cre+) and control (Atg14flox/flox Cre−) BMDMs. (I) Survival of H37Rv and ΔcpsA in Nox2−/−, Rubicon−/−, and control (C57BL/6) BMDMs. Data show the mean ± SEM from one representative experiment with at least three replicates. In some cases, the error bar is shorter than the height of the symbol.
CpsA Protects Mtb from LAP.
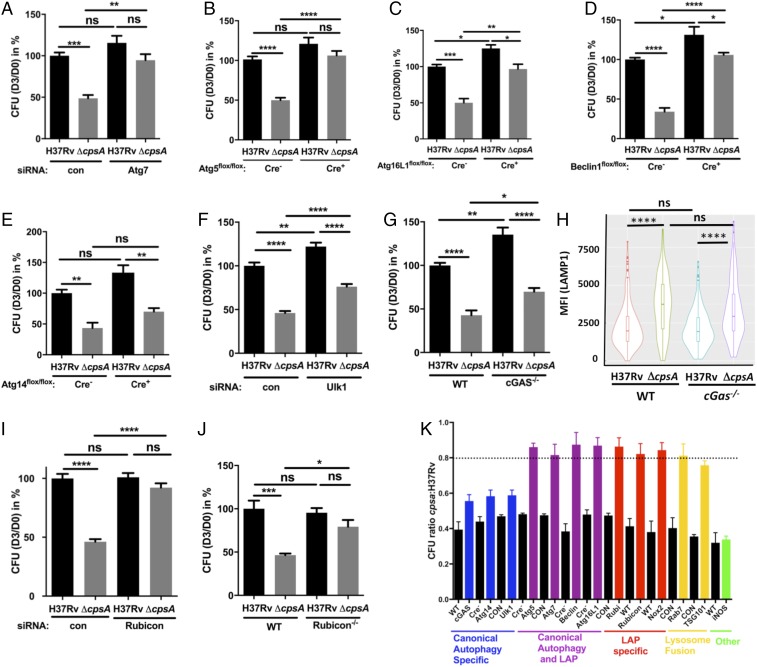
Both xenophagy and LAP depend upon a common set of factors to deliver LC3 to the phagosomal membrane, including BECLIN1, ATG7, ATG5, and ATG16L1 (Fig. S1). To determine whether these shared factors were important in clearing the ΔcpsA mutant, we examined macrophages in which we silenced Atg7 or that were genetically lacking Atg5, Atg16L1, or Beclin1 for their ability to kill the ΔcpsA mutant. In all cases, macrophages defective in these core autophagy proteins were impaired in clearing the ΔcpsA mutant relative to WT macrophages (Fig. 3 A–D and Fig. S4). These results are consistent with the idea that CpsA protects Mtb from killing by an LC3-associated lysosomal-trafficking pathway, but they do not distinguish whether that pathway is LAP or xenophagy. Recent studies have defined distinct genetic requirements for xenophagy and LAP (4). Xenophagy requires the autophagy initiation machinery (ULK1, ATG14, and others), which is dispensable for LAP, whereas LAP requires the NADPH oxidase and RUBICON (Fig. S1). When we examined Ulk1-silenced and Atg14-deficient macrophages, we observed a large discrepancy between WT Mtb and ΔcpsA survival (Fig. 3 E and F and Fig. S4). In addition, Mtb xenophagy depends upon the cGMP-AMP synthetase (cGAS) (12, 34–36). As we found with macrophages defective in the xenophagy-specific components ULK1 and ATG14, the intracellular growth defect of the ΔcpsA mutant was not rescued in macrophages lacking cGAS (Cgas−/−) (Fig. 3G). In addition, whereas Atg5 deficiency reversed the enhanced association of LAMP1 with the ΔcpsA mutant, the absence of Cgas did not (Figs. 1H and 3H). Moreover, when we examined the transcriptional response of macrophages infected with WT or ΔcpsA, there was no difference in the magnitude of the transcriptional response activated by cGAS (called the “cytosolic-surveillance pathway”) (Fig. S5). These data suggested that xenophagy and the cGAS-dependent pathway previously characterized during Mtb infection were not responsible for clearing the ΔcpsA mutant.
Fig. 3.
CpsA-deficient Mtb are cleared by LC3-associated phagocytosis. (A, F, and I) Survival of H37Rv and ΔcpsA in BMDMs treated with siRNA control (con) or siRNA targeting Atg7 (A), Ulk1 (F), or Rubicon (I) for 2 d before infection. (B–E, G, and J) Survival of H37Rv and ΔcpsA in Atg5-KO (Atg5flox/flox-LysM-Cre+) and control (Atg5flox/flox-LysM-Cre−) (B), Atg16L1-KO (Atg16L1flox/flox-LysM-Cre+) and control (Atg16L1flox/flox-LysM-Cre−) (C), Beclin-KO (Beclin1flox/flox-LysM-Cre+) and control (Beclin1flox/flox-LysM-Cre−) (D), Atg14-KO (Atg14flox/flox-LysM-Cre+) and control (Atg14flox/flox-LysM-Cre−) (E), WT (C57BL/6) and Cgas−/− (G), and WT and Rubicon−/− BMDMs (J). (H) Phagosomal LAMP1 quantified 4 hpi in WT or Cgas−/− BMDMs from at least 175 bacilli is shown in a violin plot (as described in the legend of Fig. 1). (K) The cfu ratios of ΔcpsA and H37Rv based on data from A–G, I, and J and Figs. 2 C and D and 4A. Control BMDMs [WT, Cre−, or control-transfected (CON)] are shown in black. Loss-of-function experimental samples are colored according to their biological function as indicated. The dashed line indicates 80% restoration of intracellular growth. In A–G, I, and J the ratios of cfu 3 d after infection relative to day 0 were normalized to the H37Rv control samples. Data show the mean + SEM from one representative experiment with at least three replicates from at least two independent experiments; *P ≤ 0.05; **P ≤ 0.01; ***P ≤ 0.0005; ****P ≤ 0.0001; ns, not significant; one-way ANOVA with Tukey’s multiple comparisons test. Representative data before normalization are shown in Fig. S4.
Fig. S5.
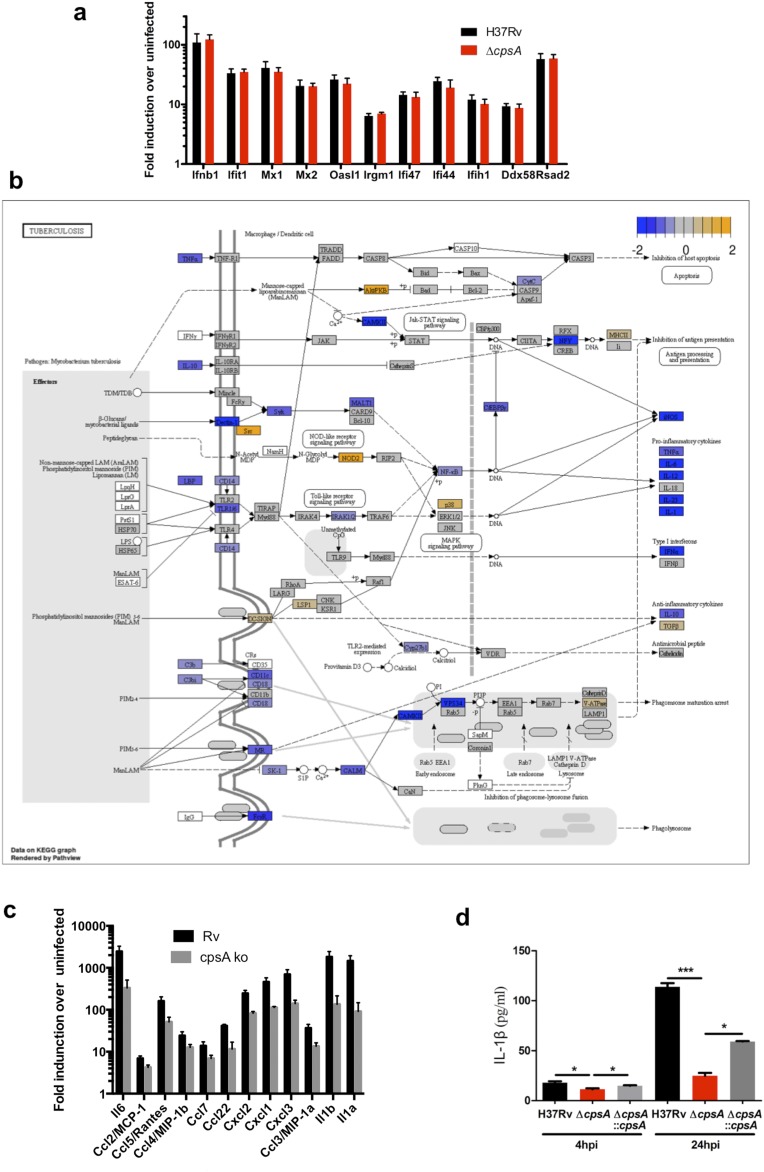
Macrophage response to ΔcpsA. (A) Transcriptional RNA-seq response of BMDMs infected with H37Rv or ΔcpsA for 4 h compared with uninfected macrophages. The expression levels of genes of the cytosolic access signature are shown. Data (mean ± SEM) are from three independent experiments. (B) KEGG pathway analysis revealed a significant difference (FDR <0.05) in the expression profile of macrophages infected with H37Rv compared with ΔcpsA. Genes are colored based upon their observed fold-changes from Limma-Voom. Genes with lower expression in ΔcpsA relative to H37Rv are shown in blue, and genes with higher expression in ΔcpsA relative to H37Rv are shown in orange. (C) Selected NF-κB–responsive genes are shown. Data show the mean ± SEM fold induction relative to uninfected controls. (D) Consistent with the transcriptional profiling, macrophages infected with the ΔcpsA mutant produce less IL-1β than WT-infected macrophages, as assayed by ELISA. *P ≤ 0.05, ***P ≤ 0.001; Student’s t test.
One distinction between xenophagy and LAP is the role of RUBICON, which inhibits autophagy and is required for LAP (4, 37, 38). In macrophages in which Rubicon was genetically absent or silenced, the attenuation of ΔcpsA was nearly completely rescued (Fig. 3 I and J and Fig. S4), consistent with the idea that ΔcpsA is cleared by LAP. Examining all our data together revealed that the ΔcpsA mutant was restored to ∼80% of WT levels in macrophages selectively impaired in LAP (Rubicon) or jointly defective in xenophagy and LAP (Beclin, Atg5, Atg7, or Atg16L1) (Fig. 3K). In contrast, there was little rescue of the survival of the ΔcpsA mutant in macrophages defective only in xenophagy (Atg14, Ulk1, and cGAS) (Fig. 3K and Fig. S1). We conclude that LAP, not xenophagy, plays the predominant role in clearing the ΔcpsA mutant.
CpsA Acts Upstream of NADPH Oxidase.
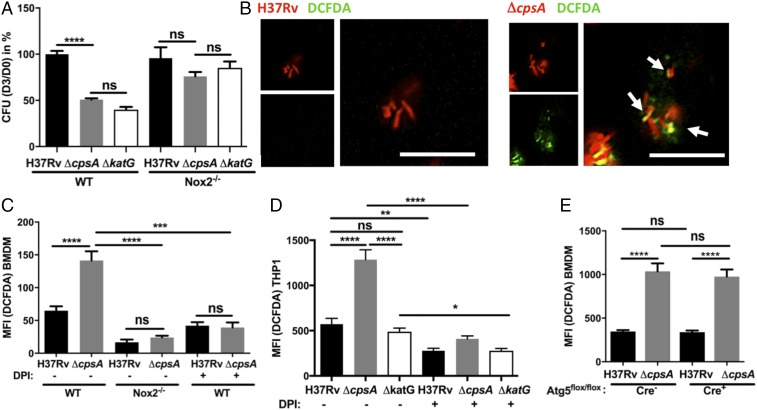
In addition to a requirement for RUBICON, LAP also depends upon NADPH oxidase and ROS (4, 5), which are not required for xenophagy. To see if NADPH oxidase also played a role in clearing the ΔcpsA mutant, we examined its survival in Nox2-KO macrophages, which lack the NADPH oxidase catalytic core (gp91phox). We compared ΔcpsA to a mutant lacking katG, which encodes a catalase-peroxidase. As previously described, the ΔkatG mutant was attenuated in WT macrophages and survived in Nox2-KO macrophages (Fig. 4A) (39). The ΔcpsA mutant behaved similarly; it was attenuated in WT BMDMs, and its intracellular survival was restored in Nox2-KO macrophages (Figs. 3K and 4A), consistent with its being cleared by LAP. In contrast, there was no rescue of ΔcpsA in BMDMs lacking inducible nitric oxide synthase (NOS2−/−) (Fig. 3K). However, while both ΔkatG and ΔcpsA were similarly susceptible to NADPH oxidase inside macrophages, the ΔcpsA mutant was not nearly as susceptible to ROS in liquid medium (Fig. S3B). Thus, we considered the possibility that ΔcpsA might be susceptible to NADPH oxidase because it induced more ROS during infection. To visualize ROS, we used 2′,7′-dichlorodihydrofluorescein diacetate (H2DCFDA), a cell-permeant derivative of fluorescein that fluoresces upon oxidation. We found that ΔcpsA infection generated substantially more phagosomal ROS than WT Mtb in both murine BMDMs and human THP-1 cells (Fig. 4 B–D). The observed H2DCFDA fluorescence was dependent upon ROS, as it could be blocked by diphenyleneiodonium (DPI), an inhibitor of superoxide production. Moreover, the ROS generated by ΔcpsA was attributable to NADPH oxidase, as it was largely absent in Nox2-KO macrophages (Fig. 4C). It has been shown previously that NADPH oxidase lies upstream of the Atg conjugation systems in LAP (Fig. S1) (4, 40). Consistent with those findings, Atg5 was not required for the enhanced phagosomal ROS generated by the ΔcpsA mutant (Fig. 4E). Since the ΔcpsA mutant can grow in macrophages lacking Atg5 (Fig. 3B) even though there is enhanced ROS (Fig. 4E), it suggests that ΔcpsA is not killed by ROS alone; clearance also depends upon the Atg conjugation system and lysosomal trafficking. Combined, these data demonstrate that CpsA protects Mtb from NADPH oxidase and subsequent LAP-mediated killing.
Fig. 4.
CpsA blocks NADPH oxidase activity. (A) Survival of Mtb H37Rv, ΔcpsA, or ΔkatG in WT and Nox2-KO BMDMs. The cfus are shown 3 d after infection relative to day 0 and normalized to WT H37Rv-infected BMDMs. (B) Fluorescence microscopy of DsRed-expressing H37Rv or ΔcpsA (red) BMDMs at 4 hpi. ROS were visualized with DCFDA (green). Arrows indicate bacilli that colocalize with the DCFDA signal. (Scale bars, 10 μm.) (C–E) Phagosomal DCFDA was quantified at 4 hpi from WT or Nox2-KO BMDMs (C), THP-1 cells (D), or Atg5-KO (Atg5flox/flox-LysM-Cre+) or control (Atg5flox/flox-LysM-Cre−) BMDMs (E) infected with DsRed-expressing Mtb H37Rv, ΔcpsA, or ΔkatG. In C and D, control samples were treated with 5 μM DPI during the infection and the DCFDA incubation step as indicated. In A and C–E, data show mean + SEM of one representative experiment from at least two independent experiments in which at least 100 bacilli were analyzed; *P ≤ 0.05; **P ≤ 0.01; ***P ≤ 0.0005; ****P ≤ 0.0001; ns, not significant; one-way ANOVA with Tukey’s multiple comparisons test.
CpsA Blocks NADPH Oxidase Recruitment to Mtb Phagosomes.
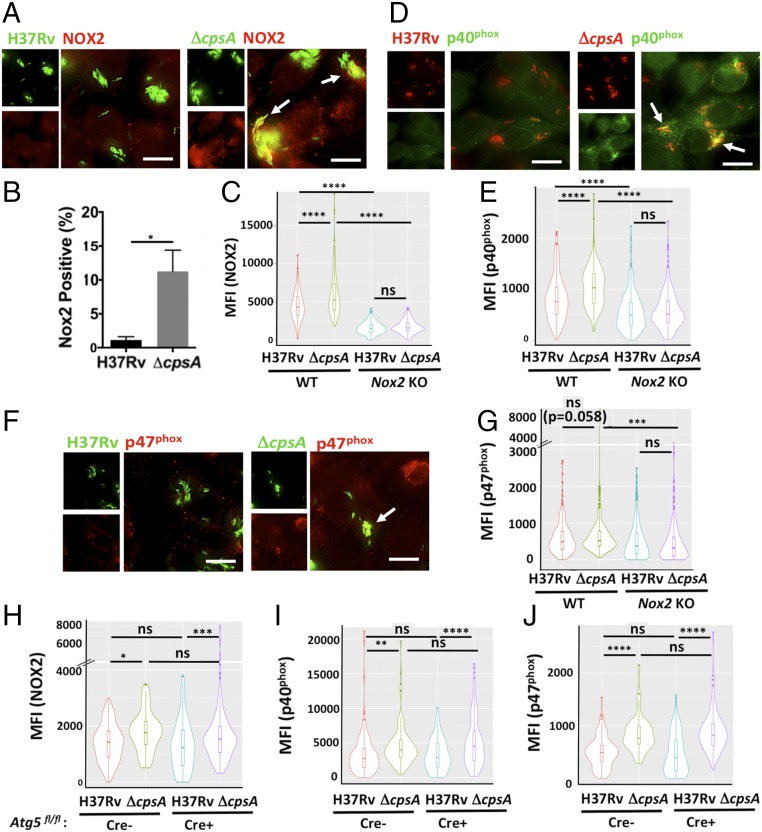
NADPH oxidase is composed of two integral membrane subunits (p22phox and gp91phox) that form flavocytochrome b558 and a trimeric cytosolic complex (p40phox, p47phox, and p67phox). NADPH oxidase activity requires membrane trafficking of flavocytochrome b558 from recycling endosomes (41), assembly with the cytosolic subunits, and activation, which is contingent upon recruitment of GTP-bound Rac1/2 (42). Since the ΔcpsA mutant elicited more ROS, we assessed NADPH oxidase trafficking and assembly by examining recruitment of gp91phox, p40phox, and p47phox to mycobacterial phagosomes. We found that the ΔcpsA mutant colocalized with the membrane and cytosolic components of NADPH oxidase substantially more than WT Mtb (Fig. 5 A–G). As expected, the enhanced association was abrogated in Nox2-KO BMDMs (Fig. 5 C, E, and G). In contrast, enhanced colocalization of the NADPH oxidase with the ΔcpsA mutant did not depend upon Atg5 (Fig. 5 H–J), corroborating that ROS generation did not depend upon the Atg conjugation system (Fig. 4E). These findings demonstrate that CpsA blocks NADPH oxidase recruitment to the mycobacterial phagosome.
Fig. 5.
CpsA inhibits trafficking and assembly of NADPH oxidase. (A) IF images of NOX2 (gp91phox) (red) and GFP-expressing H37Rv or ΔcpsA (green) WT BMDMs at 4 hpi. (B) The percentage of bacteria that colocalized with NOX2 was quantified by a blinded observer from over 400 bacteria. *P = 0.025; Student’s t test. (C) Automated image analysis of more than 200 individual bacilli was used to quantify the MFI of NOX2 colocalized with H37Rv and ΔcpsA mutant in WT and Nox2-KO BMDMs; results are shown as violin plots. (D) IF images of p40phox (green) and H37Rv or ΔcpsA (red) in WT BMDMs at 4 hpi. (F) p47phox (red) and H37Rv or ΔcpsA (green) in WT BMDMs at 4 hpi. In A, D, and F, arrows indicate bacilli that colocalize with gp91phox, p40phox, or p47phox. (Scale bars, 10 μm.) (E and G) Quantification of phagosomal p40phox (E) and p47phox (G) in WT and Nox2-KO BMDMs. (H–J) Quantification of phagosomal NOX2/gp91phox (H), p40phox (I), and p47phox (J) in Atg5-KO (Atg5flox/flox-LysM-Cre+) and control (Atg5flox/flox-LysM-Cre−) cells at 4 hpi with H37Rv or ΔcpsA. In C, E, and G–J, data are shown as violin plots (described in the legend of Fig. 1) from a representative experiment from at least two independent experiments. The number of bacilli analyzed per sample was at least 160 in C, E, and G and at least 48 in H–J; *P ≤ 0.05; **P ≤ 0.01; ***P ≤ 0.0005; ****P ≤ 0.0001; ns, not significant; one-way ANOVA with Tukey’s multiple comparisons test.
CpsA Is Sufficient to Inhibit Phagosomal NADPH Oxidase Recruitment.
CpsA belongs to the LCP family of proteins that are implicated in cell-wall biosynthesis in Gram-positive bacteria. Recent work demonstrated that in Actinobacteria LCP family members ligate AG to PGN (21, 22). In Mtb, there are two other full-length LCP members in addition to CpsA. Rv3267 plays the dominant role in cell-wall biogenesis, while CpsA is thought to have a minor role. Using GC/MS, we verified a slight decrease in AG attachment to PGN in the ΔcpsA mutant in our strain background, as had been seen in the CDC1551 strain background (Table S1). However, this did not result in substantial differences in growth under a variety of stress conditions (Fig. S3 B–F), as also is consistent with previous findings in the CDC1551 strain background (21).
Table S1.
Sugar analyses of cell walls from Mtb H37Rv, ΔcpsA, and the complemented strain
| Strain | Rha | Ara | Man | Gal | Glc | GlcNAc | GalNAc | Mur |
| H37Rv | 1.00 | 32.35 | 2.73 | 15.88 | 13.74 | 4.80 | 1.50 | 3.28 |
| ΔcpsA | 1.00 | 37.44 | 9.66 | 20.50 | 19.73 | 6.79 | 1.60 | 7.44 |
| ΔcpsA::cpsA | 1.00 | 32.03 | 4.20 | 16.87 | 14.45 | 5.33 | 1.67 | 2.48 |
The amount of rhamnose (Rha), an arabinogalactan marker, was compared with the amount of GlcNAc and N-acetyl muramic acid (Mur) (peptidoglycan markers) in the indicated strains. The amounts of each monosaccharide in the samples are expressed relative to Rha, which is set to be constant. Consistent with earlier analysis of Mtb and M. marinum strains deficient in the expression of cpsA, the data reflect a slight loss of arabinogalactan attachment to peptidoglycan in the mutant strain that is restored toward WT levels in the complemented strain. Ara, arabinose; Gal, galactose; Glc, glucose; Man, mannose.
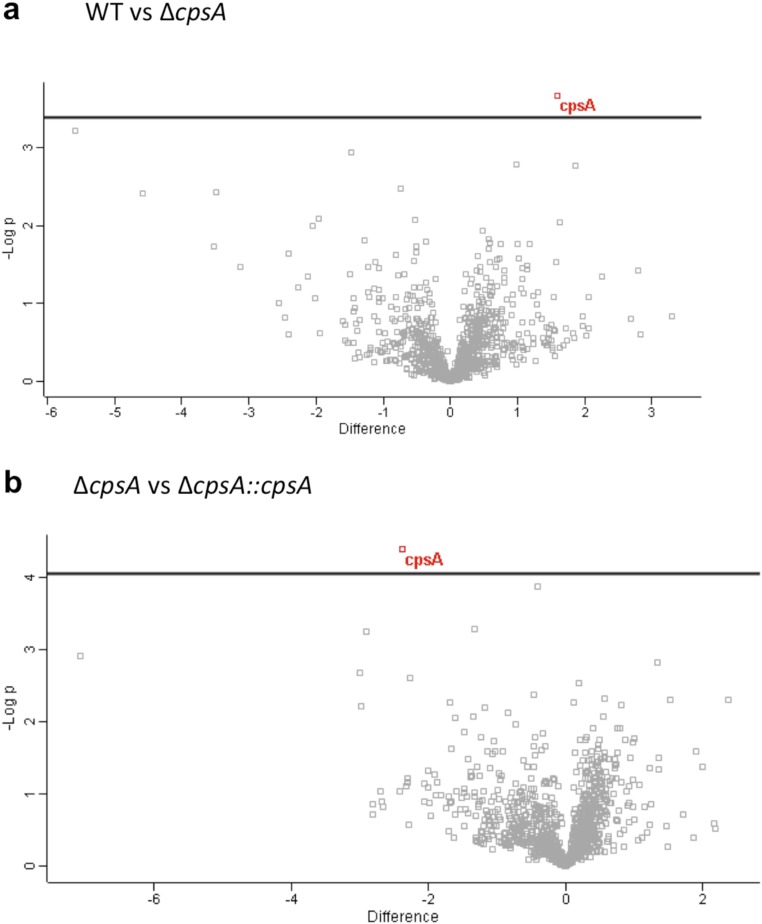
Although the ΔcpsA mutant appeared to have only a mild cell-wall defect, we considered the possibility that even a mild perturbation in the cell wall might expose more pathogen-associated molecular patterns (PAMPs), rendering the ΔcpsA mutant hyperinflammatory and driving LAP. Since a number of Mtb Toll-like receptor 2 (TLR2) ligands are exported lipoproteins, we examined whether there was a difference in the proteins shed by the ΔcpsA mutant in culture filtrate compared with WT and the complemented strain. Mass spectrometry-based label-free quantitative analysis of the culture filtrate revealed no statistically significant differences except CpsA itself (Fig. S6). Since activation by other PAMPs was also possible, we next compared the transcriptional signature of uninfected macrophages with those infected with the ΔcpsA mutant and WT Mtb. At 4 hpi, thousands of genes were differentially regulated between uninfected and infected macrophages. However, using a false-discovery rate (FDR) cutoff of 0.05, only one gene was differentially expressed between WT and ΔcpsA–infected macrophages (TMA16, adjusted P = 0.04). Nonetheless, Kyto Encyclopedia of Genes and Genomes (KEGG) pathway analysis revealed a difference in the “Tuberculosis” response pathway between WT and ΔcpsA–infected macrophages, which largely reflected a difference in expression of NF-κB–regulated genes (Fig. S5B). However, contrary to our idea that the ΔcpsA mutant might drive LAP by virtue of being hyperinflammatory, the ΔcpsA mutant elicited a diminished NF-κB response (Fig. S5 B–D).
Fig. S6.
Secretome analysis of ΔcpsA. (A and B) Volcano plots of the culture filtrate proteins from triplicate samples of H37Rv, ΔcpsA, and ΔcpsA::cpsA. In A, the CF from WT Mtb was compared with ΔcpsA, and in B ΔcpsA was compared with the complemented strain. A two-sided t test was performed correcting for multiple testing by controlling for FDR at 5%. The only protein that was significantly different in both comparisons (q-value <0.05) was CpsA (shown in red).
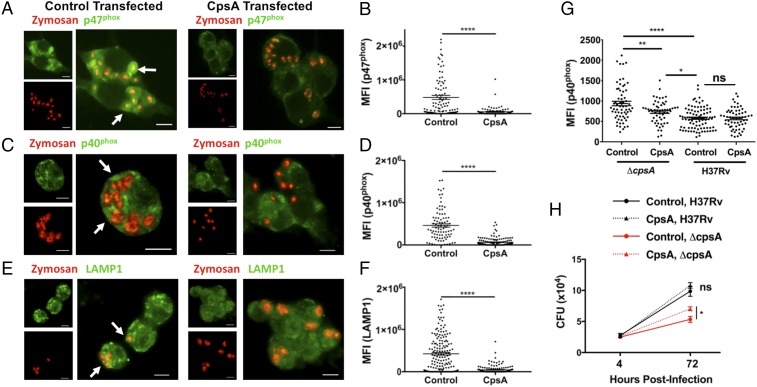
Since enhanced PAMP signaling from an altered cell wall did not appear to explain ΔcpsA’s ability to increase LAP, we wondered whether CpsA’s role in virulence reflected a function independent of its activity on the cell wall. To determine whether CpsA was sufficient to alter intracellular trafficking in macrophages, we expressed a CpsA-GFP fusion protein in RAW264.7 cells, a murine macrophage cell line. CpsA has a putative signal peptide and is found in the culture filtrate as well as the cell envelope (Fig. S2) (25–27). We expressed CpsA without its putative signal peptide to mimic what would be exported from the bacteria and could gain access to the mammalian cell. As a control, we expressed a chloramphenicol acetyltransferase-fusion protein (CAT-GFP). We incubated macrophages expressing CpsA-GFP or CAT-GFP with zymosan, which has previously been shown to recruit the NADPH oxidase and traffic through the LAP pathway (4). We found that CpsA dramatically impaired recruitment of p47phox and p40phox to zymosan-containing phagosomes as well as their delivery to a LAMP1+ compartment (Fig. 6 A–F). Thus, CpsA is sufficient to inhibit recruitment of NADPH oxidase to fungal cargo and to block lysosomal trafficking, demonstrating an activity beyond cell-wall biogenesis. Moreover, when the transfected macrophages were infected with the ΔcpsA mutant, CpsA expression inhibited recruitment of NADPH oxidase to ΔcpsA-mutant phagosomes and partially rescued the intracellular survival defect of the mutant, while WT Mtb infection was not altered (Fig. 6 G and H). Combined, these data support the idea that CpsA functions by acting on the host cell rather than the mycobacterial envelop to alter intracellular trafficking.
Fig. 6.
CpsA is sufficient to inhibit LAP. (A, C, and E) RAW264.7 cells transfected with CpsA or control mRNA were examined by IF microscopy after the addition of zymosan (red) for the localization of p47phox (A), p40phox (C), and LAMP1 (E) (all pseudocolored green). Arrows indicate zymosan particles that colocalize with p47phox, p40phox, or LAMP1. (Scale bars, 10 μm.) (B, D, and F) Quantification of phagosomal p47phox (B), p40phox (D), and LAMP1 (F). (G) RAW264.7 cells transfected with CpsA or control mRNA were infected with H37Rv and ΔcpsA and were examined by IF microscopy. Phagosomal p40phox was quantified at 3 hpi. (H) Growth of H37Rv and ΔcpsA in RAW264.7 cells transfected with CpsA or control mRNA. The cfus are shown at the indicated time points. Data show mean ± SEM from one representative experiment from two independent experiments; *P ≤ 0.05, **P ≤ 0.01; ****P ≤ 0.0001; Student’s t test (B, D, F, and H) or ANOVA (G).
CpsA Protects Mtb in Vivo.
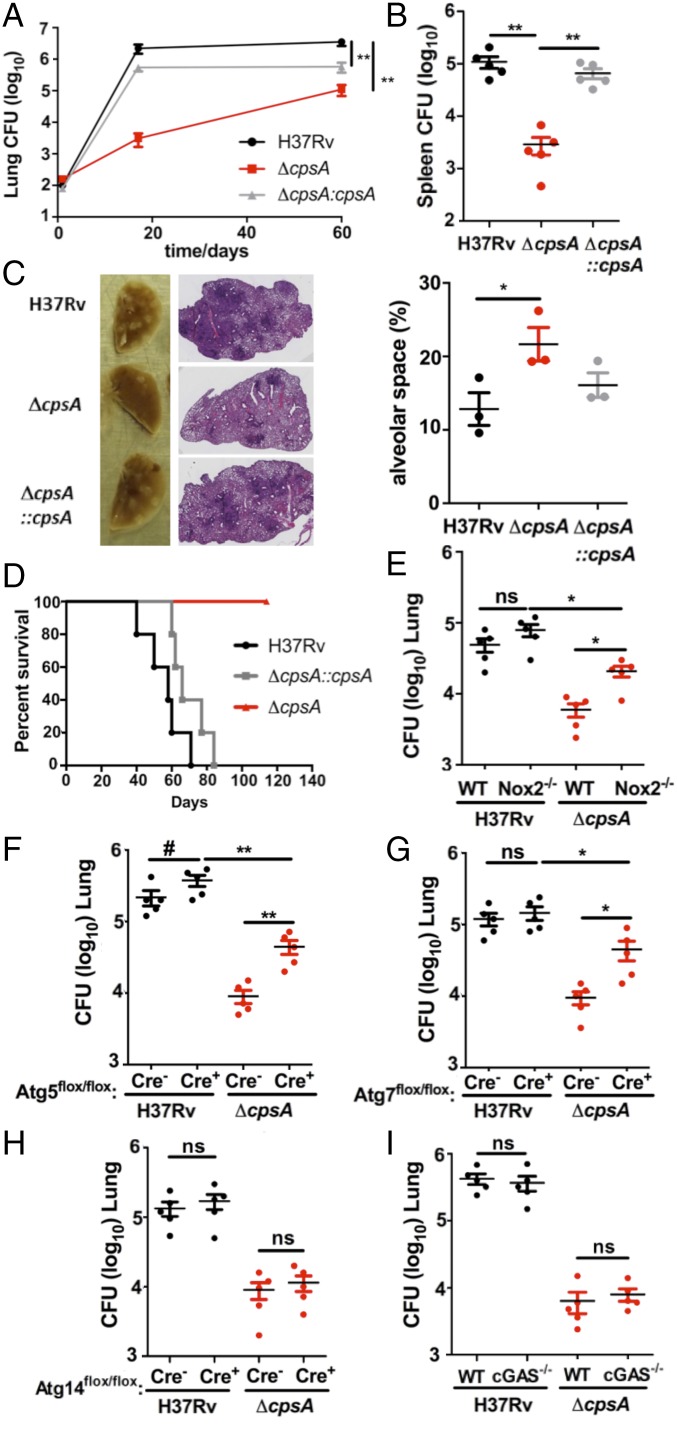
To assess whether cpsA is required in vivo, we infected C57BL/6 mice with WT or ΔcpsA via low-dose aerosol. After 17 d of infection, there was more than a two-log reduction in cfu of ΔcpsA compared with WT Mtb in the lungs, along with diminished consolidation in the lungs and defective dissemination to the spleen (Fig. 7 A–C). Virulence was restored to the ΔcpsA mutant by introduction of cpsA under control of its native promoter (Fig. 7 A–C). Because the ΔcpsA mutant was attenuated early in infection, it suggested that Mtb requires CpsA to survive the innate immune response, consistent with our findings in macrophages. To further evaluate this, we infected SCID mice, which lack an adaptive immune response. Eight weeks postinfection, all mice infected with a strain producing CpsA died, whereas all ΔcpsA-infected mice survived (Fig. 7D). Twenty weeks postinfection, we euthanized two of the ΔcpsA-infected mice to examine the bacterial burden. Remarkably, we could not recover any bacilli from the lungs. The remaining ΔcpsA-infected mice were thriving 32 wk postinfection. These results demonstrate that the innate immune response controls the ΔcpsA mutant in vivo, whereas WT Mtb resists the innate immune response, proliferates, and kills the host.
Fig. 7.
CpsA is required for innate immune evasion in mice. (A and B) WT (C57BL/6) mice were infected by aerosol with H37Rv, ΔcpsA, or ΔcpsA::cpsA. The cfus were enumerated from lungs (A) and spleens (B) at 60 d postinfection; n = 5 mice per group; data show the mean ± SEM; **P ≤ 0.01; Mann–Whitney test. (C) Representative images of the lungs and H&E stains from mice at 60 d postinfection. The alveolar space was calculated from lung sections of three mice using ImageJ; data show mean ± SEM; *P ≤ 0.05; Student’s t test. (D) Kaplan–Meier survival analysis of SCID mice infected by aerosol with H37Rv, ΔcpsA, or ΔcpsA::cpsA; n = 5 mice per group. The log-rank (Mantel–Cox) test indicated statistical significance between ΔcpsA and both H37Rv and ΔcpsA::cpsA. (P ≤ 0.0005). (E–I) The cfus were quantified from the lungs of WT and Nox2-KO mice (E), Atg5-KO (Atg5flox/flox-LysM-Cre+) mice and Atg5flox/flox-LysM-Cre− littermate controls) (F), Atg7-KO (Atg7flox/flox-LysM-Cre+) mice and Atg7flox/flox-LysM-Cre− littermate controls (G), Atg14-KO (Atg14flox/flox-LysM-Cre+) mice and Atg14flox/flox-LysM-Cre− littermate controls (H), and WT and cGAS−/− mice (I) infected by aerosol with H37Rv or ΔcpsA. Lungs were harvested on day 17 (E), 20 (G and I), 21 (H), and 24 (F). In E and I, C57BL/6 (WT) mice were used as controls. n = 5 mice per group; data show mean ± SEM; #P < 0.10, *P ≤ 0.05, **P ≤ 0.01; ns, not significant; Mann–Whitney test.
Previous work showed that catalase-deficient Mtb (ΔkatG) grows equivalently to WT during the first 2 wk of infection in mice, indicating that the bacilli are not experiencing oxidative stress during this time. This observation led McKinney and colleagues to speculate that delivery of NADPH oxidase to Mtb phagosomes is blocked during acute infection (39). Our in vitro data suggested that this might be mediated by CpsA. To determine whether CpsA protects Mtb from NADPH oxidase during acute infection in vivo, we infected Nox2-KO mice with the ΔcpsA mutant and compared cfu in the lungs of these mice with that of C57BL/6 mice 17 d postinfection. We found that ΔcpsA grew 0.5 log more in the Nox2-KO mice than in WT mice (Fig. 7E), while Nox2 did not significantly affect WT Mtb. There was a trend toward increased growth of WT Mtb in mice lacking Atg5 in the myeloid compartment (Atg5flox/flox LysM-Cre+) compared with control animals, while no difference was observed in mice lacking Atg7 (Atg7flox/flox LysM-Cre+), consistent with findings by Kimmey et al. (8). In both Atg5 and Atg7 mutants, we observed partial rescue of the ΔcpsA mutant compared with Cre− littermate controls (Fig. 7 F and G). Finally, in keeping with our in vitro data, Atg14 (Atg14flox/flox LysM-Cre+) and cGAS-deficient mice failed to rescue the ΔcpsA mutant (Fig. 7 H and I). Overall, our data demonstrate that CpsA protects Mtb from NADPH oxidase and LAP in macrophages and mice.
Discussion
Mtb activates PRRs such as TLR2 and C-type lectin receptors (CLRs) but resists immune control from NADPH oxidase and LAP, which are normally activated by these PRRs. Our findings establish a role for CpsA in evading these antimicrobial pathways. Our results are consistent with previous work showing that NADPH oxidase fails to assemble on the mycobacterial phagosome and that the oxidative burst to Mtb is marginal (39, 43). Previous studies also suggested that Mtb inhibits NADPH oxidase in vivo during acute infection, since catalase-deficient Mtb grow normally during that time (39). Our data demonstrate that CpsA is a significant mediator of Mtb’s resistance to NADPH oxidase and LAP in vivo, as the growth of the mutant is improved in mice deficient in Nox2 or lacking Atg5 or Atg7 in hematopoietic cells, all of which are required for LAP. While recent work has called into question the role of autophagy in Mtb pathogenesis (8), our findings suggest that Atg proteins involved in LAP are poised to play a role but are subverted by the pathogen.
NAPDH oxidase and LAP are crucial in the battle of host and pathogen, and our data demonstrate that CpsA plays an important role in Mtb’s ability to disarm the innate immune system. The ΔcpsA mutant is highly attenuated early during infection before the initiation of an adaptive immune response, and, remarkably, SCID mice do not succumb to infection. Our data highlight that even though Mtb is relatively resistant to ROS by virtue of catalase, NADPH oxidase plays an additional role in bacterial control by activating a potent lysosomal-trafficking pathway. The importance of blocking LAP is demonstrated by other pathogens as well. The growth of Salmonella typhimurium is restricted by LAP (40), and Aspergillus and Leishmania inhibit LAP (44, 45). In addition, a number of pathogens inhibit NADPH oxidase (46–49), although the link to LAP has not been clearly established. Even though Mtb can inhibit NADPH oxidase and LC3-trafficking systems, it must do so imperfectly, as these host mechanisms still play an important role in defense. For example, individuals with chronic granulomatous disease who have mutations in NADPH oxidase have increased susceptibility to mycobacterial diseases (50). We speculate that there may also be rare individuals who are relatively resistant to infection because Mtb cannot disarm their NADPH oxidase and LAP pathway.
Interestingly, the ΔcpsA mutant is less attenuated over time in mice (Fig. 7A), and it survives similarly to WT Mtb in activated macrophages (Fig. 2 A and B). These findings suggest that once an adaptive immune response is initiated, different bacterial effectors compensate for the loss of cpsA or, alternatively, NADPH oxidase and LAP take on a less important role during chronic infection. We favor the idea that NADPH oxidase and LAP become less important as iNOS and canonical autophagy are stimulated under the influence of proinflammatory cytokines. At the same time, there would presumably be a corresponding shift in the virulence factors that Mtb needs to persist. Interestingly, two bacterial factors that impair Mtb autophagy in vitro, Eis and PE_PGRS47, do not play a role in acute infection in mice (16, 17). The PE_PGRS47-KO strain is attenuated during chronic infection, perhaps reflecting a switch from LAP to canonical autophagy as a dominant host response in the transition from acute to chronic infection.
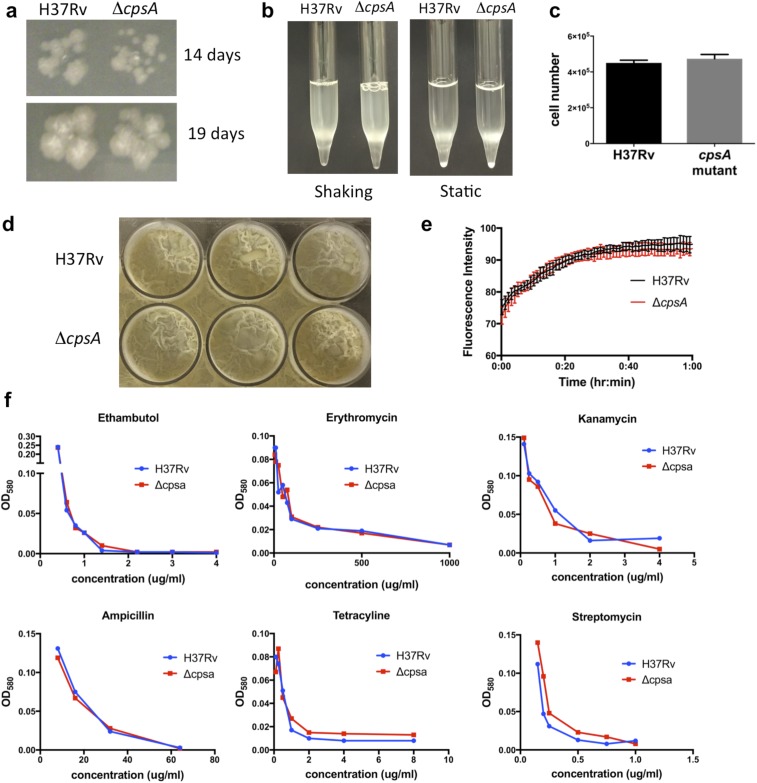
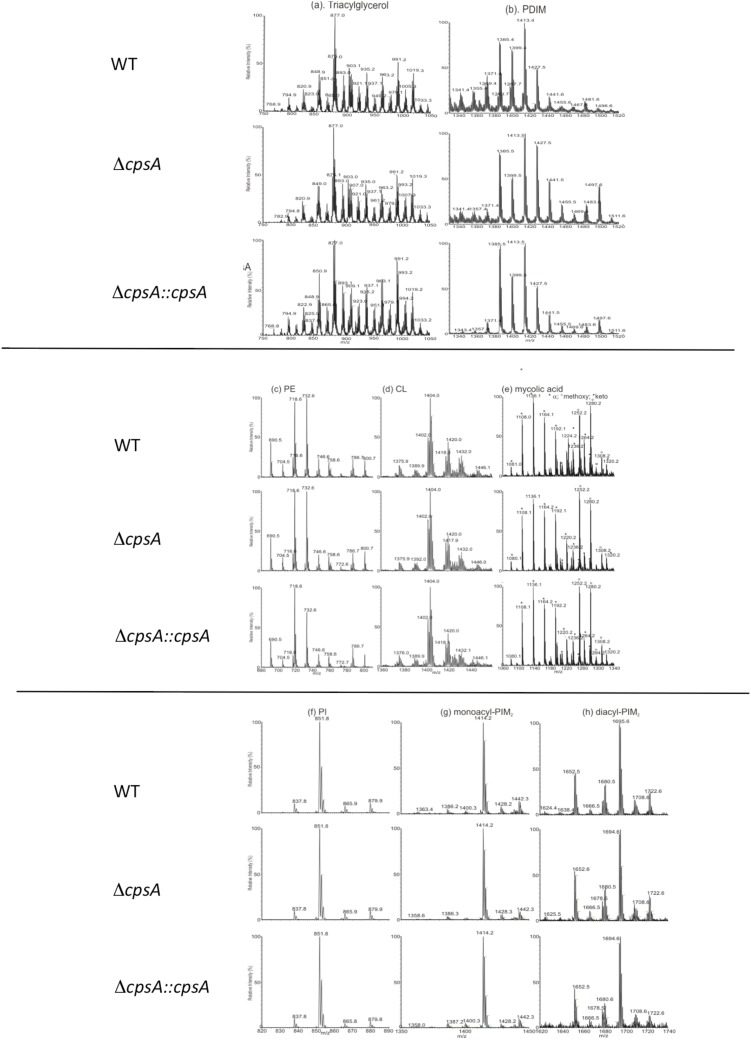
CpsA is absent from nonpathogenic mycobacteria, so it appears that duplication of an LCP protein allowed CpsA to acquire an additional role in virulence. The evolution of critical virulence factors from proteins that play a basic role in bacterial physiology in environmental mycobacteria is a recurrent theme in Mtb pathogenesis, perhaps reflecting the lack of horizontal gene transfer. In Mycobacterium marinum, the close relative of Mtb, a cpsA transposon mutant is also defective in arresting phagosome maturation in macrophages and is attenuated in zebrafish (51). Interestingly, however, in M. marinum cpsA seems to have a prominent role in cell-wall biology that is starkly diminished in Mtb. The M. marinum cpsA mutant has numerous phenotypes associated with a cell-wall defect, including an in vitro growth defect, altered colony morphology, excess clumpiness, increased susceptibility to certain antibiotics, and enhanced uptake into macrophages (51). The Mtb ΔcpsA mutant did not exhibit any of these phenotypes in our studies (Fig. 2 A and B and Figs. S3A, S4 F–I, and S7), nor did we find differences in cell-wall extractable lipids or biofilm formation (Figs. S7D and S8). Likewise, it was recently reported that the ΔcpsA mutant in the CDC1551 strain background did not exhibit significant differences in growth, cording, antibiotic susceptibility, or total lipids, mycolic acids, or cell-wall polysaccharides (21). Thus, CpsA may play a diminished role in cell-wall biogenesis in Mtb compared with M. marinum. Another explanation for the differences is that the M. marinum mutation is caused by a transposon insertion between the LCP and LytR domains, whereas the Mtb studies used complete deletions. Thus, it is also possible that the prominent cell-wall defects in M. marinum are a consequence of an aberrant, truncated CpsA protein.
Fig. S7.
The ΔcpsA mutant has normal growth characteristics and antibiotic susceptibility. (A) H37Rv and ΔcpsA were grown on 7H11 plates for 14 and 19 d. (B) H37Rv and ΔcpsA growing in 7H9 medium are shown immediately after shaking and after being held static. (C) Equivalent optical densities of H37Rv and ΔcpsA were plated on 7H11 medium, and the number of bacteria was enumerated by cfu. (D) H37Rv and ΔcpsA were grown under biofilm-promoting conditions. (E) The fluorescence associated with ethidium bromide uptake was measured over time in H37Rv and ΔcpsA. (F) Growth of H37Rv and ΔcpsA in the presence of the indicated concentrations of antibiotics.
Fig. S8.
Analysis of cell wall-extractable lipids from Δcpsa mutant. Shown are ESI mass spectra of lipids extracted from of the cell wall of H37Rv (WT), ΔcpsA, and ΔcpsA::cpsA. (A) Triacylglycerol (TAG), [M + NH4]+ ions. (B) Phthiocerol dimycolate (PDIM), [M + NH4]+ ions. (C) Phosphatidylethanolamine (PE), [M − H]− ions. (D) Cardiolipin (CL), [M − H]− ions. (E) Mycolic acid (MA), [M − H]− ions. (F) Phosphatidylinositol (PI), [M − H]− ions. (G) Monoacyl-PIM2, [M − H]− ions. (H) Diacyl-PIM2, [M − H]− ions. No differences were noted, except that PDIMs with longer chain length may be more abundant in the ΔcpsA mutant than in the WT. PDIM length has been shown to increase in vivo and with increased propionate (67). Any relationship of this change to the cell wall and virulence is unclear.
It remains to be determined how CpsA impairs NADPH oxidase recruitment and LAP. It is possible that it does so as a consequence of its cell-wall function. There is precedence for such a possibility: in Aspergillus melanin inhibits recruitment of the p22phox subunit of the NADPH oxidase to germinating conidia, thereby protecting them from LAP (44). The most straightforward explanation for the macrophage phenotype of the ΔcpsA mutant would be that loss of cell-wall integrity results in enhanced PRR signaling, driving LAP. However, our data argue against that possibility. First, the cell wall-associated phenotypes of ΔcpsA are subtle, and there were no differences in the proteins shed into culture filtrate by the ΔcpsA mutant, arguing against a major disruption to the cell wall. This does not rule out a cell-wall role, but if CpsA inhibits LAP through a cell-wall mechanism, it must carry out an immunologically important but structurally minor modification. Importantly, however, we did not detect any increase in host signaling pathways in response to the ΔcpsA mutant to suggest that TLR or CLR signaling were enhanced. In fact, we found the opposite, which may reflect the known ability of NADPH oxidase to negatively regulate NF-κB signaling (52). Thus, CpsA is likely to inhibit LAP downstream of PRRs, raising the possibility that CpsA blocks NADPH oxidase independently of its cell-wall activity. Consistent with this, we found that CpsA dramatically inhibited NADPH oxidase recruitment to zymosan particles, strongly supporting that idea that CpsA has a function independent of the cell wall. In addition, CpsA expression in macrophages partially restored survival of the ΔcpsA mutant, arguing that any potential cell-wall defect is not the sole basis of its attenuation.
LCP domain-containing proteins are found in nearly all Gram-positive bacteria, but the paradigm that they play a role in cell-envelope biogenesis is derived from only a few studies. Individual bacterial species can contain up to 11 LCP proteins, and there is at least one example in which an LCP protein serves as a glycosyl transferase that modifies a protein, not PGN (53). Thus, we favor the idea that CpsA has repurposed the LCP domain’s transferase activity to target the host. Exactly how CpsA blocks LAP and its relationship to NDP52 and/or TAX1BP1 binding (24) are under investigation.
In conclusion, our studies reveal that Mtb evades LAP, which unexpectedly depends upon the LCP protein, CpsA. Since Mtb strains that induce more ROS or LC3-associated pathways correlate with more favorable treatment outcomes (54, 55), CpsA might be an effective drug target, which could work in concert with host-directed therapies aimed at increasing LC3-trafficking pathways. Moreover, inhibitors that block multiple LCP family members would be particularly attractive therapies, since they would undermine both cell-wall homeostasis and virulence.
Materials and Methods
Bacterial Strains and Growth Conditions.
Mtb strain H37Rv was used to generate ΔcpsA, ΔcpsA::cpsA, and ΔkatG. Mtb strains were grown at 37 °C in 7H9 medium (Middlebrook 7H9 broth; Difco) supplemented with 0.05% Tween 80 (Sigma), BBL Middlebrook OADC Enrichment, and 0.2% glycerol (Sigma). The unmarked ΔkatG strain was a gift from W. Jacobs, Jr., Albert Einstein College of Medicine, New York. Middlebrook 7H10 or 7H11 agar (BD) was used for growth on solid medium. ΔcpsA strain construction and antibiotic selection for plasmids are described in SI Materials and Methods. Lysozyme, hydrogen peroxide, nitric oxide, and SDS treatments are described in SI Materials and Methods.
Mice.
The New York University School of Medicine (NYU SOM) or the Washington University School of Medicine, St. Louis, MO (WUSM) Institutional Animal Care and Use Committee approved all work with mice. C57BL/6, SCID (Prkdcscid), and iNOS (Nos2tm1Lau) mice were obtained from The Jackson Laboratory. Cgas−/−, Beclin1flox/flox-LysM-Cre, Atg7flox/flox-LysM-Cre, Atg14flox/flox-LysM-Cre, and Atg16l1flox/flox-LysM-Cre mice were generously provided by H. W. Virgin (WUSM). Rubicon−/− mice were provided by D. Young (St. Jude Children’s Research Hospital, Memphis, TN). Atg5flox/flox-LysM-Cre mice were provided by C. Stallings (WUSM). Nox2-KO mice were provided by M. Dinauer (WUSM). LC3-GFP mice were provided by A. Yamamoto (Columbia University, New York) and N. Muzushima (University of Tokyo, Tokyo).
Plasmid Construction.
The cpsA-complementing plasmid (pKP617) was generated by PCR amplification of the cpsA gene along with a 685-bp upstream region as described in SI Materials and Methods. For expression in mammalian cells, CpsA-GFP was amplified by PCR and cloned into pDEST47 as described in SI Materials and Methods.
Macrophages.
Murine hematopoietic stem cells were isolated from the tibia and femurs of 6- to 15-wk-old C57BL/6 mice (unless otherwise noted) as described in SI Materials and Methods. THP-1 cells (American Type Culture Collection) and RAW264.7 cells (American Type Culture Collection) were grown as described in SI Materials and Methods. RNAi-mediated silencing was performed as described in SI Materials and Methods.
Microscopy.
Macrophages were infected with GFP- or DsRed-expressing Mtb strains at a multiplicity of infection (MOI) of ∼5. After 4 h, macrophages were washed and fixed with 1% paraformaldehyde/PBS overnight. Immunostaining, ROS visualization, and image acquisition were performed as described in SI Materials and Methods.
For the zymosan-trafficking assay, RAW264.7 cells were transfected with CpsA-GFP or CAT-GFP (as control) as described in SI Materials and Methods. The transfected macrophages were challenged with Zymosan A Bioparticle Alexa Fluor 594 conjugate (Z23374; Molecular Probes, Life Technologies). Immunostaining, image acquisition, and analysis are described in SI Materials and Methods.
Intracellular Bacterial Survival Assays.
To assess Mtb survival in vitro, BMDMs from C57BL/6 mice, unless otherwise specified, were seeded 1 d before infection and infected with a single-cell suspension of Mtb at a MOI of ∼3, as previously described (24) and detailed in SI Materials and Methods. RAW264.7 cells were used when macrophages were transfected with CpsA as described in SI Materials and Methods.
Protein Extracts, Western Blotting, Mass Spectrometry, and RNA-Sequencing.
Preparation of protein extracts, Western blotting, mass spectrometry, and RNA-sequencing (RNA-seq) are described in SI Materials and Methods.
In Vivo Bacterial Infection.
Mice (8–15 wk old) were infected by aerosol with Mtb using the inhalation exposure system from Glas-Col as described in SI Materials and Methods. Male and female mice were used except in the case of the Nox2-KO mice, for which hemizygous mutant males were compared with WT males. Approximately 100 cfus were administered per animal, except in the case of SCID mice, to which ∼20 cfu were delivered.
Generation of Anti-CpsA Antisera.
To generate polyclonal antisera against Mtb CpsA, 250 μg of recombinant CpsA (amino acids 51–512) was produced in Escherichia coli and injected into rabbits using TiterMax Gold adjuvant (TiterMax), followed by boosts with incomplete Freund’s adjuvant containing 125 μg purified CpsA (Covance).
Glycosyl Composition of Cell Walls (Table S1).
Cell walls from Mtb grown to log phase were hydrolyzed with 2 M trifluoroacetic acid, and the derived alditol acetates were subjected to GC/MS as described (21).
Statistical Analysis.
The unpaired, two-tailed Student’s t test, one-way ANOVA with Tukey’s multiple comparisons test, or Mann–Whitney test were used to assess the statistical significance of the comparison of experimental groups using GraphPad Prism software (www.graphpad.com). For analysis of Kaplan–Meier curves, the Mantel–Cox (log-rank) survival analysis was used. Violin plots were generated using ggplot2.
SI Materials and Methods
ΔcpsA Strain Construction.
A 2.25-kb linear DNA substrate carrying the hygR gene and 500-bp flanking homologous DNA was used in the Che9c-phage–mediated recombineering approach (56, 57) to create a hygR-marked deletion within the cpsA locus in H37Rv cells. Allelic exchange of the cpsA locus was confirmed by PCR screening of two hygR colonies for the presence of the 5′ and 3′ recombinant junctions and lack of amplification of a fragment internal to the deleted region using the primers listed below. The amplified 5′ and 3′ recombinant junctions were sequenced to rule out mutations in the cloned flanking regions. The cpsA deletion corresponds to the genome coordinates 3903108–3904586 (tuberculist.epfl.ch/quicksearch.php?gene+name=cpsA&submit=Search). Primers used to screen were 5′ recombinant junction: CTG GTC CAG CGG TCA CCG TC and GCA GGC TCG CGT AGG AAT CAT CC; 3′ recombinant junction: GAA CTG CTC GCC TTC ACC TTC C and AAC CGC GTG GCA TGG CCG GCT GCA; and internal to the deletion: TGC TCA TCG GGC TGG ACT CG and ACT CGA TGG CGG TGG TGA ACG.
Plasmid Construction.
The cpsA-complementing plasmid (pKP617) was generated by PCR amplification of the cpsA gene along with the 685-bp upstream region using the primers listed below. The resulting PCR fragment was cut with EcoRV and HindIII and cloned into the SwaI and HindIII sites of a Zeocin-resistant L5 integrating vector (pDE43-MCZdelta; a gift from Dirk Schnappinger, Weill Cornell Medical College, New York). Following sequence verification, the complementing plasmid was electroporated into the ΔcpsA::hyg mutant and selected on 7H10 plates supplemented with 25 μg/mL Zeocin (Thermo Fisher Scientific). Primers for amplifying the cpsA-complementing fragment were TCT AGA TAT CCG GGG AGC TGT TGG TGG CGT CTT G and CGA TAA GCT TGG GCT GCG TGG AGT GGT CGG ATA A.
For expression in mammalian cells, CpsA-GFP (pJP156; pDEST47∆ss-CpsA-GFP) was amplified by PCR using primers containing attB1 and attB2 sites (listed below) and was cloned into pDONR223 using a Gateway BP reaction. This construct encodes CpsA beginning at leucine-52 of the native protein and was verified by sequencing. The construct was moved from pDONR223 to pDEST47 using a Gateway LR reaction. Primers used to generate pJP156 (∆ss-CpsA-GFP) were GGG GAC AAC TTT GTA CAA AAA AGT TGGCAC CAT GCT GGG CGG CATC and GGG GAC AAC TTT GTA CAA GAA AGT TGG CAA GTT CAC GCA GGG CAC G.
Macrophages.
Murine hematopoietic stem cells were isolated from the tibia and femurs of 6- to 15-wk-old mice as previously described (58). C57BL/6 mice were used unless otherwise noted. For differentiation into BMDMs, DMEM medium was supplemented with 10% FBS and 20% L929-conditioned medium for 7 d. The concentration of L929-conditioned medium was reduced to 10% before infections. For experiments in which IL-1β was measured from conditioned medium, DMEM was supplemented with 20 ng/mL recombinant macrophage colony-stimulating factor (M-CSF; ProSpec) instead of L929-conditioned medium. THP-1 cells (American Type Culture Collection) were grown in RPMI 1640 medium (Gibco BRL) supplemented with 10% FBS (Gibco). The cells were treated with 100 nM phorbol myristate acetate (PMA; Sigma) for 4 d before infection. RAW264.7 cells (American Type Culture Collection) were grown in DMEM with 10% FBS. Penicillin/streptomycin (Gibco) was included in all media except during infections and mRNA transfections. In cases where ROS were blocked, 5 μM DPI was added to the medium throughout the infection and during the incubation with DCFDA.
RNAi-Mediated Silencing.
siRNAs for Rubicon (L-172564-00), Ulk1 (L-040155-00), Tsg101 (M-049922), Atg7 (LQ-049953), and Rab7 (D-040859) were obtained from Thermo Fisher Scientific and transfected using Hiperfect (Qiagen). RNAi-mediating silencing of Tsg101 and Rab7 has been reported previously (24, 32, 33). Silencing was performed with 50 nM siRNA for 2 d before Western blotting or infection. ON-TARGETplus Non-Targeting siRNA #1 (Thermo Fisher Scientific) was used as a control.
Antibodies.
To generate polyclonal antisera against Mtb CpsA, 250 μg of recombinant CpsA (amino acids 51–512) was produced in E. coli and injected into rabbits using TiterMax Gold adjuvant (TiterMax), followed by boosts with incomplete Freund’s adjuvant containing 125 μg purified CpsA (Covance). The following additional primary antibodies were used for Western blotting: KatG IT42 (HBT1; BEI; NR-13791), ESAT-6 (11G4; Pierce; HYB 076–08-02), RUBICON (D9F7; Cell Signaling; no. 8465), ULK1 [EPR4885 (2); Abcam; ab128859], TSG101 (4A10; GeneTex; GTX70255), RAB7 (Rab7-117; Abcam; ab50533), β-ACTIN (C4; Santa Cruz; sc-47778), and Antigen 85 (a gift from J. Ernst, NYU SOM, New York). The following primary antibodies were used for immunofluorescence: NOX2/gp91phox (54.1; Abcam; ab80897), p40phox (Santa Cruz; sc-18252-R), p47phox (F-15; Santa Cruz; sc-23492), and LAMP1 (Abcam ab24170 for Mtb studies, Novus NB120-19294 for zymosan studies).
Microscopy.
BMDMs (105) were seeded in eight-well chamber slides 1 d before infection. Macrophages were infected with GFP- or DsRed-expressing Mtb strains at a MOI of ∼5. After 4 h, macrophages were washed and fixed with 1% paraformaldehyde/PBS overnight. Immunostaining was performed using the primary antibodies listed above and secondary antibodies conjugated to Alexa Fluor 488, 594, or 647 (Molecular Probes). ROS were examined using 2′,7′–dichlorofluorescin diacetate (CM-H2DCFDA; Life Technologies) at a concentration of 10 μM for 45 min in PBS before fixation. Images were captured using the Nikon Eclipse TiE/B automated fluorescent microscope with a Photometrics HQ@ Monochrome digital camera. Z-stack images (60×) were acquired, deconvoluted, and analyzed using NIS-Elements DUO software as described (24). Automated image analysis was performed on at least three fields from each experimental replicate as previously described in detail (24). Contrast was not altered before image analysis. For reproduced images, alterations were applied equally to H37Rv and ΔcpsA samples.
For the zymosan-trafficking assay, RAW264.7 cells were seeded in 96-well plates (µ-Plate 96 well; ibidi GmbH). The cells were transfected at 200 ng per well with mRNA expressing either CpsA-GFP or CAT-GFP (control). mRNA was generated from plasmids pJP156 (pDEST47∆ss-CpsA-GFP, described above) and pcDNA/GW-47/CAT (Thermo Fisher Scientific) using the mMESSAGE mMACHINE T7 Ultra kit (Invitrogen) followed by purification using MEGAclear Transcription Cleanup kit (Invitrogen). mRNA was transfected using the Mirus TransIT mRNA kit (Mirus Bio LLC) according to the manufacturer’s instructions. The transfected macrophages were challenged with Zymosan A Bioparticle Alexa Fluor 594 conjugate (Z23374; Molecular Probes, Life Technologies) at 2 µg per well for 6 h. The samples were washed with PBS and fixed with 4% paraformaldehyde for 30 min. Immunostaining was done overnight using the primary antibodies listed above; the secondary antibody (Molecular Probes A31556 or Abcam ab175664) was conjugated to Alexa Fluor 405. The samples were coated with Prolong Diamond Antifade (Molecular Probes, Life Technologies). Images were captured using a Nikon Eclipse Ti confocal microscope (Nikon Instruments Inc.) equipped with a 60× apochromat oil-objective lens. Image acquisition and analysis were done using NIS-Elements version 4.40 (Nikon). Briefly, a region of interest (ROI) was drawn around each zymosan particle, and the fluorescence intensity was measured using the ROI statistics tool in the software. For reproduced images, alterations were applied equally to control and CpsA-transfected samples. Alexa 405 images were pseudocolored green.
To assess whether transfection of CpsA reduced NADPH oxidase recruitment to ΔcpsA mutant phagosomes, RAW264.7 cells were seeded in 96-well plates (µ-Plate 96 well; ibidi GmbH). The cells were transfected at 250 ng per well with mRNA expressing either CpsA-GFP or CAT-GFP (control). mRNA was generated and transfected as described above. Twenty-four hours posttransfection, macrophages were infected with PKH-26 red fluorescent-labeled H37Rv and ΔcpsA (PKH-26; Sigma) at a MOI of 10. After 3 h, macrophages were washed and fixed with 1% paraformaldehyde/PBS overnight. Immunostaining was performed using the primary antibodies listed above and secondary antibodies conjugated to Alexa Fluor 405 (Molecular Probes). Images were acquired and analyzed as described above for the zymosan assay.
Intracellular Bacterial Survival Assays.
To assess Mtb survival in vitro, 6 × 10⁴ BMDMs from C57BL/6 mice (unless otherwise specified) were seeded 1 d before infection and infected with a single-cell suspension of Mtb (H37Rv, ΔcpsA, ΔcpsA::cpsA, or ΔkatG) at a MOI of ∼3 as previously described (24). At 4 hpi, macrophages were washed three times and at the indicated time points were lysed with 0.1% Triton X-100. Serial dilutions of the lysates were plated on 7H11 agar plates, and cfus were counted 15–21 d later. For activation of naive macrophages, 200 units/mL of IFN-γ (R&D Systems) was added 24 h before infection.
To assess whether transfection of CpsA enhanced the intracellular survival of ΔcpsA, RAW264.7 cells were seeded in 24-well plates and transfected (500 ng per well) with mRNA expressing CpsA, CpsA-GFP, or CAT-GFP (control). mRNA was generated using the mMESSAGE mMACHINE T7 Ultra kit (Invitrogen) followed by purification using the MEGAclear Transcription Cleanup kit (Invitrogen) and transfected using the Mirus TransIT mRNA kit (Mirus Bio LLC) according to the manufacturer’s instructions. Twenty-four hours posttransfection, macrophages were washed twice with PBS and infected with H37Rv and ΔcpsA at a MOI of 10 for 4 h. Infected cells were lysed with 0.1% Triton X-100 in PBS, and bacterial uptake was enumerated at 4 hpi by plating on 7H11-OADC plates. Thirty-six hours postinfection, macrophages were transfected again with 500 ng per well mRNA expressing either CpsA or control. The cfus were enumerated 72 hpi as described above.
Protein Extracts and Western Blotting.
For verification of siRNA-mediated silencing, mammalian cell lysates were prepared 2 d after transfection. Macrophages were removed from culture dishes, washed in PBS, and lysed in RIPA buffer before SDS/PAGE and Western blotting.
For Mtb lysates, the bacilli were grown to an OD580 of 0.8–1.0 in 7H9 medium, washed, and resuspended in Sauton’s medium with 0.05% Tween 80, for 24 h at 37 °C. Cells were pelleted, and the supernatant was filtered through a 0.22-μm filter. To precipitate proteins from the culture filtrate (CF), 10% trichloroacetic acid (TCA) was added to CF overnight at 4 °C. Precipitated proteins were pelleted at 15,000 × g for 30 min, washed with acetone, air-dried, and resuspended in SDS sample buffer. Bacterial pellets were resuspended in lysis buffer containing 25 mM Tris⋅HCl (pH 7.5), 150 mM NaCl, and 0.6% SDS. The bacteria were lysed by bead beating with 0.1-mm zirconia/silica beads (BiosSpec Products, Inc.). SDS sample buffer was added, and samples were incubated at 90 °C for 30 min before SDS/PAGE.
Mass Spectrometry.
For mass spectrometry-based label-free quantitation of the CF, triplicate samples of H37Rv, ΔcpsA, and ΔcpsA::cpsA were digested as described in ref. 59, and the resulting peptide mixtures were desalted as previously described (60). Aliquots of the peptide mixtures were gradient eluted, using an Easy nLC 1000, directly into an Orbitrap Fusion mass spectrometer (Thermo Fisher Scientific) and were analyzed in a data-dependent manner using a top-speed method. The MaxQuant software suite (version 1.5.2.8) was used for peptide and protein identifications and label-free quantitation (61) with a UniProt H37Rv protein database containing 3,994 entries downloaded on August 31, 2015. For the first search, the peptide tolerance was set to 20 ppm, and for the main search peptide tolerance was 4.5 ppm. Trypsin-specific cleavage was selected with two missed cleavages. A peptide spectral match (PSM) FDR of 1% and a protein FDR of 1% were selected for identification. Label-free quantitation was performed with a minimum ratio of 2 and allowing for unique peptides only. Matching between runs was allowed with a 0.7-min match window and a 20-min alignment time window. Carbamidomethylation of Cys was added as a static modification. Oxidation of Met, deamidation of Asn and Gln, and acetylation of the protein N terminus were allowed as variable modifications. Results were filtered to include proteins identified with two or more unique peptides in all three replicates of one strain type. Label-free quantitation intensity values were log2 transformed, missing values were imputed from the normal data distribution, and a two-sided Student’s t test was performed correcting for multiple testing by controlling for FDR at 5%. Proteins with a q value (FDR corrected P value) <0.05 were considered significant.
Lysozyme, Hydrogen Peroxide, Nitric Oxide, and SDS Treatment.
Mtb were grown to midlog phase, centrifuged at 3,000 × g for 5 min, and washed with 7H9 medium. Subsequently a low-spin centrifugation was performed at 450 × g for 5 min to remove bacterial clumps. The bacterial number was adjusted to 5 × 10⁵ cfu/mL in 7H9 medium. Susceptibility to ROS was tested by incubation at 37 °C with daily addition of 200 μM diethylenetriamine NONOate (DETA-NO; Cayman Chemicals) for 3 d. Hydrogen peroxide susceptibility was tested by incubation with 5 mM H2O2 and plating dilutions over the course of 3 h. Dilutions were plated on 7H11 agar plates. Lysozyme susceptibility was determined as previously described (62). Briefly, Mtb strains were plated onto 7H11 agar plates containing 2, 4, or 6 mg/mL hen egg lysozyme (Sigma). To test SDS tolerance, serial dilutions were plated on 7H11 agar with and without 0.005% or 0.01% SDS. The cfu numbers are expressed as percent survival by normalizing the output cfus to the mean number of input cfus, multiplied by 100.
In Vivo Bacterial Infection.
Mice (8–15 wk old) were infected by aerosol with Mtb using the Glas-Col inhalation exposure system as previously described (63). Male and female mice were used except in the Nox2-KO experiments, in which hemizygous mutant males were compared with WT males. Based upon the variance we observe, three mice are sufficient to detect a half-log increase in ΔcpsA mutant cfus in the lungs at early time points (P < 0.05; power = 0.80). Before aerosilization, Mtb cultures were pelleted and resuspended in PBS containing 0.5% Tween 80. A centrifugation step for 8 min at 120 × g yielded a single-cell suspension. Bacteria were diluted in 10 mL of sterile water, and 5 mL were loaded into the inhalation exposure nebulizer unit to deliver ∼100 cfus per animal, except in the case of SCID mice, to which ∼20 cfu were delivered. The dose of infection was confirmed on day 1 postinfection by plating whole-lung homogenates from three mice on Middlebrook 7H11 agar. SCID mice were followed for survival over time. For all other experiments, mice were euthanized at given time points. In some experiments the left lung was excised, fixed in 10% buffered formalin for 7 d at 4 °C, then embedded in paraffin and stained with H&E, and the right lung was homogenized in PBS containing 0.5% Tween 80 through a 70-μm cell strainer (BD Falcon). Alternatively, both the right and left lungs were homogenized as described above. Serial dilutions of the lung homogenates were plated on 7H11 Middlebrook agar to quantify the bacterial load.
IL-1β Quantification.
BMDMs were infected with Mtb at an MOI of 5 and were washed at 4 hpi. Supernatants were collected after 4 and 24 h and were filtered using SpinX columns. IL-1β was measured by ELISA according to the manufacturer’s instructions (eBioscience).
RNA-Seq.
BMDMs were seeded at 1.6 × 10⁶ cells per well in a six-well plate 1 d before infection. Cells were uninfected or infected with H37Rv or ΔcpsA using a MOI of 4 in triplicate. At 4 hpi, RNA was prepared using the Direct-Zol RNA Mini-Prep Kit (Zymo Research). RNA-seq by poly-A selection was performed by the New York University Genome Technology Center. Data were analyzed by the Genome Technology Access Center (WUSM).
Antibiotic Susceptibility.
Antibiotic susceptibility was determined essentially as described (64). Midlog-phase cultures of Mtb H37Rv and ΔcpsA were used to generate single-cell suspensions at an OD580 of 0.01 in 7H9 medium containing Tween 80. Bacteria were exposed to serial dilutions of antibiotics as indicated. After 3-wk incubation at 37 °C, bacterial growth was assessed by measuring OD580.
Biofilm Formation.
Mtb biofilms were grown essentially as described previously (65). Briefly, H37Rv, ΔcpsA, and ΔcpsA::cpsA were inoculated in 7H9-OADC with 0.05% Tween 80 and grown to an OD600 of 0.8. The bacterial culture was washed twice in PBS and inoculated in minimal Sauton’s medium without Tween 80 at a dilution of 1:100. Then 4.5 mL of the resulting culture was dispensed into each well of a six-well plate. Plates were covered with the lid, wrapped with parafilm, and left undisturbed in a humidified incubator for 5 wk at 37 °C.
Electrospray Ionization LC/MS Profiling of the Major Extractable Cell-Wall Lipids.
Extraction of cell-wall lipids from Mtb H37Rv, ΔcpsA, and ΔcpsA::cpsA was performed as described (66). Bacilli were grown to midlog phase (OD600 ∼0.6–0.8) in 7H9-OADC medium, washed twice with PBS containing 0.05% Tween 80, and inoculated at OD600 of 0.05 in modified Sauton’s medium. The culture was grown at 37 °C until an OD600 of ∼0.8 was reached, after which the culture was harvested, washed with PBS, and spun at 3,700 rpm for 10 min in Eppendorf rotor S-4-104. The bacterial pellet was heated to 100 °C for 30 min. Samples were then extracted twice in chloroform:methanol (2:1) followed by sonication for 5 min and incubation for 1 h. Samples were centrifuged, and the organic phase from two consecutive extractions was separated, pooled, and dried under nitrogen gas. Lipids were resuspended in chloroform:methanol (2:1), and analysis was conducted on a Thermo Fisher Scientific TSQ Vantage mass spectrometer with a Thermo Accela UPLC operated by Xcalibur software. Separation of lipid was achieved by a Supelco 100 × 2.1 mm (2.7-μm particle size) Ascentis C-8 column at a flow rate of 260 μL/min as described previously (66). The electrospray ionization (ESI) mass spectra were acquired in both positive-ion and negative-ion modes, ranging from m/z 400–3,000, at a scan rate of scan/2 s, and the ESI mass spectra of each of the major lipid classes were obtained.
Acknowledgments
We thank M. Dinauer (WUSM), H. W. Virgin (WUSM), D. Young (St. Jude’s Children’s Research Hospital), N. Mizushima (University of Tokyo), A. Yamamoto (Columbia University), and K. Cadwell (NYU SOM) for their generosity in providing mice; W. Jacobs, Jr. (Albert Einstein College of Medicine) for the ΔkatG strain; BEI Resources for the anti-KatG antibody; J. Ernst (NYU SOM) for the anti-Ag85 antibody; M. Dinauer, H. W. Virgin, L. D. Sibley (WUSM), A. C. M. Boon (WUSM), and members of the J.A.P. laboratory for useful discussions and helpful comments on the manuscript; Jessica Chapman-Lim and Beatrix Ueberheide (NYU Proteomics Laboratory) for assistance with mass spectrometry; and Eric Tycksen and the Genome Technology Access Center (GTAC) in the Department of Genetics at WUSM for help with genomic analysis and violin plots. The work was supported by funding from the Potts Memorial Foundation (S.K.), Stony Wold-Herbert Fund (S.K.), NIH/NIAID Grant AI119670 (to M.J.), NIH/NIAID Grants AI107774 and AI064282 (to C.M.S.), NIH/NIAID Grant AI130454 (to J.A.P.), and by NYU SOM and WUSM. The protein mass spectrometry experiments were supported by NIH Shared Instrumentation Grant 1S10OD010582. Development of mice used in this publication was supported by NIH/NIAID Center of Excellence in Translational Research Award Number U19AI109725. The GTAC is partially supported by National Cancer Institute Cancer Center Support Grant P30 CA91842, Institute of Clinical and Translational Sciences/Clinical and Translational Science Award Grant UL1TR000448 from the National Center for Research Resources, and NIH Roadmap for Medical Research.
Footnotes
The authors declare no conflict of interest.
This article is a PNAS Direct Submission.
This article contains supporting information online at www.pnas.org/lookup/suppl/doi:10.1073/pnas.1707792114/-/DCSupplemental.
References
- 1.Stanley SA, Cox JS. Host-pathogen interactions during Mycobacterium tuberculosis infections. Curr Top Microbiol Immunol. 2013;374:211–241. doi: 10.1007/82_2013_332. [DOI] [PubMed] [Google Scholar]
- 2.Cemma M, Brumell JH. Interactions of pathogenic bacteria with autophagy systems. Curr Biol. 2012;22:R540–R545. doi: 10.1016/j.cub.2012.06.001. [DOI] [PubMed] [Google Scholar]
- 3.Huang J, Brumell JH. Bacteria-autophagy interplay: A battle for survival. Nat Rev Microbiol. 2014;12:101–114. doi: 10.1038/nrmicro3160. [DOI] [PMC free article] [PubMed] [Google Scholar]
- 4.Martinez J, et al. Molecular characterization of LC3-associated phagocytosis reveals distinct roles for Rubicon, NOX2 and autophagy proteins. Nat Cell Biol. 2015;17:893–906. doi: 10.1038/ncb3192. [DOI] [PMC free article] [PubMed] [Google Scholar] [Retracted]
- 5.Mehta P, Henault J, Kolbeck R, Sanjuan MA. Noncanonical autophagy: One small step for LC3, one giant leap for immunity. Curr Opin Immunol. 2014;26:69–75. doi: 10.1016/j.coi.2013.10.012. [DOI] [PubMed] [Google Scholar]
- 6.Castillo EF, et al. Autophagy protects against active tuberculosis by suppressing bacterial burden and inflammation. Proc Natl Acad Sci USA. 2012;109:E3168–E3176. doi: 10.1073/pnas.1210500109. [DOI] [PMC free article] [PubMed] [Google Scholar]
- 7.Gutierrez MG, et al. Autophagy is a defense mechanism inhibiting BCG and Mycobacterium tuberculosis survival in infected macrophages. Cell. 2004;119:753–766. doi: 10.1016/j.cell.2004.11.038. [DOI] [PubMed] [Google Scholar]
- 8.Kimmey JM, et al. Unique role for ATG5 in neutrophil-mediated immunopathology during M. tuberculosis infection. Nature. 2015;528:565–569. doi: 10.1038/nature16451. [DOI] [PMC free article] [PubMed] [Google Scholar]
- 9.Kumar D, et al. Genome-wide analysis of the host intracellular network that regulates survival of Mycobacterium tuberculosis. Cell. 2010;140:731–743. doi: 10.1016/j.cell.2010.02.012. [DOI] [PubMed] [Google Scholar]
- 10.Manzanillo PS, et al. The ubiquitin ligase parkin mediates resistance to intracellular pathogens. Nature. 2013;501:512–516. doi: 10.1038/nature12566. [DOI] [PMC free article] [PubMed] [Google Scholar]
- 11.Sakowski ET, et al. Ubiquilin 1 promotes IFN-γ-induced xenophagy of Mycobacterium tuberculosis. PLoS Pathog. 2015;11:e1005076. doi: 10.1371/journal.ppat.1005076. [DOI] [PMC free article] [PubMed] [Google Scholar]
- 12.Watson RO, et al. The cytosolic sensor cGAS detects Mycobacterium tuberculosis DNA to induce type I interferons and activate autophagy. Cell Host Microbe. 2015;17:811–819. doi: 10.1016/j.chom.2015.05.004. [DOI] [PMC free article] [PubMed] [Google Scholar]
- 13.Watson RO, Manzanillo PS, Cox JS. Extracellular M. tuberculosis DNA targets bacteria for autophagy by activating the host DNA-sensing pathway. Cell. 2012;150:803–815. doi: 10.1016/j.cell.2012.06.040. [DOI] [PMC free article] [PubMed] [Google Scholar]
- 14.Ouimet M, et al. Mycobacterium tuberculosis induces the miR-33 locus to reprogram autophagy and host lipid metabolism. Nat Immunol. 2016;17:677–686. doi: 10.1038/ni.3434. [DOI] [PMC free article] [PubMed] [Google Scholar]
- 15.Romagnoli A, et al. ESX-1 dependent impairment of autophagic flux by Mycobacterium tuberculosis in human dendritic cells. Autophagy. 2012;8:1357–1370. doi: 10.4161/auto.20881. [DOI] [PMC free article] [PubMed] [Google Scholar]
- 16.Saini NK, et al. Suppression of autophagy and antigen presentation by Mycobacterium tuberculosis PE_PGRS47. Nat Microbiol. 2016;1:16133. doi: 10.1038/nmicrobiol.2016.133. [DOI] [PMC free article] [PubMed] [Google Scholar]
- 17.Shin DM, et al. Mycobacterium tuberculosis eis regulates autophagy, inflammation, and cell death through redox-dependent signaling. PLoS Pathog. 2010;6:e1001230. doi: 10.1371/journal.ppat.1001230. [DOI] [PMC free article] [PubMed] [Google Scholar]
- 18.Chan YG, Kim HK, Schneewind O, Missiakas D. The capsular polysaccharide of Staphylococcus aureus is attached to peptidoglycan by the LytR-CpsA-Psr (LCP) family of enzymes. J Biol Chem. 2014;289:15680–15690. doi: 10.1074/jbc.M114.567669. [DOI] [PMC free article] [PubMed] [Google Scholar]
- 19.Eberhardt A, et al. Attachment of capsular polysaccharide to the cell wall in Streptococcus pneumoniae. Microb Drug Resist. 2012;18:240–255. doi: 10.1089/mdr.2011.0232. [DOI] [PubMed] [Google Scholar]
- 20.Kawai Y, et al. A widespread family of bacterial cell wall assembly proteins. EMBO J. 2011;30:4931–4941. doi: 10.1038/emboj.2011.358. [DOI] [PMC free article] [PubMed] [Google Scholar]
- 21.Grzegorzewicz AE, et al. Assembling of the Mycobacterium tuberculosis cell wall core. J Biol Chem. 2016;291:18867–18879. doi: 10.1074/jbc.M116.739227. [DOI] [PMC free article] [PubMed] [Google Scholar]
- 22.Harrison J, et al. Lcp1 is a phosphotransferase responsible for ligating arabinogalactan to peptidoglycan in Mycobacterium tuberculosis. MBio. 2016;7:e00972-16. doi: 10.1128/mBio.00972-16. [DOI] [PMC free article] [PubMed] [Google Scholar]
- 23.McGuire AM, et al. Comparative analysis of Mycobacterium and related actinomycetes yields insight into the evolution of Mycobacterium tuberculosis pathogenesis. BMC Genomics. 2012;13:120. doi: 10.1186/1471-2164-13-120. [DOI] [PMC free article] [PubMed] [Google Scholar]
- 24.Mehra A, et al. Mycobacterium tuberculosis type VII secreted effector EsxH targets host ESCRT to impair trafficking. PLoS Pathog. 2013;9:e1003734. doi: 10.1371/journal.ppat.1003734. [DOI] [PMC free article] [PubMed] [Google Scholar]
- 25.de Souza GA, Leversen NA, Målen H, Wiker HG. Bacterial proteins with cleaved or uncleaved signal peptides of the general secretory pathway. J Proteomics. 2011;75:502–510. doi: 10.1016/j.jprot.2011.08.016. [DOI] [PubMed] [Google Scholar]
- 26.de Souza GA, et al. High accuracy mass spectrometry analysis as a tool to verify and improve gene annotation using Mycobacterium tuberculosis as an example. BMC Genomics. 2008;9:316. doi: 10.1186/1471-2164-9-316. [DOI] [PMC free article] [PubMed] [Google Scholar]
- 27.Målen H, Berven FS, Fladmark KE, Wiker HG. Comprehensive analysis of exported proteins from Mycobacterium tuberculosis H37Rv. Proteomics. 2007;7:1702–1718. doi: 10.1002/pmic.200600853. [DOI] [PubMed] [Google Scholar]
- 28.Tumbarello DA, et al. The autophagy receptor TAX1BP1 and the molecular motor myosin VI are required for clearance of Salmonella Typhimurium by autophagy. PLoS Pathog. 2015;11:e1005174. doi: 10.1371/journal.ppat.1005174. [DOI] [PMC free article] [PubMed] [Google Scholar]
- 29.von Muhlinen N, Thurston T, Ryzhakov G, Bloor S, Randow F. NDP52, a novel autophagy receptor for ubiquitin-decorated cytosolic bacteria. Autophagy. 2010;6:288–289. doi: 10.4161/auto.6.2.11118. [DOI] [PubMed] [Google Scholar]
- 30.Harris J, et al. T helper 2 cytokines inhibit autophagic control of intracellular Mycobacterium tuberculosis. Immunity. 2007;27:505–517. doi: 10.1016/j.immuni.2007.07.022. [DOI] [PubMed] [Google Scholar]
- 31.Matsuzawa T, et al. IFN-γ elicits macrophage autophagy via the p38 MAPK signaling pathway. J Immunol. 2012;189:813–818. doi: 10.4049/jimmunol.1102041. [DOI] [PMC free article] [PubMed] [Google Scholar]
- 32.Philips JA, Porto MC, Wang H, Rubin EJ, Perrimon N. ESCRT factors restrict mycobacterial growth. Proc Natl Acad Sci USA. 2008;105:3070–3075. doi: 10.1073/pnas.0707206105. [DOI] [PMC free article] [PubMed] [Google Scholar]
- 33.Portal-Celhay C, et al. Mycobacterium tuberculosis EsxH inhibits ESCRT-dependent CD4(+) T-cell activation. Nat Microbiol. 2016;2:16232. doi: 10.1038/nmicrobiol.2016.232. [DOI] [PMC free article] [PubMed] [Google Scholar]
- 34.Collins AC, et al. Cyclic GMP-AMP synthase is an innate immune DNA sensor for Mycobacterium tuberculosis. Cell Host Microbe. 2015;17:820–828. doi: 10.1016/j.chom.2015.05.005. [DOI] [PMC free article] [PubMed] [Google Scholar]
- 35.Manzanillo PS, Shiloh MU, Portnoy DA, Cox JS. Mycobacterium tuberculosis activates the DNA-dependent cytosolic surveillance pathway within macrophages. Cell Host Microbe. 2012;11:469–480. doi: 10.1016/j.chom.2012.03.007. [DOI] [PMC free article] [PubMed] [Google Scholar]
- 36.Wassermann R, et al. Mycobacterium tuberculosis differentially activates cGAS- and inflammasome-dependent intracellular immune responses through ESX-1. Cell Host Microbe. 2015;17:799–810. doi: 10.1016/j.chom.2015.05.003. [DOI] [PubMed] [Google Scholar]
- 37.Matsunaga K, et al. Two Beclin 1-binding proteins, Atg14L and Rubicon, reciprocally regulate autophagy at different stages. Nat Cell Biol. 2009;11:385–396. doi: 10.1038/ncb1846. [DOI] [PubMed] [Google Scholar]
- 38.Yang CS, et al. Autophagy protein Rubicon mediates phagocytic NADPH oxidase activation in response to microbial infection or TLR stimulation. Cell Host Microbe. 2012;11:264–276. doi: 10.1016/j.chom.2012.01.018. [DOI] [PMC free article] [PubMed] [Google Scholar]
- 39.Ng VH, Cox JS, Sousa AO, MacMicking JD, McKinney JD. Role of KatG catalase-peroxidase in mycobacterial pathogenesis: Countering the phagocyte oxidative burst. Mol Microbiol. 2004;52:1291–1302. doi: 10.1111/j.1365-2958.2004.04078.x. [DOI] [PubMed] [Google Scholar]
- 40.Huang J, et al. Activation of antibacterial autophagy by NADPH oxidases. Proc Natl Acad Sci USA. 2009;106:6226–6231. doi: 10.1073/pnas.0811045106. [DOI] [PMC free article] [PubMed] [Google Scholar]
- 41.Casbon AJ, Allen LA, Dunn KW, Dinauer MC. Macrophage NADPH oxidase flavocytochrome B localizes to the plasma membrane and Rab11-positive recycling endosomes. J Immunol. 2009;182:2325–2339. doi: 10.4049/jimmunol.0803476. [DOI] [PMC free article] [PubMed] [Google Scholar]
- 42.Nunes P, Demaurex N, Dinauer MC. Regulation of the NADPH oxidase and associated ion fluxes during phagocytosis. Traffic. 2013;14:1118–1131. doi: 10.1111/tra.12115. [DOI] [PubMed] [Google Scholar]
- 43.Sun J, et al. Mycobacterium tuberculosis nucleoside diphosphate kinase inactivates small GTPases leading to evasion of innate immunity. PLoS Pathog. 2013;9:e1003499. doi: 10.1371/journal.ppat.1003499. [DOI] [PMC free article] [PubMed] [Google Scholar]
- 44.Akoumianaki T, et al. Aspergillus cell wall melanin blocks LC3-associated phagocytosis to promote pathogenicity. Cell Host Microbe. 2016;19:79–90. doi: 10.1016/j.chom.2015.12.002. [DOI] [PubMed] [Google Scholar]
- 45.Matte C, et al. Leishmania major promastigotes evade LC3-associated phagocytosis through the action of GP63. PLoS Pathog. 2016;12:e1005690. doi: 10.1371/journal.ppat.1005690. [DOI] [PMC free article] [PubMed] [Google Scholar]
- 46.Keith KE, Hynes DW, Sholdice JE, Valvano MA. Delayed association of the NADPH oxidase complex with macrophage vacuoles containing the opportunistic pathogen Burkholderia cenocepacia. Microbiology. 2009;155:1004–1015. doi: 10.1099/mic.0.026781-0. [DOI] [PubMed] [Google Scholar]
- 47.Lam GY, et al. Listeriolysin O suppresses phospholipase C-mediated activation of the microbicidal NADPH oxidase to promote Listeria monocytogenes infection. Cell Host Microbe. 2011;10:627–634. doi: 10.1016/j.chom.2011.11.005. [DOI] [PMC free article] [PubMed] [Google Scholar]
- 48.McCaffrey RL, et al. Multiple mechanisms of NADPH oxidase inhibition by type A and type B Francisella tularensis. J Leukoc Biol. 2010;88:791–805. doi: 10.1189/jlb.1209811. [DOI] [PMC free article] [PubMed] [Google Scholar]
- 49.Siemsen DW, Kirpotina LN, Jutila MA, Quinn MT. Inhibition of the human neutrophil NADPH oxidase by Coxiella burnetii. Microbes Infect. 2009;11:671–679. doi: 10.1016/j.micinf.2009.04.005. [DOI] [PMC free article] [PubMed] [Google Scholar]
- 50.Deffert C, Cachat J, Krause KH. Phagocyte NADPH oxidase, chronic granulomatous disease and mycobacterial infections. Cell Microbiol. 2014;16:1168–1178. doi: 10.1111/cmi.12322. [DOI] [PubMed] [Google Scholar]
- 51.Wang Q, et al. CpsA, a LytR-CpsA-Psr family protein in Mycobacterium marinum, is required for cell wall integrity and virulence. Infect Immun. 2015;83:2844–2854. doi: 10.1128/IAI.03081-14. [DOI] [PMC free article] [PubMed] [Google Scholar]
- 52.Segal BH, Grimm MJ, Khan AN, Han W, Blackwell TS. Regulation of innate immunity by NADPH oxidase. Free Radic Biol Med. 2012;53:72–80. doi: 10.1016/j.freeradbiomed.2012.04.022. [DOI] [PMC free article] [PubMed] [Google Scholar]
- 53.Wu C, et al. Lethality of sortase depletion in Actinomyces oris caused by excessive membrane accumulation of a surface glycoprotein. Mol Microbiol. 2014;94:1227–1241. doi: 10.1111/mmi.12780. [DOI] [PMC free article] [PubMed] [Google Scholar]
- 54.Li F, Gao B, Xu W, Chen L, Xiong S. The defect in autophagy induction by clinical isolates of Mycobacterium tuberculosis is correlated with poor tuberculosis outcomes. PLoS One. 2016;11:e0147810. [Google Scholar]
- 55.Romero MM, et al. Outbreaks of Mycobacterium tuberculosis MDR strains differentially induce neutrophil respiratory burst involving lipid rafts, p38 MAPK and Syk. BMC Infect Dis. 2014;14:262. doi: 10.1186/1471-2334-14-262. [DOI] [PMC free article] [PubMed] [Google Scholar]
- 56.Murphy KC, Papavinasasundaram K, Sassetti CM. Mycobacterial recombineering. Methods Mol Biol. 2015;1285:177–199. doi: 10.1007/978-1-4939-2450-9_10. [DOI] [PubMed] [Google Scholar]
- 57.van Kessel JC, Hatfull GF. Recombineering in Mycobacterium tuberculosis. Nat Methods. 2007;4:147–152. doi: 10.1038/nmeth996. [DOI] [PubMed] [Google Scholar]
- 58.Banaiee N, Kincaid EZ, Buchwald U, Jacobs WR, Jr, Ernst JD. Potent inhibition of macrophage responses to IFN-gamma by live virulent Mycobacterium tuberculosis is independent of mature mycobacterial lipoproteins but dependent on TLR2. J Immunol. 2006;176:3019–3027. doi: 10.4049/jimmunol.176.5.3019. [DOI] [PubMed] [Google Scholar]
- 59.Tufariello JM, et al. Separable roles for Mycobacterium tuberculosis ESX-3 effectors in iron acquisition and virulence. Proc Natl Acad Sci USA. 2016;113:E348–E357. doi: 10.1073/pnas.1523321113. [DOI] [PMC free article] [PubMed] [Google Scholar]
- 60.Cotto-Rios XM, Békés M, Chapman J, Ueberheide B, Huang TT. Deubiquitinases as a signaling target of oxidative stress. Cell Rep. 2012;2:1475–1484. doi: 10.1016/j.celrep.2012.11.011. [DOI] [PMC free article] [PubMed] [Google Scholar]
- 61.Cox J, et al. Accurate proteome-wide label-free quantification by delayed normalization and maximal peptide ratio extraction, termed MaxLFQ. Mol Cell Proteomics. 2014;105:2513–2526. doi: 10.1074/mcp.M113.031591. [DOI] [PMC free article] [PubMed] [Google Scholar]
- 62.Rengarajan J, et al. Mycobacterium tuberculosis Rv2224c modulates innate immune responses. Proc Natl Acad Sci USA. 2008;105:264–269. doi: 10.1073/pnas.0710601105. [DOI] [PMC free article] [PubMed] [Google Scholar]
- 63.Wolf AJ, et al. Mycobacterium tuberculosis infects dendritic cells with high frequency and impairs their function in vivo. J Immunol. 2007;179:2509–2519. doi: 10.4049/jimmunol.179.4.2509. [DOI] [PubMed] [Google Scholar]
- 64.Vandal OH, et al. Acid-susceptible mutants of Mycobacterium tuberculosis share hypersusceptibility to cell wall and oxidative stress and to the host environment. J Bacteriol. 2009;191:625–631. doi: 10.1128/JB.00932-08. [DOI] [PMC free article] [PubMed] [Google Scholar]
- 65.Ojha A, et al. GroEL1: A dedicated chaperone involved in mycolic acid biosynthesis during biofilm formation in mycobacteria. Cell. 2005;123:861–873. doi: 10.1016/j.cell.2005.09.012. [DOI] [PubMed] [Google Scholar]
- 66.Flentie KN, Stallings CL, Turk J, Minnaard AJ, Hsu FF. Characterization of phthiocerol and phthiodiolone dimycocerosate esters of M. tuberculosis by multiple-stage linear ion-trap MS. J Lipid Res. 2016;57:142–155. doi: 10.1194/jlr.D063735. [DOI] [PMC free article] [PubMed] [Google Scholar]
- 67.Jain M, et al. Lipidomics reveals control of Mycobacterium tuberculosis virulence lipids via metabolic coupling. Proc Natl Acad Sci USA. 2007;104:5133–5138. doi: 10.1073/pnas.0610634104. [DOI] [PMC free article] [PubMed] [Google Scholar]


