Significance
The hippocampal area Cornu Ammonis (CA) CA2 is a small region interposed between CA1 and CA3. For a long time, there has been a lack of information on the CA2 area’s role in memory formation. This area is innervated by supramammillary axonal fibers that are rich with Substance P (SP), which acts as a neurotransmitter and neuromodulator. We show that SP induces an NMDA receptor- and protein synthesis-dependent potentiation of CA2 synapses that requires kinases such as CaMKIV and PKMζ. The SP-induced effects on Schaffer collateral-CA2 synapses transform entorhinal cortical-CA2 short-term potentiation into long-term potentiation, thereby expressing synaptic tagging and capture, an associative property of neuronal populations that engage in consolidation.
Keywords: long-term potentiation, CA2 region, Substance P, synaptic tagging, social memory
Abstract
The hippocampal area Cornu Ammonis (CA) CA2 is important for social interaction and is innervated by Substance P (SP)-expressing supramammillary (SuM) nucleus neurons. SP exerts neuromodulatory effects on pain processing and central synaptic transmission. Here we provide evidence that SP can induce a slowly developing NMDA receptor- and protein synthesis-dependent potentiation of synaptic transmission that can be induced not only at entorhinal cortical (EC)-CA2 synapses but also at long-term potentiation (LTP)-resistant Schaffer collateral (SC)-CA2 synapses. In addition, SP-induced potentiation of SC-CA2 synapses transforms a short-term potentiation of EC-CA2 synaptic transmission into LTP, consistent with the synaptic tagging and capture hypothesis. Interestingly, this SP-induced potentiation and associative interaction between the EC and SC inputs of CA2 neurons is independent of the GABAergic system. In addition, CaMKIV and PKMζ play a critical role in the SP-induced effects on SC-CA2 and EC-CA2 synapses. Thus, afferents from SuM neurons are ideally situated to prime CA2 synapses for the formation of long-lasting plasticity and associativity.
The hippocampus is a temporal lobe structure important for the formation of spatial and episodic memories. The hippocampus consists of Cornu Ammonis (CA) areas CA1, CA2, and CA3, containing pyramidal neurons and the dentate gyrus, containing granule cells. The CA2 area is a small region interposed between CA1 and CA3. Although its function remained unknown for many years, CA2 has been recently shown to play a critical role in social memory (1, 2) and aggressive behavior (3). Morphologically distinguishable from CA1 neurons based on their larger cell bodies, CA2 pyramidal neurons receive direct inputs from entorhinal cortical (EC) layer II (LII) and CA3 neurons. It is notable that the Schaffer collaterals (SCs) from CA3 neurons form synapses with CA2 neurons that do not express typical activity-dependent long-term potentiation (LTP) (4, 5), a property that is very different than EC-CA2 synapses. This difference is likely a result of the local existence of specific calcium-binding proteins (6), regulator of G protein signaling RGS14 (7), and the complex inhibitory circuits in CA2 compared with the neighboring CA1 and CA3 areas (8, 9).
The CA2 area also receives a number of projections from the hypothalamic supramammillary nucleus (SuM), which express various neuroactive peptides, such as cholecystokinin, Substance P (SP), and vasoactive intestinal polypeptide (8, 9). The SP-expressing SuM fibers terminate specifically at the area CA2 (10). SP is an 11-aa neurotransmitter (11) that has neuromodulatory properties and has been implicated in physiology, disease, and pain (12). It has been reported earlier that bath application of SP modulates synaptic transmission in mouse hippocampal SC-CA1 synapses (13) and enhances the local inhibitory responses in the hippocampus by influencing release of GABA by acting on neurokinin-1 (NK1) receptors (14). SuM activity has been demonstrated with stress (15, 16), but it is unclear whether SP is released from SuM terminals to CA2. In general, the role of SP in regulating plasticity in CA2 pyramidal neurons has not yet been studied.
Late associativity is a unique feature of synaptic networks that leads to strengthening of synaptic inputs that are originally not sufficiently activated to form LTP (17, 18). This process can be induced by learning events that are strong enough to form LTP of synaptic transmission, and the phenomenon is known as synaptic tagging and capture (STC) (17, 19). In the present study, we investigated whether SP can initiate plasticity in SC and EC synapses of rat hippocampal area CA2. We observed that bath application of SP (5 μM) induced a long-lasting slow-onset potentiation of the two different afferent inputs of CA2 pyramidal neurons. Interestingly, the SP-induced plasticity-related proteins (PRPs) from SC-CA2 synapses were able to prime the EC-CA2 synaptic inputs in an STC-dependent manner. In addition, we showed that CaMKIV and PKMζ play critical roles in the SP-induced synaptic plasticity and associativity within the area CA2.
Statistics
The average values of the slope function of field excitatory postsynaptic potentials (fEPSPs) and excitatory postsynaptic currents (EPSCs) per time point (20, 21) were analyzed by Wilcoxon signed-rank test (henceforth “Wilcoxon test”) when compared within the same group (before and after induction of synaptic plasticity). The Mann–Whitney U test was applied when compared between groups. A Student’s t test at the P < 0.05 significance level was used for the analysis of RT-PCR (22) and Western blot results (23, 24). Detailed descriptions of statistical analysis of each experiment are provided in SI Methods and Dataset S1.
SI Methods
Slice Preparation.
For electrophysiology, a total of 244 hippocampal slices were prepared from 124 male Wistar rats (5–7 wk old). All animal procedures were approved by guidelines from the institutional animal care and use committee of the National University of Singapore. Briefly, after anesthetization by using CO2, the rats were decapitated and brains were quickly removed, followed by isolation of the right hippocampus. The hippocampus remained cooled in 4 °C artificial cerebrospinal fluid (aCSF) with (in mM) 124 NaCl, 2.5 KCl, 2 MgCl2, 2 CaCl2, 1.25 NaH2PO4, 26 NaHCO3, and 17 d-glucose equilibrated with 95% O2 and 5% CO2 (Carbogen) (5). The pH of the aCSF was maintained at 7.3. Transverse slices (400 µm) from the right and left hippocampus were prepared by using a manual tissue chopper, transferred onto a nylon net in an interface chamber (Scientific Systems Design), and incubated at 32°C for 3 h. An aCSF flow rate of 1 mL/min and carbogen consumption of 16 L/h were maintained throughout the experiment. The whole process was carried out within 5 min. More details are provided in ref. 21.
Field Potential Recordings.
For most of the experiments, three monopolar lacquer-coated stainless steel electrodes (A-M Systems) were positioned in the hippocampal area CA2. The stimulating electrodes were located in SCs (CA3 → CA2) and cortical fibers (EC → CA2), and the fEPSPs were recorded from the distal dendritic region of the CA2 neurons (Fig. 1C). For the DPCPX experiment, an extra pair of electrodes was used to simultaneously stimulate SC-CA1 synapses and record the fEPSP from the distal dendritic region of CA1 (Fig. S1A). In another experimental paradigm, to compare the SP-induced potentiation in CA1, CA2, and CA3, three stimulating electrodes were used to simultaneously stimulate the SC-CA2, SC-CA1, and MF-CA3 synapses (Fig. 1A). The fEPSPs were recorded distally from CA1, CA2, and CA3 regions. The signals were amplified by a differential amplifier and digitized by using a CED 1401 unit (Cambridge Electronic Design). After the incubation period, an input/output curve (stimulus intensity vs. fEPSP slope) was plotted, and the test stimulus intensity was set to obtain an fEPSP slope of 40% of the maximum amplitude. The independence of the two different synaptic inputs was evaluated by the absence of paired-pulse facilitation (PPF) in a modified cross-input PPF protocol at an interpulse interval of 50 ms. A PPF was observed if the same synaptic input was activated with an interval of 50 ms.
Fig. 1.
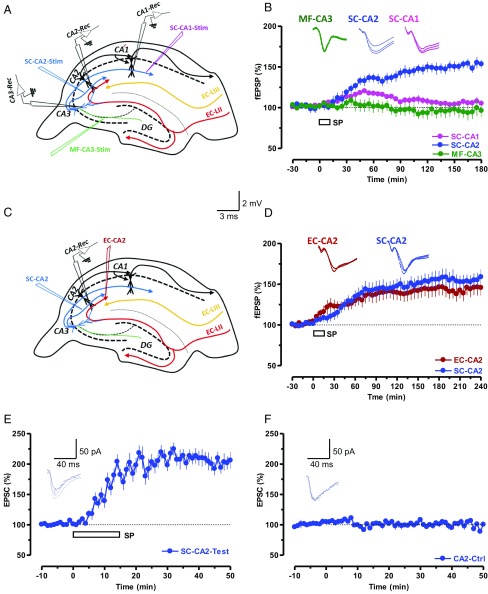
SP induces long-lasting potentiation of synaptic transmission in CA2 neurons. (A) The schema shows the location of electrodes for stimulation of synaptic inputs MF-CA3 (green), SC-CA2 (blue), SC-CA1 (pink), and the recording sites of fEPSPs within the hippocampal CA3, CA2, and CA1 areas. (B) Bath application of 5 µM SP induced a slow-onset, long-lasting potentiation in SC-CA2, but not in MF-CA3 and SC-CA1 synaptic inputs (n = 5). (C) The schema shows the location of electrodes for the stimulation of SC-CA2 (blue) and EC-CA2 (red) synaptic inputs and the recording sites of fEPSPs within the hippocampal CA2 area. (D) Bath application of SP for 15 min after a stable baseline of 30 min induced a synaptic potentiation in SC-CA2 and EC-CA2 synaptic inputs (n = 10). (Insets) Representative fEPSPs 15 min before (closed line), 60 min after (dotted line), and 180 min after (hatched line) SP application. (E) Whole-cell voltage-clamp recording of EPSCs with the application of SP (5 µM) induced a slow-onset potentiation in SC-CA2 (n = 10). (F) Control experiments indicated the stability of the recordings (n = 6). (Insets) Representative EPSC 5 min before (closed line), 30 min after (dotted line), and 50 min after (hatched line) SP application. Calibration bars are 2 mV/3 ms for fEPSP and 50 pA/40 ms for EPSC traces.
Fig. S1.
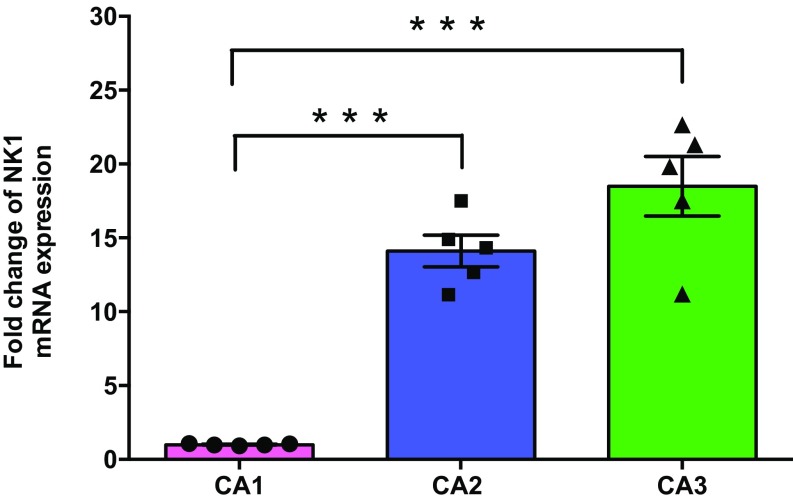
NK1 mRNA expression levels in CA1, CA2, and CA3 of hippocampus: qRT-PCR analysis shows that NK1 mRNA expression is significantly greater in CA2 and CA3 regions compared with the CA1 region (approximately 100 slices from five rats). Significant differences between groups (CA1 vs. CA2 and CA1 vs. CA3) are indicated by ***P < 0.001. Individual data points of fold change are represented within the bar graphs.
A stable baseline was recorded for at least 30 min before the induction of electrical or SP-mediated LTP. To induce an early LTP, WTET, consisting of a single high-frequency stimulation (100 Hz, 21 pulses) was applied, whereas, for L-LTP, STET involving repeated high-frequency stimulations (three trains of 100 Hz, 100 pulses) with an intertrain interval of 10 min was used. More details are provided in ref. 21.
Whole-Cell Voltage-Clamp Recordings.
Whole-cell voltage-clamp recordings of evoked EPSCs were recorded from the soma of visually identified pyramidal neurons (i.e., larger) located within the CA2 region of the hippocampus (20). Patch pipettes (4–6 MΩ) were filled with internal solution containing (in mM) 135 CsMeSO3, 8 NaCl, 10 Hepes, 0.25 EGTA, 2 Mg2ATP, 0.3 Na3GTP, 0.1 spermine, 7 phosphocreatine, and 5 QX-314 (pH 7.3). Series (i.e., access) resistance was within the range of 15–35 M throughout each experiment. Access resistance, membrane resistance, and membrane capacitance were monitored to ensure that the stability and the health of cells were maintained during the experiment. Recordings were considered stable when the membrane resistance, membrane capacitance, and holding current did not change by more than 20%. Neurons were held at a holding potential of −70 mV. The triple patch-clamp EPC10 patch-clamp amplifier and software Patch-master (HEKA Electronics) were used for data acquisition. In addition, a CED 1401 analog-to-digital converter (Cambridge Electronic Design) and a custom-made software program were used to regulate stimulation and to record evoked EPSCs. EPSCs were evoked by stimulation of Schaffer-collateral fibers in the stratum radiatum of CA2 by using a tungsten stimulating electrode (AM Systems). Schaffer collateral projections were stimulated at 0.05 Hz by 200-ms voltage pulses generated by an isolated pulse stimulator (Model 2100; AM Systems). The stimulation strength (2–5 V) was adjusted to evoke EPSCs with amplitude of approximately 50 pA. Basal synaptic current was recorded for at least 10 min before LTP induction.
Pharmacology.
SP (no. 1156; Tocris) was stored at −20 °C as a 2.5-mM stock in deionized water. Before application for 15 min, the stock solution was diluted to a final concentration of 5 µM in aCSF. The compound application time remained constant in all experiments. The protein synthesis inhibitor EME dihydrochloride (E2375; Sigma-Aldrich) was stored at −20 °C as a 20-mM stock solution prepared in deionized water. The stock was diluted to a final concentration of 20 µM in aCSF and applied for a total time period of 60 min, beginning 20 min before STET (Figs. 3 E and F and 5C). In the other group of experiments, the same working concentration of EME (20 µM) was applied 15 min before and after coapplication with SP (total application time, 45 min; Fig. S3C). ANI (no. 1290; Tocris) was stored at −20 °C as 25-mM stock in DMSO and was diluted to a final working concentration of 25 µM in aCSF. Similar to EME, ANI was applied for 60 min, starting 20 min before STET (Fig. 3 C and D), whereas, in another group of experiments, it was applied 15 min before and after coapplication with SP (Fig. S3B). The CaMKIV inhibitor KN-93 (1 mg in solution; no. 422712; Calbiochem) and its corresponding inactive control KN92 (solid; no. 422709; Calbiochem) were stored at −20 °C as a 10-mM stock in DMSO and diluted with aCSF to achieve a final concentration of 10 µM. KN-93 and its control KN-92 were applied 15 min before and after coapplication with SP (total application time, 45 min; Fig. 4 A and B). PKMζ antisense oligonucleotides (5′-C*T*C* TTG GGA AGG CAT *G*A*C-3′) Integrated DNA Technologies (IDT) and its scrambled control (5′-A*A*C*AAT GGG TCG TCT *C*G*G-3′) were stored at −20 °C as 2-mM stocks in 1× Tris-EDTA buffer. Both were diluted in aCSF to obtain a final concentration of 20 µM and applied throughout the experiment (Fig. 4 D and E). A 100-µM stock solution of DPCPX (C101; Sigma-Aldrich), a potent adenosine receptor antagonist, was prepared in DMSO and stored at −20 °C. The final working concentration of DPCPX was 10 nM and was applied for 15 min (Fig. S1C). A 50-mM stock of d-AP5 (no. 0106; Tocris), a competitive NMDA receptor antagonist, was prepared in deionized water and stored at −20 °C. A working solution of 50 µM d-AP5 was made in aCSF and applied 15 min before and after coapplication with SP (total application time, 45 min; Fig. S3A). L-733060 hydrochloride (no. 1145; Tocris) is a potent NK1 receptor antagonist. A stock solution of 5 mM was prepared in deionized water and stored at −20 °C. A final 5-µM working solution was prepared in aCSF and bath-applied 15 min before and further coapplied with SP (total application time, 45 min; Fig. S3D). The GABAA antagonist PTX (100 µM; P1675; Sigma-Aldrich) and the GABAB antagonist CGP 55845 hydrochloride (2 µM; no. 1248; Tocris) were prepared freshly in aCSF before the experiments were conducted (Fig. 5).
Fig. 3.
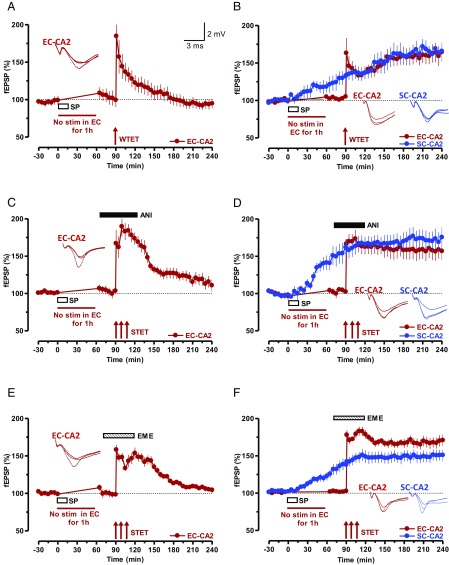
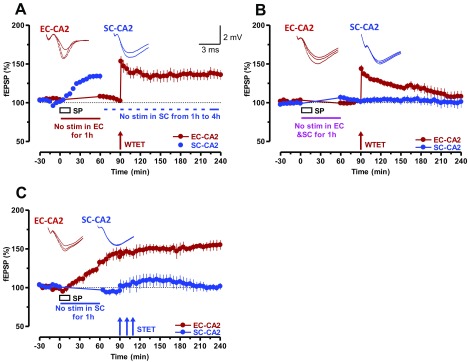
SP initiates STC in SC-CA2 and EC-CA2 synapses. (A) Experiment showing a WTET-induced early LTP in EC-CA2 synaptic inputs. After recording a stable baseline of 30 min, SP was bath-applied for 15 min, during which time the baseline stimulation was suspended for 1 h (n = 7). After that, a baseline was recorded for another 30 min followed by WTET protocol. The potentiation decayed to baseline level within 180 min. (B) STC initiated by SP. Stimulation of EC-CA2 inputs was suspended during the application of SP and, at the 90th minute, WTET was delivered and the SC-CA2 fEPSPs were further recorded. Unlike in A, SP transformed the EC-CA2 fEPSP potentiation into an L-LTP (n = 8). (C and E) Experiments similar to A but with STET protocol was applied at the 90th minute in the presence of protein synthesis inhibitors ANI (25 µM; n = 8; C) or EME (20 µM; n = 8; E). The inhibitors were applied 20 min before STET (i.e., 10 min after resuming the baseline recording) and washed out 40 min after STET of the EC-CA2 input. (D and F) STC experiments in which L-LTP in the EC-CA2 inputs (red circles) was expressed in the presence of protein synthesis inhibitors ANI (25 µM; n = 8; D) or EME (20 µM; n = 9; F) as a result of the capture of previously SP-induced plasticity-relevant proteins. The experimental design was similar to that in B with the exception that, in this case, STET was applied to EC-CA2 inputs at the 90th minute. Representative fEPSP traces 15 min before (closed line), 95 min after (dotted line), and 180 min after (hatched line) SP application or WTET/STET are depicted. Calibration bars for fEPSP traces are 2 mV/3 ms. Arrows indicate the time points of WTET or STET.
Fig. 5.
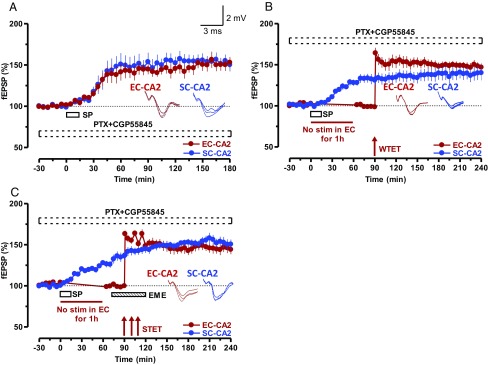
SP-induced potentiation does not require GABAA or GABAB receptors. (A) Inhibitors of GABAA receptors, PTX (100 μM), or of GABAB receptors, CGP55845 (2 μM), were applied together during the entire incubation and recording period. SP was applied for 15 min. Potentiation was intact in SC-EC-CA2 synaptic inputs (n = 6). (B) Similar to the experiments in Fig. 3, STC experiments were carried out in the presence of the same GABAA and GABAB receptor inhibitors during the entire incubation and recording period. Even in the absence of GABAergic transmission, SP-mediated potentiation in SC-CA2 could transform the EC-CA2 fEPSP potentiation into an L-LTP (n = 7). (C) Experimental design was similar to that in Fig. 3F, but the experiment was carried out in the presence of GABAA and GABAB receptor inhibitors during the entire incubation and recording period (n = 6). STC was still observed even without GABAergic transmission. Representative fEPSP traces 15 min before (closed line), 95 min after (dotted line), and 180 min after (hatched line) SP application or WTET/STET are depicted. Calibration bars for fEPSP traces are 2 mV/3 ms.
Fig. S3.
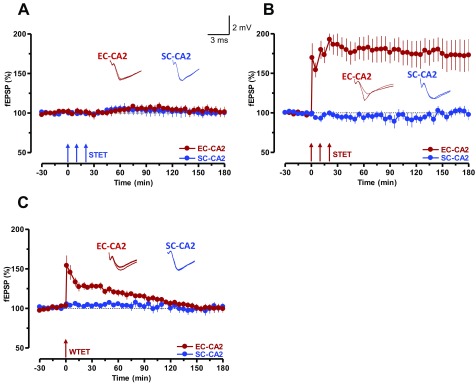
(A) STET did not induce LTP in the SC-CA2 inputs (blue filled circles; n = 7). The fEPSPs of the EC-CA2 input remained stable. (B) STET induced long-lasting input-specific LTP in EC-CA2 inputs (red circles) with stable control potentials in SC-CA2 (blue circles; n = 8). Representative fEPSP traces 15 min before (closed line), 60 min after (dotted line), and 180 min after (hatched line) STET are depicted. (C) Application of WTET in the EC-CA2 input (red circles; n = 7) resulted in an early LTP that decayed to baseline level within 120 min. The baseline responses from the SC-CA2 input were unaffected throughout the recording period. Representative fEPSPs 15 min before (closed line), 5 min after (dotted line), and 180 min after (hatched line) WTET are depicted. Calibration bars are 2 mV/3 ms.
Fig. 4.
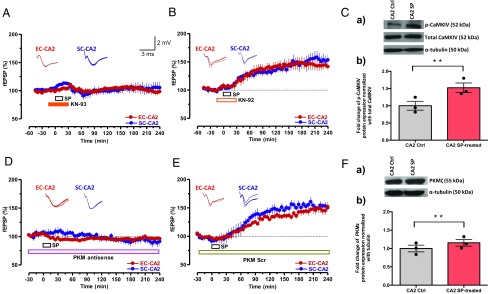
PKMζ and CaMKIV are required for SP-induced plasticity and associativity in CA2 neurons. (A) The CaMKIV inhibitor KN-93 (10 µM) and SP were coapplied as indicated by horizontal bars in the graph (total of 45 min). The coapplication prevented the induction of SP-mediated potentiation in both synaptic inputs (n = 8). (B) Experimental design and drug application similar to that in A except that the nonactive drug KN-92 was used (n = 8). (C, a and b) Western blot analysis showed a significant increase of CaMKIV protein phosphorylation in the CA2 region after SP treatment compared with the respective control. The significant difference between the groups (CA2 control vs. CA2 SP-treated) is indicated by **P < 0.01 (from three biological replicates). Individual data points of fold change are represented within the bar graphs. (D) Preincubation (1.5 h) and continuous application of PKMζ antisense oligodeoxynucleotides (20 μM) for as long as 240 min prevented SP-induced fEPSP potentiation (n = 7). (E) Experimental design similar to that in D except that a scrambled version of PKMζ antisense oligodeoxynucleotides was applied (n = 7). Representative fEPSP traces 15 min before (closed line), 60 min after (dotted line), and 180 min after (hatched line) SP application are depicted. Calibration bars for fEPSP traces are 2 mV/3 ms. (F, a and b) Western blot analysis of PKMζ protein expression also showed a significant up-regulation in CA2 region after SP treatment compared with control. The significant difference between the groups (CA2 control vs. CA2 SP-treated) is indicated by **P < 0.01 (from three biological replicates). Individual data points of fold change are represented within the bar graphs.
Sample Collection for Gene and Protein Expression Analysis.
Approximately 60 slices from three biological samples (three male Wistar rats, 5–7 wk old) were prepared from right and left hippocampi for CaMKIV and PKMζ gene and protein expression analysis (n = 3). For NK1 gene expression analysis, approximately 100 slices from five biological samples were used (n = 5).
RNA Extraction and Real-Time Quantitative RT-PCR.
To assess the relative expression of NK1 mRNA (Fig. S1), the whole hippocampus was isolated and snap-frozen in liquid nitrogen. After this, CA1, CA2, and CA3 regions were isolated under a dissection microscope at 4 °C from the frozen hippocampus, manually prepared by perpendicular cuts along the septal–temporal axis of the hippocampus. The CA2 region from naïve rat control was also prepared in the same way (Fig. S6). To validate the relative mRNA expression of CaMKIV and PKMζ (Fig. S6), the control slices and SP-treated slices were snap-frozen immediately after electrophysiology recording, i.e., after 240 min, and CA2 regions were isolated carefully under a dissection microscope at 4 °C.
Fig. S6.
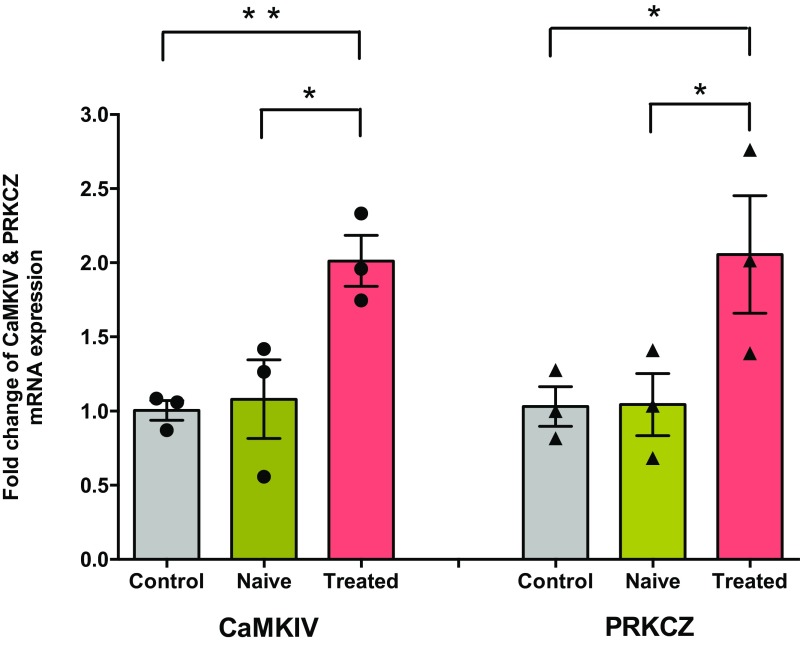
CaMKIV and PRKCZ mRNA expression levels in the CA2 region of hippocampus after SP treatment: qRT PCR analysis shows that CaMKIV and PRKCZ mRNA expression were significantly increased in the CA2 region of hippocampus after SP treatment compared with untreated control slices and snap-frozen rat hippocampus. Significant difference between groups (control vs. SP-treated, naïve rat hippocampus vs. SP-treated) are indicated by *P < 0.05 or **P < 0.01 (slices from three biological replicates). Individual data points of fold change are represented within the bar graphs.
Total RNA was extracted by using RNeasy Mini kit (cat. no. 74106; Qiagen) and quantified by using a spectrophotometer (NanoDrop 2000; Thermo Scientific). Following various treatments to the slices, RLT lysis buffer was prepared by adding 10 μL of β-mercaptoethanol per milliliter of RLT buffer. A total of 600 μL of RLT lysis buffer was added to each sample, and a 1-mL syringe was used to homogenize the lysate thoroughly by sucking in and out the lysate. Ethanol 70% was then added to the cell lysate, mixed well, and transferred to the RNeasy spin column. The cell lysate was centrifuged at 10,000 rpm (Rotor FA-45-24-11, Eppendorf Centrifuge 5424 R) at room temperature for 1 min. In the subsequent steps, RW1 and RPE buffers were added to the spin columns to remove the unwanted materials, and flow-through was discarded after each step. In the final step, 20 μL of nuclease-free water was added to the spin column to elute the bound RNA. A spectrophotometer was used to quantify RNA concentration.
cDNA synthesis was carried out by using a GoScript Reverse Transcription System (cat no. A5000; Promega). Briefly, 1 μg of RNA was subjected to preheating with 2 μL Oligo(dT) at 72 °C for 2 min. Reverse transcription was performed at 42 °C for 1 h followed by 95 °C for 5 min. Further, a StepOne Plus real-time PCR system (Applied Biosystems) was used to carry out the quantitative RT-PCR (qRT-PCR) with TaqMan universal PCR master mix (cat. no. 4304437; Thermo Scientific) and TaqMan probes specific for NK1 receptor (NK1/Tacr1, Rn00562004_m1; lot no. 1366947), PKMζ (Prkcz FAM, Rn01520438_m1; lot no. P160302_001 E01), and CaMKIV (Camk4, Rn00664802_m1; lot no. 1594469). The qRT-PCR was performed in 96-well plates with an initial denaturation at 95 °C for 10 min, followed by 40 amplification cycles each of 95°C for 15 s, and 60°C for 1 min. NK1, PKMZ, and CaMKIV gene expressions were measured in duplicate and were normalized with the internal control GAPDH (Gapdh, Rn01775763_g1; lot no. 1523580). Fold changes of NK1, PKMZ, and CaMKIV gene expressions were calculated according to the 2−ΔΔCt method (22).
Western Blot Assay for Protein Quantification.
Analysis of CaMKIV and PKMζ proteins.
To validate the protein expression of CaMKIV and PKMζ (Fig.4 C and F), the control slices and SP-treated slices were snap-frozen immediately after electrophysiology recording, i.e., after 240 min, and the CA2 region was isolated carefully under a dissection microscope at 4 °C. Total protein from the CA2 regions was extracted by using the T-PER Tissue Protein Extraction Kit (no. 78510; Thermo Fisher Scientific), Halt Protease Inhibitor Mixture Kit (no. 78410; Thermo Fisher Scientific). A protein assay kit was used to quantify the protein level in the samples (cat. no. 500–0007; Bio-Rad). Twenty milligrams of protein extracts were separated on 10% SDS-polyacrylamide gels and transferred to polyvinylidene difluoride transfer membranes. The membranes were blocked with 5% nonfat dry milk and incubated with primary antibodies overnight at 4 °C. The primary antibodies used were as follows: rabbit anti-PKMζ (1:500; ab59364; Abcam), rabbit anti-CaMKIV (1:500; ab3557; Abcam), rabbit anti-CaMKIV (phospho T200; 1:500; ab195000; Abcam), and mouse anti-tubulin monoclonal antibody (cat. no. T9026; Sigma-Aldrich). Membranes were incubated with the HRP-conjugated secondary antibody on the following day (cat. no. 7074; Cell Signaling Technology) for 1 h. The immunoproducts were detected by using a chemiluminescence detection system according to the manufacturer’s instructions (Supersignal West Pico HRP detection kit; Pierce Biotechnology) and developed on a film. ImageJ software was used to quantify the optical density of each protein band. Each lane of protein band density was normalized with corresponding nonphosphorylated protein and/or α-tubulin protein density.
Analysis of PKMζ protein in whole hippocampal slices after treatment with pkmζ antisense and scrambled oligodeoxynucleotides.
The procedure followed was same as described earlier (SI Methods, Analysis of CaMKIV and PKMζ proteins) except that whole snap-frozen hippocampal slices were used to quantify PKMζ protein in the samples. The primary antibody used was rabbit anti-PKMζ (1:500; ab59364; Abcam) followed by a treatment with HRP-conjugated secondary antibody (cat. no. 7074; Cell Signaling Technology). ImageJ software was used to quantify the optical density of each protein band. Each lane of protein band density was normalized with the corresponding α-tubulin protein density.
Results
SP Induces NMDA Receptor- and Protein Synthesis-Dependent Long- Lasting Potentiation in the Hippocampal Area CA2.
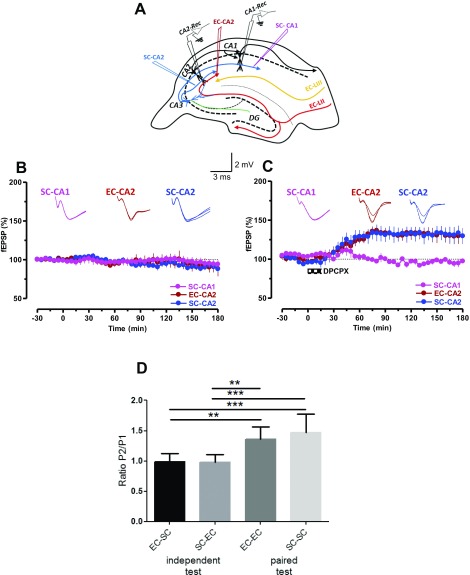
First, we evaluated the distribution of SP receptors (i.e., NK1) in the CA1, CA2, and CA3 regions and observed a higher level of NK1 transcripts in CA2 and CA3 compared with CA1 (Fig. S1). We then investigated if direct application of SP can induce plasticity in areas CA1, CA2, and CA3. By using fEPSP recordings (Fig. 1A) from the CA1, CA2, and CA3 regions at the same time, we observed that bath application of SP (5 µM) for 15 min resulted in a slowly developing long-lasting potentiation of synaptic transmission only in area CA2 (Fig. 1B, blue circles). Statistically significant potentiation was observed in SC-CA2 synapses starting from the 30th minute (Wilcoxon test, P = 0.04) and lasting as long as 3 h (180 min). Neither SC-CA1 (Fig. 1B, pink circles) nor mossy fiber (MF)-CA3 (Fig. 1B, green circles) synapses showed statistically significant potentiation at any recorded time points. An earlier study showed that application of an antagonist of adenosine A1 receptor, 8-cyclopentyl-1, 3-dipropylxanthine (DPCPX), induced plasticity only in area CA2 (25). We confirmed these findings by using a similar simultaneous stimulation and recording of CA2 and CA1 regions of hippocampal slices (Fig. S2A). Indeed, bath application of DPCPX (10 nM) for 15 min induced a slowly developing potentiation in SC-CA2 (Fig. S2C, red circles) and EC-CA2 (Fig. S2C, blue circles) synapses, but not in the CA1 area (pink circles; Fig. S2C). Baseline responses recorded without DPCPX remained stable in all synaptic inputs (Fig. S2B). In addition, electrophysiological investigation by using paired-pulse stimulation between the two inputs (50-ms interstimulus interval; Fig. S2D) confirmed that we recorded from independent SC and EC synaptic inputs in CA2.
Fig. S2.
(A) The relative location of the electrodes to stimulate independent SC-CA2 (blue) and EC-CA2 synaptic inputs (red) to the CA2 neuronal population and the location of additional electrodes to stimulate SC synaptic inputs to CA1-pyramidal neurons (pink) are depicted in the schema. Two recording electrodes were used to record fEPSPs from the CA2 or CA1 area simultaneously. (B) Baseline test stimulation of CA2 and CA1 synapses yielded stable responses throughout the recording period (n = 7). (C) Bath application of a potent and selective antagonist for the adenosine A1 receptor, DPCPX (10 nM), for 15 min induced potentiation in SC-CA2 (blue circles) and EC-CA2 (red circles) synapses but not in the CA1 area (pink circles; n = 8). (D) To test that the stimulation of EC-CA2 and SC-CA2 synapses within individual experiments activated independent synaptic inputs, a paired-pulse stimulation protocol (50-ms interstimulus interval) was used. The synaptic inputs were sequentially activated with SC; then paired EC-SC, EC; then paired SC-EC, paired EC-EC, and paired SC-SC. The bar graph summarizes the ratios for the different pairings. The synaptic inputs were independent because the ratio of EC-SC and SC-EC equals 1 and differed significantly from the facilitation values obtained by the same fiber pairings. Representative fEPSP traces at 15 min (closed line), 60 min (dotted line), and 180 min (hatched line) are depicted. Calibration bars for fEPSP traces are 2 mV/3 ms.
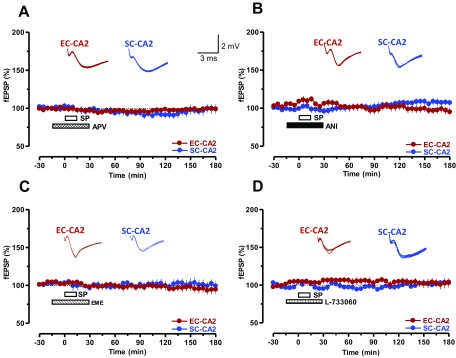
As the focus of the study was on SC-CA2 and EC-CA2, we restricted future recordings to these synapses by using two-pathway experiments (Fig. 1C). It has been noted previously that the SC synapses in area CA2 are resistant to the induction of activity-dependent plasticity such as LTP, whereas EC synapses are not (4, 5). The results presented in Fig. S3 are consistent with earlier findings (4, 5) and provide additional evidence that we were studying the exact CA2 synapses. We further explored the effects of SP on EC-CA2 and SC-CA2 synaptic inputs (Fig. 1D) and noticed that SP could induce a slowly developing potentiation in SC (from the 40th minute; Wilcoxon test, P = 0.008) and EC synapses (from the 30th minute; Wilcoxon test, P = 0.007) that lasted for 4 h (Fig. 1D, blue and red circles). The observed potentiation was found to be NMDA receptor- and protein synthesis-dependent (Fig. S4 A–C), and the potentiation was completely abolished in the presence of SP receptor (i.e., NK1) antagonist L-733060 (5 µM; Fig. S4D). Nonetheless, there is a reasonable possibility that extracellular recording from area CA2 may not be appropriate to monitor fEPSPs from SC and EC that are purely from CA2 because distal dendrites of CA3 pyramidal neurons are very likely to be stimulated with the stimulating electrodes in area CA2. To check this possibility, we conducted whole-cell patch-clamp recordings from CA2 pyramidal neurons (Fig. 1 E and F). Baseline stimulation in SC-CA2 for 10 min followed by bath application of SP for 15 min resulted in a statistically significant potentiation from the seventh minute that lasted as long as 60 min (Wilcoxon test, P = 0.005; Fig. 1E, blue circles), whereas control stimulation without SP resulted in relatively stable potentials throughout the experimental period (Fig. 1F, blue circles).
Fig. S4.
SP-induced potentiation requires NMDA receptor activation and protein synthesis. (A) SP had no effect when NMDA receptors were inhibited by bath application of APV (50 μM, n = 8). The drug was initially applied for 15 min before coapplication with SP for the next 15 min. APV application was continued for an additional 15 min (i.e., total of 45 min APV application; hatched bar). (B and C) Coapplication of the protein synthesis inhibitors ANI (25 μM, n = 7; B) or EME (20 μM, n = 7; C) together with SP abolished the slow-onset potentiation of fEPSPs in both studied synaptic inputs. (D) Application of the NK1 receptor antagonist L-733060 (5 μM) 15 min before and after coapplication with SP similarly impaired the initiation of a slow-onset potentiation in both synaptic inputs: SC-CA2 (blue circles) and EC-CA2 (red circles; n = 7). Representative fEPSP traces 15 min before (closed line), 60 min after (dotted line), and 180 min after (hatched line) SP application are depicted. Calibration bars are 2 mV/3 ms.
Test Stimulation Is Required for the Expression of SP Potentiation.
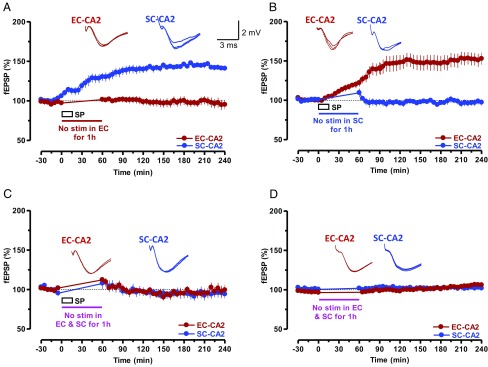
We have reported earlier that test stimulation is critical for expressing dopamine or D1/D5 receptor agonist-induced potentiation (26–28). Suspending test stimulation during dopamine or D1/D5 agonist application prevented the expression of plasticity in those inputs, and we had used those silenced inputs to study the STC interactions. Thus, we tested whether test stimulation during SP application was necessary to express SP-mediated plasticity. A series of experiments was conducted to test the requirements of test stimulations in SP-induced plasticity in SC-CA2 and EC-CA2 synaptic inputs (Fig. 2). In Fig. 2 A and B, SP was applied to the bath medium, but test pulses were suspended in EC-CA2 (Fig. 2A, red circles) or in SC-CA2 (Fig. 2B, blue circles) for the subsequent hour (total of 60 min including the SP application period of 15 min). SP-induced potentiation was not observed in the synaptic inputs that did not receive test stimulation during SP application. The slow onset potentiation observed in SC-CA2 (Fig. 2A, blue circles) and EC-CA2 (Fig. 2B, red circles) was significantly different from the 30th and 20th minutes onward compared with their own baselines (Wilcoxon test, P = 0.017 and P = 0.017). In Fig. 2C, SP was applied to the bath medium, but, in both EC and SC synaptic inputs, the baseline recordings were suspended at the time of SP application and for the subsequent 1 h. In both synaptic inputs, the potentials remained stable at baseline levels, and there was no significant potentiation compared with the respective baseline values before drug application (Wilcoxon test, P > 0.05). The control experiments displayed in Fig. 2D used the same experimental design as in Fig. 2C, but the baseline recordings were suspended for 1 h without SP application. The baseline values in EC-CA2 and SC-CA2 inputs showed stable recordings before and after suspending the test stimulation (Fig. 2D, red and blue circles). In short, test stimulation during SP application is critical for the expression of long-lasting plasticity in SC and EC synaptic inputs.
Fig. 2.
Expression of SP-mediated potentiation requires test stimulation. (A) The potentiation by SP requires test stimulations and is input-specific. Only SC-CA2 synapses, but not the EC-CA2 synapses, showed potentiation when the EC-CA2 test stimulation was suspended at the time of SP application and for a subsequent 1 h (n = 8). (B) In a reverse scenario, i.e., suspension of SC-CA2 test stimulation during and 45 min after drug application, no potentiation was observed in SC-CA2, unlike the case for EC-CA2 synapses, in which potentiation was expressed (n = 7). (C) Suspended baseline stimulation of SC-CA2 and EC-CA2 synaptic inputs at the time of SP application and for a subsequent 1 h prevented potentiation in either synaptic input (n = 8). (D) A control experiment showing no potentiation in SC-CA2 and EC-CA2 synaptic inputs in response to the suspension of baseline stimulation and in the absence of drug application (n = 6). Representative fEPSP traces 15 min before (closed line), 95 min after (dotted line), and 180 min after (hatched line) SP application are depicted. Calibration bars for fEPSP traces in all panels are 2 mV/3 ms.
SP-Induced Plasticity Expresses STC.
According to the STC paradigm, application of a weak stimulation such as a single tetanization [weak tetanization (WTET); Methods] or repeated tetanization [strong tetanization (STET); Methods] in the presence of protein synthesis inhibitors results in only a transient form of plasticity, early LTP. However, this process is able to “mark” the synapses to set “synaptic tags” (17, 18). The synaptic tags can then presumably capture plasticity factors from nearby “strong inputs” [inputs that express protein synthesis-dependent late LTP (L-LTP)], eventually expressing long-lasting plasticity (17, 18). We conducted a series of experiments within the STC framework to determine whether SP could cause the expression of PRPs that contribute to the potentiation of “tagged synapses.” Initially, STC was studied by using a strong-before-weak paradigm (SBW). Here, SP-induced potentiation was considered strong because of its protein synthesis dependency and its long-lasting nature. To study STC in the framework of SBW, a 30-min stable baseline was recorded from SC-CA2 and EC-CA2 inputs (Fig. 3B, blue and red circles) before the bath application of SP for 15 min. The test stimulation in EC-CA2 (Fig. 3B, red circles) was suspended during SP application period and for the subsequent 1 h, whereas synaptic responses in SC-CA2 (Fig. 3B, blue circles) was recorded continuously. Consistent with the findings depicted in Fig. 2A, SC-CA2 expressed statistically significant potentiation starting from the 40th minute (Wilcoxon test, P = 0.013) whereas no potentiation was observed in EC-CA2. An early-LTP protocol (i.e., WTET) was delivered to EC-CA2 (Fig. 3B) 30 min after resuming the baseline stimulation in this input. Interestingly, we observed an expression of L-LTP at weakly stimulated EC-CA2 synaptic input (Fig. 3B, red circles) that, without SP, would have decayed back to the baseline level (Fig. 3A). The next step was to test whether continuous stimulation of SC was required during SP application to prime EC-CA2 synapses to express late plasticity or if SP application during the suspension of stimulation was sufficient. As shown in Fig. S5A, stopping the test stimulation entirely in SC-CA2 (Fig. S5A, blue circles) 60 min after SP application still primed the EC-CA2 synapses to express L-LTP (Fig. S5A, red circles). In contrast, suspending test stimulation in SC-CA2 during SP application and then for as long as 60 min did not prime the EC-CA2 to express L-LTP (Fig. S5B, red circles). Similarly, suspending test stimulation in SC-CA2 during SP application and then as long as 60 min, followed by the application of STET 30 min after resuming the test stimulation, also failed to induce plasticity in this input (Fig. S5C, blue circles). In this experiment, the EC-CA2 input received test stimulation throughout the recording period of 240 min and displayed statistically significant potentiation starting from the 40th minute throughout the recording period (Fig. S5C, red circles; Wilcoxon test, P = 0.027).
Fig. S5.
Requirement of test stimulation for SP-induced STC. (A) SP was bath-applied for 15 min, during which time the baseline stimulation was suspended for 1 h in EC-CA2 but not in SC-CA2. After 1 h, EC-CA2 synapses recordings were resumed and continued for another 30 min, followed by WTET at the 90th minute. At that time, the SC-CA2 stimulation input was suspended until the end of the experiment (n = 8). In this case, SC-CA2 synapses that expressed potentiation within the first 1 h was sufficient to transform the fEPSP potentiation in EC-CA2 to an L-LTP. (B) In a similar control experiment, SC- and EC-CA2 inputs were silenced for 1 h after a stable baseline recording for 30 min. A WTET at the 90th minute in EC-CA2 failed to transform the fEPSP potentiation to an L-LTP in this case (n = 7). (C) In another set of experiment, the EC-CA2 input received normal test stimulation and displayed significant potentiation, whereas the SC-CA2 input was silenced during SP application and then for as long as 1 h. At 30 min after resuming the test stimulation, STET was applied, which failed to induce potentiation in this input (n = 6). Representative fEPSP traces 15 min before (closed line), 95 min after (dotted line), and 180 min after (hatched line) SP application or WTET/STET are depicted. In A, traces are shown up to 60 min after SP application (dotted line). Calibration bars are 2 mV/3 ms.
Next, we confirmed the STC experiments by using a strong-before-strong (SBS) paradigm (29) using the same experimental design as in Fig. 3B. However, instead of early LTP, L-LTP was induced in EC-CA2 in the presence of a protein synthesis inhibitor, anisomycin (ANI; 25 μM) or emetine (EME; 20 μM), that resulted in an L-LTP in the EC-CA2 input (Fig. 3 D and F, red circles). SC-CA2 showed statistically significant potentiation from the 30th minute to the end of the recording (Fig. 3 D and F, blue circles; Wilcoxon test, P = 0.017 and P = 0.016, respectively), and EC-CA2 showed statistically significant potentiation immediately after STET (Fig. 3 D and F, red circles; Wilcoxon test, P = 0.012 and P = 0.003, respectively). In both cases, the drug was applied 20 min before and continued for 40 min after the first tetanization of STET. The control experiments depicted in Fig. 3 C and E used the same experimental design as of Fig. 3 D and F except that SC-CA2 was not recorded. Induction of L-LTP in the presence of ANI (Fig. 3C) or EME (Fig. 3E) in these experimental conditions resulted in only early LTP. Statistically significant potentiation was present only up to the 205th minute in Fig. 3C (Wilcoxon test, P = 0.04) and up to the 215th minute in Fig. 3E (Wilcoxon test, P = 0.018).
In short, SP-induced long-lasting plasticity participates in late associative processes reminiscent of STC.
CaMKIV and PKMζ Are Required for SP-Induced Plasticity and Associativity in Area CA2.
It has been reported that CaMKIV and PKMζ can play important roles in maintaining long-term plasticity and STC in hippocampal area CA1 (30, 31). We investigated whether these molecules may play a role in SP-induced plasticity and associativity in area CA2. It has also been reported that many genes are robustly activated or down-regulated at the mRNA level upon cutting slices, and that these changes can persist for 6 h (32). To exclude this possibility, we have first determined the mRNA level in area CA2 from naïve rat tissue for reference. Expression of mRNA in naïve rat hippocampus and control hippocampal slices did not show any significant difference (Fig. S6; more details provided in Methods).
Next, we determined the expression levels of CaMKIV and PKMζ mRNAs in area CA2 before and after the establishment of SP-induced potentiation (Fig. S6). We noticed significantly higher expression of CaMKIV and PKMζ mRNA after SP application (P < 0.05; Fig. S6) compared with control (unstimulated) slices and naïve (i.e., not sliced) CA2 tissues. These findings motivated us to test whether pharmacological inhibition of CaMKIV or PKMζ abolishes SP-induced long-lasting plasticity. We tested this notion by inhibiting CaMKIV with KN-93 (10 µM) and inhibiting PKMζ with antisense oligodeoxynucleotides (20 μM). Coapplication of KN-93 along with SP completely abolished SP-induced potentiation in SC-CA2 and EC-CA2 inputs (Fig. 4A, red and blue circles), whereas a nonactive version of the drug KN-92 (10 µM) did not prevent SP-induced potentiation (Fig. 4B, red and blue circles). Statistically significant potentiation was observed in SC and EC-CA2 inputs from the 10th and 35th minutes (Wilcoxon test, P = 0.046 and P = 0.03, respectively), which lasted for 240 min. Similarly, continuous PKMζ inhibition by antisense oligodeoxynucleotides (20 μM) during the incubation and the entire recording period prevented SP-induced potentiation (Fig. 4D, red and blue circles), whereas a control scrambled version left SP-induced potentiation intact (Fig. 4E, red and blue circles). The potentiation observed in SC- and EC-CA2 inputs showed statistical significance starting from the 70th and 50th minutes onward (Wilcoxon test, P = 0.018 and P = 0.03, respectively). The knockdown experiments of PKMζ by antisense and scrambled oligodeoxynucleotides were validated by Western blot analysis (Fig. S7). We further quantified the CaMKIV and PKMζ protein levels by Western blot analysis and Fig. 4 C, a and b, and F, a and b, show compelling evidence that phosphorylated CaMKIV and total PKMζ are significantly increased in area CA2 after the application of SP.
Fig. S7.
(A) Western blot analysis of PKMζ protein expression in acute hippocampal slices using anti-PKCZ antibody detected a major band at ∼55 kDa (for PKMζ) in the three lanes loaded with control (untreated), treated with antisense oligodeoxynucleotides plus SP, and scrambled plus SP (Upper). (Lower) Equal loading of samples in all three lanes using anti-tubulin antibody (50 kDa). (B) A significant decrease in the protein expression level was observed in the slices treated with PKMζ antisense oligodeoxynucleotides compared with control slices. In contrast, the protein expression was higher (equivalent to untreated control slices) when they were treated with the corresponding scrambled version of the oligodeoxynucleotides. Significant differences between groups (control vs. antisense and antisense vs. scrambled) are indicated by **P < 0.01 (slices from three biological replicates).
Previous studies have shown that CaMKIV is activated by phosphorylation in the CA1 area of hippocampus after LTP induction (33). We showed a change in the phosphorylation activity of CaMKIV in the area CA2, rather than the total amount of proteins after SP-induced potentiation. The Western blot analysis showed that total CaMKIV level did not change after SP treatment, but phosphorylated CaMKIV (p-CaMKIV) showed a significant increase after SP treatment in area CA2. We normalized p-CaMKIV protein expression with the respective total CaMKIV protein expression to measure the change in the fraction of total proteins that have been phosphorylated and thereby activated. SP-induced CaMKIV activity by phosphorylation may increase the expression of CaMKK enzymes, which are known to phosphorylate the CaM kinase cascade (34).
On the contrary, new PKMζ proteins are synthesized during LTP, as an elevated level of Ca2+ can activate different types of kinases (such as CaMKII and PKA) that can remove the translational block of PKMζ mRNA and subsequently synthesize new proteins (35). Thus, for PKMζ protein expression, we preferred to show the total amount of proteins that were synthesized during SP-induced potentiation.
SP-Induced Plasticity and Associativity in Area CA2 Is Independent of the GABAergic Transmission.
Many different classes of interneurons strongly express SP in all fields of the hippocampus (10), and the NK1 receptor is expressed by several different interneuron populations in the hippocampus (36). In this context, we cannot rule out the possibility of the release of SP by interneurons in the hippocampal slices by electrical stimulation in SC-CA2 and EC-CA2 synaptic inputs. Nevertheless, we have repeated some of the critical experiments in the presence of GABAA or GABAB receptor antagonists to determine whether GABAergic transmission is required for SP-induced potentiation. The first of this series of experiments displayed in Fig. 1D was repeated in the presence of an inhibitor of GABAA receptors, picrotoxin (PTX; 100 μM), and GABAB receptors CGP55845 (2 μM), applied together during the entire incubation and recording period. SP-induced potentiation was intact in SC-CA2 and EC-CA2 synaptic inputs (Fig. 5A, blue and red circles) irrespective of the complete blockade of GABAergic transmission. Both synaptic inputs showed statistically significant potentiation from the 20th and 30th minutes (Wilcoxon test, P = 0.027 and P = 0.046) onward, and lasted to the end of the experiment. Second, we repeated the STC experiments displayed in Fig. 3 B and F in the presence of inhibitors of GABAA and GABAB receptors. Interestingly, even during the continuous inhibition of GABAergic transmission, STC initiated by SP was successfully established within the framework of tetanus-induced potentiation in SBW (Fig. 5B) or SBS (Fig. 5C) configurations. SP-induced potentiation in SC-CA2 showed statistically significant potentiation from the 25th and 15th minutes in Fig. 5 B and C (blue circles; P = 0.018 and P = 0.046, respectively) and remained stable from the 120th minute to the end of the recording. Statistically significant LTP was expressed in EC-CA2 immediately after the application of WTET (P = 0.018; Fig. 5B) or STET (P = 0.03; Fig. 5C).
In short, SP-induced plasticity and associativity in area CA2 is independent of GABAergic transmission.
Discussion
The present study provides compelling evidence that activation of NK1 receptors enables SC-CA2 synapses to respond to synaptic activation by expressing synaptic potentiation. SP in conjunction with NMDA-receptor activation induces gene expression that facilitates synaptic changes that eventually lead to long-lasting potentiation. SP shows preferential binding to the ligand-binding site of NK1 receptors (37). Binding of SP to NK1 receptors leads to activation of adenylyl cyclase, hydrolysis of phosphoinositides, mobilization of intracellular calcium ions, and activation of downstream effector molecules such as PKA, PKC, and MAPK (38), all of which have been associated with the expression of LTP (39).
Kinases such as CaMKIV and PKMζ have been reported to play important roles in maintaining STC in hippocampal area CA1 (30, 31). It has been proposed earlier that CaMKII can mediate the setting of synaptic tags while CaMKIV acts as a PRP (30, 40). Similarly, tagging of PKMζ from a strongly tetanized input to a weakly tetanized input is critical for the expression of STC in CA1 pyramidal neurons (31). In addition, we have recently reported that metaplastic activation of PKMζ can rescue the plasticity and associativity that is degraded under neurodegenerative conditions (41).
We found that the levels of CaMKIV and PKMζ (PRKCZ) transcripts were significantly increased within the area CA2 after SP application, indicating that area CA2 also shares similar molecular pathways as CA1 during the establishment of SP-induced potentiation and its associativity. It should be noted that the CaM kinase inhibitor used in this study, KN-93, has a broad spectrum of specificity for inhibiting CaM kinases (30). A low concentration of KN-93 (1 μM) is enough to impair synaptic plasticity in brain slices (42). CaMKII (with a Ki of 370 nm) can be effectively blocked by a low concentration of KN-93 with much less inhibition on CaMKIV (43, 44). The study by Redondo et al. (30) reported that a general CaMK inhibitor such as KN-93 at a low dose inhibits CaMKII, thus specifically impairing the synaptic tag setting process, whereas a higher concentration (10 μM) of KN-93 blocks tag setting, synthesis, and availability of PRPs. Thus, the high concentration of KN-93 used in the present study to prevent SP-induced potentiation in area CA2 must have interfered with tag setting and PRPs (here CaMKIV) synthesis.
An intriguing observation in the present study is the requirement of test stimulation for the expression of SP-induced potentiation. Interestingly, test stimulation was observed to be mandatory only during SP application, as experiments suspending test stimulation after establishing SP potentiation did not show interference with the STC process. In addition, test stimulation along with SP not only helps in the setting of synaptic tags but also quickly activates the synthesis of PRPs (here CaMKIV ad PKMζ) that are essential for the expression of plasticity in SC-CA2 and EC-CA2 synapses of area CA2. However, SP priming did not facilitate plasticity induction in SC-CA2 synapse, as STET failed to induce any visible plasticity, an interesting finding that needs further attention. Overall, the present findings on the role of test stimulation are consistent with our earlier observation that a synergistic role of dopaminergic D1/D5- as well as NMDA receptor-function is required for the maintenance of protein synthesis-dependent long-lasting plasticity in hippocampal area CA1 pyramidal neurons (26).
Chevaleyre and Siegelbaum (4) showed that cortical inputs can drive excitation in CA2 pyramidal neurons. The absence of excitation in CA2 from the intrahippocampal CA3 input makes it difficult to gauge the role of CA2 in the intrahippocampal network. Perhaps the feed-forward inhibition of CA3 inputs at CA2 serves to fine tune the information flow from CA3 to CA1. Nasrallah et al. (45) showed that LTD induction at inhibitory synapses (iLTD) in CA2 results in CA2 firing upon SC stimulation. Moreover, iLTD further increases the net excitatory drive of CA2 pyramidal neurons upon EC-LII stimulation and may serve to increase the cellular output at CA1 from the combined EC LII-dentate gyrus-CA3-CA2-CA1 and the more direct EC LII-CA2-CA1 loops. The inhibitory GABAergic transmission was shown to be a prerequisite for iLTD induction in CA2, as blocking of GABA receptors abolished this effect. A previous study (46) had already shown that the activation of delta opioid receptors (DORs) in the inhibitory interneurons is necessary to mediate iLTD in CA2 by decreasing solely the inhibitory transmission without altering excitatory transmission from CA3. Nasrallah et al. (45) showed that the increase in postsynaptic potential amplitude and action potential firing in CA2 upon HFS is also dependent on DOR activation, further confirming the role of DOR-mediated iLTD at inhibitory synapses onto CA2 in mediating potentiation in CA2. In general, a presynaptic inhibitory plasticity allows the net output of area CA2 to increase, i.e., a decrease in inhibition combined with no change in excitation leads to a net increase in CA2 pyramidal neuron output.
Unlike DORs, tachykinins are mostly known to cause a direct excitation of inhibitory interneurons and enhance the inhibitory inputs in the pyramidal neurons (14). Another study reported by Ogier et al. (47) shows that hippocampal GABAergic interneurons possess tachykinin receptors (including NK1), which can engage in dual mechanisms by depressing or disinhibiting the activity of pyramidal neurons. These receptor-bearing interneurons can indirectly inhibit other interneurons as a result of the existence of interneuron-interneuron synapses, and this action causes a partial disinhibition of pyramidal neurons, leading to an indirect excitation of these cells. This possibility cannot be ruled out in the case of CA2, which is enriched with a dense population of interneurons. Although our studies did not show any difference in SP-mediated plasticity and STC processes in the presence of GABA inhibitors, it is not unlikely that the NK1 receptors in GABAergic interneurons would still be intact, even in the absence of GABAergic inhibition. Furthermore, according to Liu et al. (48), SP can increase the intracellular calcium concentration with a rapid enhancement in glutamate release. This in turn can activate more NMDA receptors and result in a large and long-lasting excitatory postsynaptic potential. Thus, an indirect inhibition and/or disinhibition of CA2 pyramidal neurons may play a critical role in maintaining SP-mediated plasticity in area CA2 during the inhibition of GABAergic transmission. Overall, the exact mechanism of SP-mediated neuromodulation in CA2 during the inhibition of GABAergic transmission is not very clear and needs further study.
The neuromodulator SP is proposed to be related to the transmission of pain information into the central nervous system (12). Neuromodulation of hippocampal area CA2 by SP possesses the potential to fine tune excitatory inputs onto the major hippocampal output CA1. As a result of the emerging evidence of different neuromodulatory substances capable of mediating plasticity in area CA2, it is becoming increasingly clear that the plasticity limiting properties of CA2 is functionally important, requiring the right signal at the right time. Social interactions and their resultant emotional repercussions could potentially influence one’s day-to-day performance and ability to learn and remember. It will be interesting to understand if neuromodulatory inputs onto CA2 neurons during such social interactions and resultant stressors could, in turn, modulate information flow to CA1 and thereby the net output from CA1. Thus, we propose that modulation of synaptic inputs at CA2 could also have an impact on learning and memory functions other than social recognition memory.
As alterations to the CA2 region have been reported in neuropsychiatric illnesses such as schizophrenia, it is of clinical significance to understand whether changes in neuromodulatory inputs to CA2 are associated with the symptomatic deficits in day-to-day performance, learning and memory, social recognition memory, and social interactions. Response to novelty (49) and generation of hippocampal theta rhythm (50–53), two critical factors for long-term memory formation and maintenance, are influenced by SuM activity. Thus, given the crucial role of CA2 in social memory, it is highly likely that the SP-expressing afferents that uniquely innervate hippocampal area CA2 can potentially influence the consolidation of social memory and thereby influence social interactions. Our future study will address the specific role of SP in area CA2 and its influence on social memory.
Methods
All animal procedures were approved by guidelines from the institutional animal care and use committee of the National University of Singapore. More details about slice preparation, incubation, electrophysiology procedures, pharmacology, and molecular biology are provided in SI Methods.
Supplementary Material
Acknowledgments
We thank Dr. Serena M. Dudek (National Institute of Environmental Health Sciences, National Institutes of Health) for her constructive comments on the manuscript; Dr. Anoop Manakkadan, Amrita Benoy, Radha Raghuraman, and Victoria Dawson for their critical comments and editing; and Miss Lim Yu Jia for her help with some experiments. This work was supported by National Medical Research Council (NMRC) Grants NMRC-CBRG-0041-2013, NMRC-CBRG-0099-2015, and NMRC-OFIRG-0037-2017 (to S.S.); National University of Singapore (NUS) University Strategic Research Grant DPRT/944/09/14 (to S.S. and T.W.S.); NUS Yong Loo Lin School of Medicine Aspiration Fund Grant R-185-000-271-720 (to S.S. and T.W.S.); National Science Foundation China Grant 31320103906 (to T.B.); 111 Project B16013 (to T.B.); and an NUS Research Scholarship (to A.D.).
Footnotes
The authors declare no conflict of interest.
This article is a PNAS Direct Submission. S.A.S. is a guest editor invited by the Editorial Board.
This article contains supporting information online at www.pnas.org/lookup/suppl/doi:10.1073/pnas.1711267114/-/DCSupplemental.
References
- 1.Hitti FL, Siegelbaum SA. The hippocampal CA2 region is essential for social memory. Nature. 2014;508:88–92. doi: 10.1038/nature13028. [DOI] [PMC free article] [PubMed] [Google Scholar]
- 2.Stevenson EL, Caldwell HK. Lesions to the CA2 region of the hippocampus impair social memory in mice. Eur J Neurosci. 2014;40:3294–3301. doi: 10.1111/ejn.12689. [DOI] [PMC free article] [PubMed] [Google Scholar]
- 3.Pagani JH, et al. Role of the vasopressin 1b receptor in rodent aggressive behavior and synaptic plasticity in hippocampal area CA2. Mol Psychiatry. 2015;20:490–499. doi: 10.1038/mp.2014.47. [DOI] [PMC free article] [PubMed] [Google Scholar]
- 4.Chevaleyre V, Siegelbaum SA. Strong CA2 pyramidal neuron synapses define a powerful disynaptic cortico-hippocampal loop. Neuron. 2010;66:560–572. doi: 10.1016/j.neuron.2010.04.013. [DOI] [PMC free article] [PubMed] [Google Scholar]
- 5.Zhao M, Choi YS, Obrietan K, Dudek SM. Synaptic plasticity (and the lack thereof) in hippocampal CA2 neurons. J Neurosci. 2007;27:12025–12032. doi: 10.1523/JNEUROSCI.4094-07.2007. [DOI] [PMC free article] [PubMed] [Google Scholar]
- 6.Simons SB, Escobedo Y, Yasuda R, Dudek SM. Regional differences in hippocampal calcium handling provide a cellular mechanism for limiting plasticity. Proc Natl Acad Sci USA. 2009;106:14080–14084. doi: 10.1073/pnas.0904775106. [DOI] [PMC free article] [PubMed] [Google Scholar]
- 7.Lee SE, et al. RGS14 is a natural suppressor of both synaptic plasticity in CA2 neurons and hippocampal-based learning and memory. Proc Natl Acad Sci USA. 2010;107:16994–16998. doi: 10.1073/pnas.1005362107. [DOI] [PMC free article] [PubMed] [Google Scholar]
- 8.Chevaleyre V, Piskorowski RA. Hippocampal area CA2: An overlooked but promising therapeutic target. Trends Mol Med. 2016;22:645–655. doi: 10.1016/j.molmed.2016.06.007. [DOI] [PubMed] [Google Scholar]
- 9.Dudek SM, Alexander GM, Farris S. Rediscovering area CA2: Unique properties and functions. Nat Rev Neurosci. 2016;17:89–102. doi: 10.1038/nrn.2015.22. [DOI] [PMC free article] [PubMed] [Google Scholar]
- 10.Borhegyi Z, Leranth C. Substance P innervation of the rat hippocampal formation. J Comp Neurol. 1997;384:41–58. doi: 10.1002/(sici)1096-9861(19970721)384:1<41::aid-cne3>3.0.co;2-l. [DOI] [PubMed] [Google Scholar]
- 11.Hasenöhrl RU, et al. Substance P and its role in neural mechanisms governing learning, anxiety and functional recovery. Neuropeptides. 2000;34:272–280. doi: 10.1054/npep.2000.0824. [DOI] [PubMed] [Google Scholar]
- 12.Quartara L, Maggi CA. The tachykinin NK1 receptor. Part II: Distribution and pathophysiological roles. Neuropeptides. 1998;32:1–49. doi: 10.1016/s0143-4179(98)90015-4. [DOI] [PubMed] [Google Scholar]
- 13.Kouznetsova M, Nistri A. Modulation by substance P of synaptic transmission in the mouse hippocampal slice. Eur J Neurosci. 1998;10:3076–3084. doi: 10.1046/j.1460-9568.1998.00318.x. [DOI] [PubMed] [Google Scholar]
- 14.Ogier R, Raggenbass M. Action of tachykinins in the rat hippocampus: Modulation of inhibitory synaptic transmission. Eur J Neurosci. 2003;17:2639–2647. doi: 10.1046/j.1460-9568.2003.02708.x. [DOI] [PubMed] [Google Scholar]
- 15.Choi WK, et al. The characteristics of supramammillary cells projecting to the hippocampus in stress response in the rat. Korean J Physiol Pharmacol. 2012;16:17–24. doi: 10.4196/kjpp.2012.16.1.17. [DOI] [PMC free article] [PubMed] [Google Scholar]
- 16.Silveira MC, Sandner G, Graeff FG. Induction of Fos immunoreactivity in the brain by exposure to the elevated plus-maze. Behav Brain Res. 1993;56:115–118. doi: 10.1016/0166-4328(93)90028-o. [DOI] [PubMed] [Google Scholar]
- 17.Redondo RL, Morris RG. Making memories last: The synaptic tagging and capture hypothesis. Nat Rev Neurosci. 2011;12:17–30. doi: 10.1038/nrn2963. [DOI] [PubMed] [Google Scholar]
- 18.Shivarama Shetty M, Sajikumar S. ‘Tagging’ along memories in aging: Synaptic tagging and capture mechanisms in the aged hippocampus. Ageing Res Rev. 2017;35:22–35. doi: 10.1016/j.arr.2016.12.008. [DOI] [PubMed] [Google Scholar]
- 19.Frey U, Morris RG. Synaptic tagging and long-term potentiation. Nature. 1997;385:533–536. doi: 10.1038/385533a0. [DOI] [PubMed] [Google Scholar]
- 20.Krishna K, Behnisch T, Sajikumar S. Inhibition of histone deacetylase 3 restores amyloid-βoligomer-induced plasticity deficit in hippocampal CA1 pyramidal neurons. J Alzheimers Dis. 2016;51:783–791. doi: 10.3233/JAD-150838. [DOI] [PubMed] [Google Scholar]
- 21.Shetty MS, et al. Investigation of synaptic tagging/capture and cross-capture using acute hippocampal slices from rodents. J Vis Exp. 2015;103:e53008. doi: 10.3791/53008. [DOI] [PMC free article] [PubMed] [Google Scholar]
- 22.Livak KJ, Schmittgen TD. Analysis of relative gene expression data using real-time quantitative PCR and the 2(-delta delta C(T)) method. Methods. 2001;25:402–408. doi: 10.1006/meth.2001.1262. [DOI] [PubMed] [Google Scholar]
- 23.Li Q, et al. Making synapses strong: Metaplasticity prolongs associativity of long-term memory by switching synaptic tag mechanisms. Cerebral Cortex. 2014;24:353–363. doi: 10.1093/cercor/bhs315. [DOI] [PubMed] [Google Scholar]
- 24.Sajikumar S, Korte M. Metaplasticity governs compartmentalization of synaptic tagging and capture through brain-derived neurotrophic factor (BDNF) and protein kinase Mzeta (PKMzeta) Proc Natl Acad Sci USA. 2011;108:2551–2556. doi: 10.1073/pnas.1016849108. [DOI] [PMC free article] [PubMed] [Google Scholar]
- 25.Simons SB, Caruana DA, Zhao M, Dudek SM. Caffeine-induced synaptic potentiation in hippocampal CA2 neurons. Nat Neurosci. 2011;15:23–25. doi: 10.1038/nn.2962. [DOI] [PMC free article] [PubMed] [Google Scholar]
- 26.Navakkode S, Sajikumar S, Frey JU. Synergistic requirements for the induction of dopaminergic D1/D5-receptor-mediated LTP in hippocampal slices of rat CA1 in vitro. Neuropharmacology. 2007;52:1547–1554. doi: 10.1016/j.neuropharm.2007.02.010. [DOI] [PubMed] [Google Scholar]
- 27.Navakkode S, Sajikumar S, Sacktor TC, Frey JU. Protein kinase Mzeta is essential for the induction and maintenance of dopamine-induced long-term potentiation in apical CA1 dendrites. Learn Mem. 2010;17:605–611. doi: 10.1101/lm.1991910. [DOI] [PMC free article] [PubMed] [Google Scholar]
- 28.Shivarama Shetty M, Gopinadhan S, Sajikumar S. Dopamine D1/D5 receptor signaling regulates synaptic cooperation and competition in hippocampal CA1 pyramidal neurons via sustained ERK1/2 activation. Hippocampus. 2016;26:137–150. doi: 10.1002/hipo.22497. [DOI] [PMC free article] [PubMed] [Google Scholar]
- 29.Shires KL, Da Silva BM, Hawthorne JP, Morris RG, Martin SJ. Synaptic tagging and capture in the living rat. Nat Commun. 2012;3:1246. doi: 10.1038/ncomms2250. [DOI] [PMC free article] [PubMed] [Google Scholar]
- 30.Redondo RL, et al. Synaptic tagging and capture: Differential role of distinct calcium/calmodulin kinases in protein synthesis-dependent long-term potentiation. J Neurosci. 2010;30:4981–4989. doi: 10.1523/JNEUROSCI.3140-09.2010. [DOI] [PMC free article] [PubMed] [Google Scholar]
- 31.Sajikumar S, Navakkode S, Sacktor TC, Frey JU. Synaptic tagging and cross-tagging: The role of protein kinase Mzeta in maintaining long-term potentiation but not long-term depression. J Neurosci. 2005;25:5750–5756. doi: 10.1523/JNEUROSCI.1104-05.2005. [DOI] [PMC free article] [PubMed] [Google Scholar]
- 32.Taubenfeld SM, Stevens KA, Pollonini G, Ruggiero J, Alberini CM. Profound molecular changes following hippocampal slice preparation: Loss of AMPA receptor subunits and uncoupled mRNA/protein expression. J Neurochem. 2002;81:1348–1360. doi: 10.1046/j.1471-4159.2002.00936.x. [DOI] [PubMed] [Google Scholar]
- 33.Kasahara J, Fukunaga K, Miyamoto E. Activation of calcium/calmodulin-dependent protein kinase IV in long term potentiation in the rat hippocampal CA1 region. J Biol Chem. 2001;276:24044–24050. doi: 10.1074/jbc.M100247200. [DOI] [PubMed] [Google Scholar]
- 34.Soderling TR. The Ca-calmodulin-dependent protein kinase cascade. Trends Biochem Sci. 1999;24:232–236. doi: 10.1016/s0968-0004(99)01383-3. [DOI] [PubMed] [Google Scholar]
- 35.Sacktor TC. Memory maintenance by PKMζ–An evolutionary perspective. Mol Brain. 2012;5:31. doi: 10.1186/1756-6606-5-31. [DOI] [PMC free article] [PubMed] [Google Scholar]
- 36.Sloviter RS, Ali-Akbarian L, Horvath KD, Menkens KA. Substance P receptor expression by inhibitory interneurons of the rat hippocampus: Enhanced detection using improved immunocytochemical methods for the preservation and colocalization of GABA and other neuronal markers. J Comp Neurol. 2001;430:283–305. [PubMed] [Google Scholar]
- 37.Valentin-Hansen L, et al. Mapping substance P binding sites on the neurokinin-1 receptor using genetic incorporation of a photoreactive amino acid. J Biol Chem. 2014;289:18045–18054. doi: 10.1074/jbc.M113.527085. [DOI] [PMC free article] [PubMed] [Google Scholar]
- 38.Rosso M, Muñoz M, Berger M. The role of neurokinin-1 receptor in the microenvironment of inflammation and cancer. Sci World J. 2012;2012:381434. doi: 10.1100/2012/381434. [DOI] [PMC free article] [PubMed] [Google Scholar]
- 39.Malenka RC, Bear MF. LTP and LTD: An embarrassment of riches. Neuron. 2004;44:5–21. doi: 10.1016/j.neuron.2004.09.012. [DOI] [PubMed] [Google Scholar]
- 40.Sajikumar S, Navakkode S, Frey JU. Identification of compartment- and process-specific molecules required for “synaptic tagging” during long-term potentiation and long-term depression in hippocampal CA1. J Neurosci. 2007;27:5068–5080. doi: 10.1523/JNEUROSCI.4940-06.2007. [DOI] [PMC free article] [PubMed] [Google Scholar]
- 41.Li Q, et al. Metaplasticity mechanisms restore plasticity and associativity in an animal model of Alzheimer’s disease. Proc Natl Acad Sci USA. 2017;114:5527–5532. doi: 10.1073/pnas.1613700114. [DOI] [PMC free article] [PubMed] [Google Scholar]
- 42.Hansel C, et al. αCaMKII is essential for cerebellar LTD and motor learning. Neuron. 2006;51:835–843. doi: 10.1016/j.neuron.2006.08.013. [DOI] [PubMed] [Google Scholar]
- 43.Ishida A, Kameshita I, Okuno S, Kitani T, Fujisawa H. A novel highly specific and potent inhibitor of calmodulin-dependent protein kinase II. Biochem Biophys Res Commun. 1995;212:806–812. doi: 10.1006/bbrc.1995.2040. [DOI] [PubMed] [Google Scholar]
- 44.Sumi M, et al. The newly synthesized selective Ca2+/calmodulin dependent protein kinase II inhibitor KN-93 reduces dopamine contents in PC12h cells. Biochem Biophys Res Commun. 1991;181:968–975. doi: 10.1016/0006-291x(91)92031-e. [DOI] [PubMed] [Google Scholar]
- 45.Nasrallah K, Piskorowski RA, Chevaleyre V. Inhibitory plasticity permits the recruitment of CA2 pyramidal neurons by CA3(1,2,3) eNeuro. 2015;2(4) doi: 10.1523/ENEURO.0049-15.2015. [DOI] [PMC free article] [PubMed] [Google Scholar]
- 46.Piskorowski RA, Chevaleyre V. Delta-opioid receptors mediate unique plasticity onto parvalbumin-expressing interneurons in area CA2 of the hippocampus. J Neurosci. 2013;33:14567–14578. doi: 10.1523/JNEUROSCI.0649-13.2013. [DOI] [PMC free article] [PubMed] [Google Scholar]
- 47.Ogier R, Wrobel LJ, Raggenbass M. Action of tachykinins in the hippocampus: Facilitation of inhibitory drive to GABAergic interneurons. Neuroscience. 2008;156:527–536. doi: 10.1016/j.neuroscience.2008.08.001. [DOI] [PubMed] [Google Scholar]
- 48.Liu H, Mazarati AM, Katsumori H, Sankar R, Wasterlain CG. Substance P is expressed in hippocampal principal neurons during status epilepticus and plays a critical role in the maintenance of status epilepticus. Proc Natl Acad Sci USA. 1999;96:5286–5291. doi: 10.1073/pnas.96.9.5286. [DOI] [PMC free article] [PubMed] [Google Scholar]
- 49.Ito M, Shirao T, Doya K, Sekino Y. Three-dimensional distribution of Fos-positive neurons in the supramammillary nucleus of the rat exposed to novel environment. Neurosci Res. 2009;64:397–402. doi: 10.1016/j.neures.2009.04.013. [DOI] [PubMed] [Google Scholar]
- 50.Cui Z, Gerfen CR, Young WS., 3rd Hypothalamic and other connections with dorsal CA2 area of the mouse hippocampus. J Comp Neurol. 2013;521:1844–1866. doi: 10.1002/cne.23263. [DOI] [PMC free article] [PubMed] [Google Scholar]
- 51.Kirk IJ, McNaughton N. Supramammillary cell firing and hippocampal rhythmical slow activity. Neuroreport. 1991;2:723–725. doi: 10.1097/00001756-199111000-00023. [DOI] [PubMed] [Google Scholar]
- 52.Kirk IJ, McNaughton N. Mapping the differential effects of procaine on frequency and amplitude of reticularly elicited hippocampal rhythmical slow activity. Hippocampus. 1993;3:517–525. doi: 10.1002/hipo.450030411. [DOI] [PubMed] [Google Scholar]
- 53.Kocsis B, Vertes RP. Characterization of neurons of the supramammillary nucleus and mammillary body that discharge rhythmically with the hippocampal theta rhythm in the rat. J Neurosci. 1994;14:7040–7052. doi: 10.1523/JNEUROSCI.14-11-07040.1994. [DOI] [PMC free article] [PubMed] [Google Scholar]
Associated Data
This section collects any data citations, data availability statements, or supplementary materials included in this article.


