

Significance
Dysfunction of microglia plays a fundamental role in the pathogenesis of Alzheimer’s disease (AD), the most common form of dementia. However, there is a lack of knowledge about targets that can be safely manipulated for modulating microglia for the treatment of AD. The presence of a unique subtype of disease-associated microglia (DAM) has recently been implicated in mediating pathogenesis of AD. However, the mechanism that promotes the development of DAM is unclear, nor is it known how DAM may modulate the progression of AD. This study demonstrates that RIPK1-dependent transcription promotes DAM and lysosomal defects to mediate the accumulation of amyloid plaques in AD. Thus, targeting RIPK1 may provide an important therapeutic strategy for the treatment of AD.
Keywords: RIPK1, microglia, Alzheimer’s disease, RIP1, inflammation
Abstract
Dysfunction of microglia is known to play an important role in Alzheimer’s disease (AD). Here, we investigated the role of RIPK1 in microglia mediating the pathogenesis of AD. RIPK1 is highly expressed by microglial cells in human AD brains. Using the amyloid precursor protein (APP)/presenilin 1 (PS1) transgenic mouse model, we found that inhibition of RIPK1, using both pharmacological and genetic means, reduced amyloid burden, the levels of inflammatory cytokines, and memory deficits. Furthermore, inhibition of RIPK1 promoted microglial degradation of Aβ in vitro. We characterized the transcriptional profiles of adult microglia from APP/PS1 mice and identified a role for RIPK1 in regulating the microglial expression of CH25H and Cst7, a marker for disease-associated microglia (DAM), which encodes an endosomal/lysosomal cathepsin inhibitor named Cystatin F. We present evidence that RIPK1-mediated induction of Cst7 leads to an impairment in the lysosomal pathway. These data suggest that RIPK1 may mediate a critical checkpoint in the transition to the DAM state. Together, our study highlights a non-cell death mechanism by which the activation of RIPK1 mediates the induction of a DAM phenotype, including an inflammatory response and a reduction in phagocytic activity, and connects RIPK1-mediated transcription in microglia to the etiology of AD. Our results support that RIPK1 is an important therapeutic target for the treatment of AD.
Alzheimer’s disease (AD) is a devastating neurodegenerative disorder and the leading cause of age-related dementia. About 5.5 million Americans and 1 in 10 people worldwide over the age of 65 are currently living with AD. Chronic brain inflammation, characterized by an increased number of microglia and elevated levels of proinflammatory cytokines, is a hallmark of AD (1). Recent genome-wide association studies (GWASs) have identified specific alleles of multiple genes involved in regulating innate immunity and inflammation as risk factors for late onset AD (LOAD), including CH25H, TREM2, complement receptor 1 (CR1), clusterin, CD33, the MS4A6-MS4A4 cluster, ABCA7, CD2AP, EPHA1, HLA-DRB5–DRB1, INPP5D, and MEF2C (2–7). In addition, increased levels of TNFα are found in the cerebral spinal fluid (CSF) of patients with mild cognitive impairment (MCI) at risk to develop AD, suggesting that CNS inflammation is an early event during the pathogenesis of AD (8). It remains unclear, however, how the LOAD risk factors mediate neuroinflammation and onset of the disease. Furthermore, while neuroinflammation has been recognized as an important therapeutic target for the treatment of AD (9), there is a lack of understanding how neuroinflammatory mechanisms can be specifically and safely modulated.
Microglia, the macrophage-like cells of the central nervous system, can uptake extracellular amyloid beta (Aβ) species, which are then degraded via the autophagic/lysosomal system (10, 11). An altered inflammatory milieu is known to impair the ability of microglia to properly internalize and degrade amyloid beta (Aβ); however, the molecular mechanism by which inflammation impairs the ability of microglia to mediate the clearance of Aβ is not well-understood. Recently, a single-cell RNA-sequencing study identified disease-associated microglia (DAM) present in spatial proximity to Aβ plaques found in both postmortem human AD brain samples and in an AD mouse model (12). Cellular markers of DAM include Cst7, which encodes cystatin F, an endosomal/lysosomal cathepsin inhibitor (13). However, the functional role of DAM has not been well-characterized, nor do we know the significance of Cst7 expression in this microglial population.
RIPK1, a death-domain containing Ser/Thr kinase, has an established role in mediating the deleterious mechanisms downstream of type I TNFα receptor (TNFR1) (14). Mice carrying the RIPK1 D138N or K45A kinase-dead knock-in mutation develop normally but are resistant to a TNFα-induced systemic inflammatory response (15, 16). We have developed a highly specific and CNS-permeable inhibitor of RIPK1 kinase, Necrostatin-1 (Nec-1s, R-7-Cl-O-Nec-1) (Kd = 3.1 nM) (17–20). Inhibition of RIPK1 by Nec-1s phenocopied the genetic inactivation of RIPK1 by D138N or K45A mutations in protection against TNFα-induced systemic inflammatory response and animal models of neurodegeneration (15, 16, 21, 22). While RIPK1 is involved in mediating the activation of RIPK3 and MLKL to promote necroptosis, RIPK1 has also been implicated in regulating inflammation, independent of cell death (14, 20, 23). However, it remains unclear how the activation of RIPK1 kinase might be involved in mediating neuroinflammation in AD (21, 22, 24).
Here, we investigated the role of RIPK1 in AD. We found that RIPK1 is highly expressed by microglial cells in human AD brains. To test the involvement of RIPK1 in AD, we examined the impact of RIPK1 in the amyloid precursor protein (APP)/presenilin 1 (PS1) transgenic mouse model. We found that, compared with control APP/PS1 animals, plaque burden, and insoluble Aβ levels were strongly reduced in RIPK1D138N kinase-dead knock-in;APP/PS1 double mutant mice, and by the treatment of APP/PS1 mice with the RIPK1 inhibitor Nec-1s. Furthermore, inhibition of RIPK1 attenuated the behavioral deficits observed in the APP/PS1 mice. Moreover, in both RIPK1D138N;APP/PS1 mice and APP/PS1 mice dosed with Nec-1s, there was a significant reduction in amyloid plaque-associated microglia and the levels of proinflammatory cytokines. We demonstrate that the kinase activity of RIPK1 mediates the transcriptional up-regulation of Cst7, which encodes an endosomal/lysosomal cathepsin inhibitor named Cystatin F (25), and CH25H in microglia. We present evidence that RIPK1-dependent induction of Cst7 leads to inhibition of cathepsin activity and impairment in the lysosomal pathway. Consistently, inhibition of RIPK1 could promote the degradation of Aβ by microglia in vitro. Together, our study provides a mechanism by which activation of the RIPK1-mediated transcriptional response promotes a DAM state, which in turn impairs the microglial phagocytic capacity. Thus, we propose that RIPK1 is a critical mediator in microglial response to the extracellular environment to promote pathogenesis of AD. Our data provide a strong rationale for blocking RIPK1 as a novel therapeutic for AD.
Results
The Levels of RIPK1 Are Increased in AD.
To examine whether RIPK1 is involved in the pathophysiology of AD, we performed immunostaining on postmortem cortical tissue from control and AD patients. We identified an increase in overall reactivity of RIPK1 in AD patient-derived brain tissues compared with the control tissues (Fig. 1A, Fig. S1 A–D, and Table S1). To this end, we identified an upper band in the Western blots of RIPK1 in the insoluble fraction of AD samples, which suggests that RIPK1 might be phosphorylated in AD samples (Fig. 1B). To explore the phosphorylation status of RIPK1 in AD, we used a phospho-S166 RIPK1 antibody, a marker for its autophosphorylation and activation (19, 22, 26), and found increased S166 phosphorylation of RIPK1 in AD brain samples, suggesting that RIPK1 is activated in human AD (Fig. 1C). On the other hand, although we observed an increase in levels of TNFα, as previously reported (27, 28), no changes in the mRNA levels of RIPK1 were found in AD (Fig. 1D), suggesting that the increase in the levels of insoluble RIPK1 protein is a result of posttranslational control. A significant proportion of RIPK1+ cells in the brains of human AD exhibited microglial morphology and colocalized with the microglial marker IBA1 (Fig. 1E). Taken together, these results suggest that RIPK1 is activated in AD brains and might be involved in regulating disease-associated microglial function.
Fig. 1.

Elevated levels of active RIPK1 in cortical samples from AD patients. (A) Immunostaining using anti-RIPK1 antibody in slices from the temporal lobe from control and AD patients. (Inset, Bottom) Higher magnification images. (B) Western blot analysis of RIPK1 from control (Con) and AD patient postmortem temporal lobe-derived tissue; the soluble fraction was isolated from buffer with Triton (1%), and the insoluble fraction was subsequently solubilized using buffer with 6 M urea. (C, Top) Representative Western blot analysis of control and AD cortical tissues for RIPK1 and p-S166-RIPK1 levels in insoluble fractions (dissolved in 6 M urea) from five control and five AD patients. (Bottom) Quantifications of samples from 10 control and 10 AD cases probed with antibodies against RIPK1 and normalized to actin loading control. Data are represented as the normalized means ± SEM, n = 10 replicates per group (**P < 0.01, Student’s t test). (D) RNA was isolated from postmortem tissue from control and AD patients. Levels of RIPK1 and TNFα transcripts were examined. GAPDH was used as a housekeeping gene, and fold change was determined using the ΔΔCT method (**P < 0.01, Student’s t test). (E, Top) Coimmunostaining using anti-RIPK1 antibody and the microglial marker IBA1 in slices from the temporal lobe from a control and an AD patient. (Bottom) Higher magnification images. (F, Top) Western blot analysis from the soluble and insoluble fractions from brains of WT and APP/PS1 mice (7 mo old) probed with antibodies against APP, RIPK1, and Actin, used as a loading control. (Bottom) Graph representing the quantification of Western blot results of RIPK1 normalized to actin (data are means ± SEM, n = 6 to 8 animals per group). RNA was isolated from WT and APP/PS1 mouse brains. Levels of RIPK1 transcript were examined. GAPDH was used as a housekeeping gene, and fold change was determined using the ΔΔCT method (*P < 0.05, Student’s t test). (G, Top) Coimmunostaining using anti-RIPK1 antibody and the microglial marker IBA1 close to an Aβ plaque in slices from 7-mo-old APP-PS1 mice. (Bottom) Higher magnification images. Images are representative from experiments done on eight animals.
Fig. S1.


(A–C) Low magnification immunostaining using anti-RIPK1 antibody in slices from the frontal and temporal lobes from human control and AD patients. (D) Western blot analysis of RIPK1 from control and AD patient’s postmortem temporal lobe-derived tissue: the soluble fraction–Triton (1%) soluble and the urea soluble and urea insoluble fractions. Three control and three AD patient samples were used. (E) Coimmunostaining using anti-RIPK1 antibody and the astrocyte marker GFAP from the temporal AD patients. Four AD patient’s slices were used. (F, Top) Coimmunostaining using anti-RIPK1 antibody and the astrocyte marker GFAP close to an amyloid plaque in slices from 7-mo-old APP/PS1 mice. (Bottom) Higher magnification images. (G) Quantification of RIPK1-positive IBA1 and GFAP cells in human AD and mouse APP/PS1 tissue (n = 3 brain slices per group). (H, Top) Coimmunostaining using anti-RIPK1 antibody and axonal marker neurofilament close to an Aβ plaque in slices from 7-mo-old APP/PS1 mice. (Bottom) Higher magnification images.
Table S1.
The demographic characteristics of human pathological samples
| Sample no. | Age | Sex | PMI | Diagnosis | Other | Regions given |
| 1215 | 52 | F | 28 | Control | N/A | Temp, clbm |
| 1301 | 85 | M | Control | B&B: II | Fr, temp, clbm | |
| 1477 | 92 | M | 12 | Control | B&B: II | Fr, temp, clbm |
| 1506 | 86 | M | 10 | Control | Fr, clbm | |
| 1544 | 87 | M | 48 | Control | B&B: I | Fr, clbm |
| 1641 | 63 | M | 16 | Control | Fr, temp, clbm | |
| 1566 | 72 | M | 25 | AD | Fr, temp, clbm | |
| 1619 | 82 | M | 24 | Control | Fr, temp, clbm | |
| 409 | 81 | F | 15 | FAM AD | CERAD: C | Fr, temp, clbm |
| a1567 | 90 | F | 12 | AD | B&B: V, CERAD: B | Fr, clbm |
| 1581 | 89 | M | 22 | AD | B&B: VI, CERAD: B | Fr, temp, clbm |
| 1587 | 72 | M | 24 | AD | B&B: VI, CERAD: B | Fr, temp, clbm |
| 1591 | 79 | F | 30 | AD | B&B: VI, CERAD: B | Fr, temp, clbm |
| 1598 | 83 | M | 27 | AD | B&B: VI, CERAD: B | Fr, temp, clbm |
| 1602 | 93 | F | 15 | AD | B&B: V, CERAD: B | Fr, temp, clbm |
| 1604 | 69 | F | 24 | AD | B&B: VI, CERAD: C | Fr, temp, clbm |
| 1620 | 89 | M | 14 | AD | B&B: IV, CERAD: B | Fr, temp, clbm |
All samples were from white subjects. B&B, Braak stage; CERAD, Consortium to Establish a Registry for Alzheimer's Disease neuropsychological battery; Clbm, cerebellum; F, female; FAM, familial; Fr, frontal cortex; M, male; N/A, clinical diagnosis was not obtained; PMI, postmortem interval; temp, temporal lobe.
Inhibition of RIPK1 Kinase Reduces Inflammation in the CNS of the AD Mouse Model.
We next used APP/PS1 mice as a model to characterize the functional role of RIPK1 in the development of AD pathology. We first examined the expression of RIPK1 in APP/PS1 mice. Interestingly, similar to the data from human AD cortical samples, RIPK1 levels in the insoluble fraction were significantly elevated in the APP/PS1 mice (6 mo old) (Fig. 1F). This increase of RIPK1 also occurred in IBA+ microglia around amyloid plaques, as assessed by immunohistochemistry (Fig. 1G). On the other hand, RIPK1 reactivity only showed limited colocalization with GFAP+ astrocytes and did not colocalize with neurons or neuronal processes throughout most of the brain, except there was some overlap of RIPK1 immunostaining with dystrophic neurites (Fig. S1 E–H).
To determine whether RIPK1-dependent signaling mediates the development of disease pathology, we delivered either vehicle or Nec-1s to APP/PS1 mice (5 mo old) for a period of 1 mo. We examined the impact of inhibiting RIPK1 on the numbers of cortical and hippocampal plaques. Nec-1s–treated animals had reduced numbers of Thioflavin S-positive (ThS+) inclusions and Aβ-immunoreactive plaques, compared with vehicle-treated animals (Fig. 2 A and B and Fig. S2). Furthermore, we characterized the levels of soluble and insoluble Aβ species in vehicle-treated and Nec-1s–treated mice and found that the treatment of Nec-1s reduced the levels of both Aβ species (Fig. 2C). Our data suggest that administration of Nec-1s mediates a histological and biochemical reduction of amyloid burden in the APP/PS1 mice.
Fig. 2.

Pharmacological inhibition of RIPK1 attenuates biochemical pathology and behavioral deficits in the APP/PS1 mouse. Five-month-old WT and APP/PS1 mice were given vehicle or Nec-1s for 1 mo. The brain slices from these mice were examined by histology for ThS+ inclusions in the cortex (A and B) and hippocampus (B). (C) Nec-1s inhibited the APP/PS1-induced increase of ThS+ plaques. Furthermore, Nec-1s attenuated the increase of both soluble and insoluble (guanidine-soluble) Aβ1–42 in APP/PS1 mice (n = 6 to 8 mice per group). ns, not significant. (D) WT and APP/PS1 mice (∼5 mo old) were given vehicle or Nec-1s for 1 mo and examined in the open field test (n = 7 to 9 male mice per group) for 60 min; the total ambulatory distance the mice traveled was quantified. (E) The distance the mice traveled during 5-min bins was also assessed in the APP/PS1 mice. (F) WT and APP-PS1 mice (∼6 mo old) were assessed using the water T-maze to evaluate spatial working memory. A significant decrease was observed in both the acquisition phase (Left) and the reversal phase (Middle) in ∼6-mo-old APP/PS1 mice compared with WT mice (n = 12 to 14 male mice per group). (Right) The same mice were randomly split into two groups per genotype and given either vehicle or Nec-1s for 1 mo and then reassessed in the reversal phase of the water T-maze. *P < 0.05; **P < 0.01; one-way ANOVA followed by Bonferroni's post hoc test.
Fig. S2.

WT and APP/PS1 mice (5 mo old) were given vehicle or Nec-1s for 1 mo. Brain slices from these mice were immunostained with an Aβ1–42 antibody (Top). Plaque numbers were quantified in each brain slice inclusion in the cortex (Bottom). Data are represented as the number of plaques per slice, n = 3 to 4 slices per animal, seven to eight animals per group (*P < 0.05, Student’s t test).
To assess if pharmacological inhibition of RIPK1 can also rescue behavioral deficits in the APP/PS1 mice, we examined WT and APP/PS1 mice at 5 mo of age in an open field test for the total distance traveled in a new environment. Consistent with the effect of expressing APP/PS1 in promoting hyperactivity of mice (29, 30), APP/PS1 mice showed significant increased spontaneous locomotor activity, illustrated by a significantly greater distance traveled in the testing chamber during the first hour of the open field test compared with WT mice (Fig. 2 D and E). After confirming these data, APP/PS1 mice were then divided into groups so their baseline activity levels did not differ between genotype-matched groups that received vehicle or Nec-1s. APP/PS1 mice and WT controls were tested again after dosing with vehicle or Nec-1s for 30 d (n = 14 mice per genotype and treatment) in the open field test. These results suggest that inhibition of RIPK1 reduced the hyperactivity of APP/PS1 mice to WT levels.
We next used the water T-maze, which requires mice to use visual and spatial cues to locate a submerged escape platform for assessing spatial learning and memory (acquisition trials) and cognitive flexibility (reversal trials). A significant decrease was observed in both the acquisition phase and the reversal phase in 5- to 6-mo-old APP/PS1 mice, as previously reported at this age (31). Importantly, age-matched APP/PS1 mice that were dosed with Nec-1s for 1 mo performed as well as WT mice in both reversal phases (Fig. 2F), suggesting that inhibition of RIPK1 can improve the spatial memory in the APP/PS1 mice.
Inhibition of RIPK1 Kinase Activity Reduces Amyloid Burdens in APP/PS1 Mice.
To determine if the kinase activity of RIPK1 is important to drive the pathology in the APP/PS1 mice, we crossed APP/PS1 mice with the kinase-dead RIPK1D138N mice and aged these mice for 6 to 7 mo. To investigate whether genetic inactivation of RIPK1 kinase activity could alter Aβ pathology, we compared the amyloid burden of APP/PS1 and APP/PS1;RIPK1D138N double mutant mice in both cortex and hippocampus. We found that APP/PS1;RIPK1D138N mice had reduced numbers of ThT+ inclusions and Aβ1–42 immunoreactive plaques compared with APP/PS1; WT mice (Fig. 3 A and B). We also measured the CNS levels of soluble and insoluble Aβ1–42. APP/PS1;RIPK1D138N mice had lower levels of both soluble and insoluble levels of Aβ1–42, compared with APP/PS1;WT mice (Fig. 3C). These data show that both pharmacological and genetic inhibition of RIPK1 activity can reduce the amyloid burden of APP/PS1 mice.
Fig. 3.

Genetic inhibition of RIPK1 attenuates biochemical pathology and behavioral deficits in the APP/PS1 mouse. WT, RIPK1D138N, APP/PS1;WT, and APP/PS1;RIPK1D138N mice were examined by histology for ThS+ inclusion in the cortex (A and B) and hippocampus (B). Genetic inhibition of RIPK1 kinase by D138N mutation reduced the levels of ThS+ plaques. (C) Additionally, there were reduced levels of both soluble and insoluble (guanidine-soluble) Aβ1–42 in the APP/PS1;RIPK1D138N mice compared with the APP/PS1;WT mice (n = 6 to 8 mice per group). ns, not significant. (D) Six-month-old male WT, RIPK1D138N, APP/PS1;WT, and APP/PS1;RIPK1D138N mice were examined in the open field test (n = 7 to 8 male mice per group) for 60 min; the total ambulatory distance the mice traveled was quantified. (E) The distance the mice traveled during 5-min bins was also assessed. (F) The water T-maze was used to evaluate spatial working memory in APP/PS1 mice. A significant decrease was observed in both the acquisition phase (Left) and the reversal phase (Right) in 5- to 6-mo-old APP/PS1 mice (n = 7 to 9 male mice per group. *P < 0.05, one-way ANOVA followed by Bonferroni's post hoc test.
To test whether genetic inactivation of RIPK1 can also inhibit APP/PS1-driven behavioral deficits, we assessed WT, RIPK1D138N, APP/PS1;WT, and APP/PS1;RIPK1D138N mice in the open field test. Similar to our data using Nec-1s, genetic inactivation of RIPK1 kinase activity reduced the hyperactivity of APP/PS1 mice (Fig. 3 D and E). Furthermore, inactivation of RIPK1 in APP/PS1;RIPK1D138N mice also improved the performance relative to APP/PS1;WT mice in the water T-maze (Fig. 3F). Thus, loss of RIPK1 kinase activity can reduce the memory deficits in APP/PS1 mice.
RIPK1 Is a Key Mediator of Disease-Associated Microglial Response.
Our data suggest that inhibiting RIPK1, by either pharmacological or genetic means, reduces amyloid burden and improves memory function in APP/PS1 mice. We next took both an in vivo and in vitro approach to investigate the mechanism through which RIPK1 may mediate pathology in AD. Using primary mouse cortical neurons in culture, we did not observe an effect of Nec-1s in directly protecting oligomeric Aβ1–42-induced neuronal death (Fig. S3A). On the other hand, zVAD.fmk, a pancaspase inhibitor, inhibited neuronal cell death induced by Aβ1–42, confirming the role of caspases in mediating Aβ-induced neuronal cell death (32, 33). Consistently, the enriched expression of RIPK1 was found predominantly in microglia (Fig. 1). We hypothesized that microglia might be a key effector of the deleterious signaling mediated by RIPK1 in AD. Interestingly, we found that the number of plaque-associated microglia was reduced in APP/PS1;RIPK1D138N mice compared with APP/PS1;WT mice (Fig. 4 A and B). Furthermore, the levels of the proinflammatory cytokines TNFα and IL1β were reduced in APP/PS1;RIPK1D138N mice compared with APP/PS1;WT mice (Fig. 4C). These data suggest that inhibiting RIPK1 blocks some of the deleterious disease-associated microglial response in the APP/PS1 mice.
Fig. S3.

(A) Primary mouse cortical neurons (DIV 10) were treated with oligomeric Aβ1–42 in the presence of either vehicle, Nec-1s, or zVAD.fmk. The cell viability was assessed by using the Cell Titer-Glo assay. (B) Primary microglia were isolated from WT mice (two to three replicate experiments). The cells were treated with oligomeric Aβ1–42 for 24 h in the presence of either vehicle or Nec-1s. RNA levels of TNFα and IL6 were assessed by quantitative real time PCR (Top). Primary microglia were isolated from WT and RIPK1D138N mice and treated with oligomeric Aβ1–42 for 24 h. The RNA levels of TNFα and IL6 were assessed by quantitative real time PCR (Bottom). (C) Primary microglia were isolated from WT mice and treated with fluorescently labeled oligomeric Aβ1–42 for 8 h in the presence of either vehicle or Nec-1s. High content imaging and analysis were used to quantify the amount of Aβ1–42 associated with the microglia in each condition (two replicate experiments). (D) Primary microglia were isolated from WT and RIPK1D138N mice. The cells were treated with fluorescently labeled oligomeric Aβ1–42 for 8 h (four replicate experiments). *P < 0.05, **P < 0.01.
Fig. 4.

Genetic inhibition of RIPK1 reduces the microglial inflammatory response in the APP/PS1 mouse. (A) Representative images of immunostaining using anti-Aβ 6E10 antibody and the microglial marker IBA1 in slices from APP/PS1 and APP/PS1;RIPK1D138N mice (7 mo old). (B) Quantification of IBA1-positive cells that are associated with Aβ plaques (15 slices were quantified per genotype; *P < 0.05, Student’s t test). (C) The levels of TNFα and IL1β protein in the brains of WT, RIPK1D138N, APP/PS1;WT, and APP/PS1;RIPK1D138N mice were examined by ELISA. The quantification is represented ±SEM; n = 6 to 9 animals per group in the graph. *P < 0.05, Student's t test. (D) Primary microglia were isolated from WT or RIPK1D138N and were treated with oligomeric Aβ1–42 in the presence of either vehicle or Nec-1s. The levels of TNFα were examined by ELISA, 24 h after treatment. *P < 0.05 [Ab vehicle vs. Ab+Nec-1s]; #P < 0.05 [WT Ab vehicle vs. RIPK1D138B Ab vehicle]. (E) WT primary microglia were treated with increasing concentrations of oligomeric Aβ1–42 for either 6 h or 24 h in the presence of either vehicle or Nec-1s. Western blot analysis was used to examine RIPK1 activation by immunoblotting for p-S166 RIPK1. (F–H) WT primary microglia were treated with oligomeric Aβ1–42. Both extracellular (F) and intracellular (G) levels of Aβ1–42 were examined by both dot-blot and by ELISA. *P < 0.05, Student's t test. (H) The time course of the intracellular levels of Aβ1–42 was examined by Western blot analysis in the presence of either vehicle or Nec-1s. Images are representative of two to three experiments.
To investigate the role of RIPK1 in the microglial response to Aβ, we treated primary WT and RIPK1D138N mouse-derived microglia with oligomeric Aβ1–42 in the presence or absence of Nec-1s. We found that either the presence of the RIPK1 inhibitor or genetic ablation of the kinase activity of RIPK1 reduced the production of TNFα and IL6 from microglia, in vitro, in response to Aβ1–42 (Fig. 4D and Fig. S3B). Furthermore, we found an increase in the levels of p-S166 RIPK1 in cultured microglia stimulated by Aβ1–42 peptides, suggesting that Aβ1–42 can promote the activation of RIPK1 (Fig. 4E). Both pharmacological and genetic inhibition of RIPK1 kinase activity enhanced the ability of microglia to degrade synthetic oligomeric Aβ1–42. We found that inhibition of RIPK1 by Nec-1s reduced both supernatant and intracellular levels of Aβ1–42 in microglia (Fig. 4 F–H). This result was confirmed using FITC-labeled Aβ1–42 (Fig. S3 C and D). These data suggest that RIPK1 activation may alter the dynamics of Aβ turnover. Thus, inhibition of RIPK1 increases the turnover of Aβ1–42 and the production of proinflammatory cytokines by microglia.
RIPK1 Mediates an Altered Microglial Response.
While our data using primary microglial culture suggests a role for RIPK1 signaling in these cells, we wanted to directly investigate RIPK1 signaling in acutely isolated brain microglia. We isolated microglia from adult (5- to 6-mo-old) WT, RIPK1D138N, APP/PS1;WT, and APP/PS1;RIPK1D138N mice (Dataset S1). Consistent with an efficient isolation of adult microglial cells using CD11b and CD45 as surface markers for microglia, the top transcripts identified by RNA sequencing in these cells were either exclusive to microglial cells or highly enriched in these cells (Fig. S4A and Table S2). As reported (34), we did not detect a significant increase in the population of CD45high and CD11b+ cells in the CNS of 5- to 6-mo-old APP/PS1 mice compared with that of WT mice. These data suggest that, at this age, the majority of CD11b+ cells are resident microglia. This is in contrast to older APP/PS1 animals (35) that have an increase in CD45high and CD11b+ cells compared with WT mice.
Fig. S4.

(A, Left) Representative FACS plot of the population of CD45-positive CD11b-positive brain-derived microglia that were used for subsequent RNA-seq experiments. (Right) Distribution of the number of genes identified in the RNA-seq experiment (x axis), relative to the read counts for that gene (y axis), based on all 13 samples used for this experiment. (B) Microglia were isolated from WT, RIPK1D138N, APP/PS1;WT, and APP/PS1;RIPK1D138N mice (5 to 6 mo old), and the RNA levels of CCL3, CD200R1, CAP1, and ARSB were assessed by quantitative real time PCR.
Table S2.
Validation of microglial RNA-seq
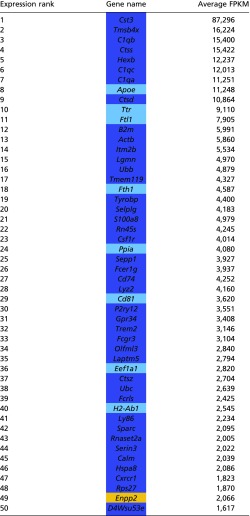 |
Transcripts that are known to be of microglial origins were highly enriched in the RNA-seq dataset. FPKM, fragments per kilobase of transcript per million mapped reads. Dark blue, microglial-specific; light blue, microglial high; orange, other.
We performed RNA sequencing of CD45+/CD11b+ cells to examine the role of the RIPK1-dependent transcriptional program activated in APP/PS1 mice. The pathway that was prominently altered specifically in microglia from APP/PS1 mice was the ubiquitin/proteasome system (Fig. 5A). This is consistent with the idea that the protein turnover machinery is altered in aging and neurodegeneration (36). Our study suggests that this alteration of protein homeostasis may at least in part occur in microglia. Many key components of both the ubiquitin/proteasomal (UPS) and lysosomal degradation systems are highly expressed in microglial cells. One intriguing possibility is that alterations in the proteasomal/lysosomal systems can promote the activation of RIPK1. To directly test this possibility, we subjected primary isolated microglial cells or a microglial cell line to either inhibitors of the UPS or the lysosomal activity. Interestingly, we found that the inhibition of either UPS or the lysosomal system led to rapid induction of RIPK1 activation as assessed by p-S166 RIPK1 which could be inhibited by Nec-1s (Fig. 5 B and C). This activation of RIPK1 was at least in part similar to that observed following Toll-like receptor activation induced by LPS (Fig. 5B). These data suggest that RIPK1 may regulate some aspects of proteostasis in microglial cells.
Fig. 5.

Defects in protein turnover promote the activation of RIPK1 in APP/PS1 microglia. (A) Pathways and processes that are enriched in APP/PS1-derived microglia transcriptome compared with WT mice. Analysis was done using gene set enrichment analysis (MSigDB; Broad). (B) WT primary microglia were treated with either vehicle chloroquine (50 μM), MG132 (10 μM), or LPS (10 ng/mL) for the indicated amount of time (min). Western blot analysis was used to examine RIPK1 activation by immunoblotting for p-S166 RIPK1. Images are representative of two to three experiments. (C) WT primary microglia were treated with chloroquine (50 μM) in the presence of either vehicle or Nec-1s. Western blot analysis was used to examine RIPK1 activation by immunoblotting for p-S166 RIPK1. Images are representative of two experiments. (D) Microglia were isolated from adult WT, RIPK1D138N, APP/PS1;WT, and APP/PS1;RIPK1D138N mice (5 to 6 mo old) and analyzed by RNA-seq. Our coexpression analysis identified a module with ∼149 genes that were up-regulated in APP/PS1 microglia and suppressed in APP/PS1;RIPK1D138N microglia. (E) Pathways and processes that are enriched in the genes that are up-regulated in the APP/PS1-derived microglia vs. WT-derived microglia and the increase is attenuated in the APP/PS1;RIPK1D138N-derived microglia. Analysis was done using gene set enrichment analysis (MSigDB; Broad). (F) The transcription factors that can regulate the expression of these 149 genes were also examined. Analysis was done using gene set enrichment analysis (MSigDB; Broad). Data are represented as an FDR q-value (×10−6).
Our data thus far suggest that RIPK1 mediates an altered microglial state in APP/PS1 mice. Interestingly, RNA-seq expression analysis identified a module with ∼149 genes that were up-regulated in APP/PS1 microglia compared with that of WT, RIPK1D138N, and APP/PS1;RIPK1D138N microglia (Fig. 5D). We validated a subset of our RNA-seq hits by real-time quantitative reverse-transcription–PCR (qRT-PCR) (Fig. S4B). These data suggest that there may be a transcriptional program that is activated in microglia from APP/PS1 mice in a RIPK1-dependent manner. We performed pathway analysis (MSigDB; Molecular Signatures Database) (37) and identified that the top RIPK1-mediated pathways in microglia include the metabolism of biopolymers and nucleic acids (Fig. 5E). We also analyzed the genes differentially expressed in APP/PS1 microglia using MSigDB (Molecular Signatures Database) (37) to identify transcription factors whose targets are overrepresented. Among these regulatory proteins, we identified a significant overrepresentation of predicted SP1 and cJUN transcription factor targets (Fig. 5F), which is consistent with previous reports of transcription factors associated with RIPK1 signaling (20, 21).
We next explored the possibility that some of the RIPK1-regulated genes identified here may be altered in other neurodegenerative and neuroinflammatory models. We found that the expression of at least eight RIPK1-regulated genes was also altered in the 5xFAD model of AD, in the SOD1G93A model of ALS, and in aging microglia (Fig. 6A). One of the genes whose expression was altered in a RIPK1-dependent fashion was CH25h (Fig. 6 A and B), a risk factor identified in LOAD (38). The expression of CH25h in BV2 cells was induced following IFNγ treatment in a RIPK1-dependent manner (Fig. 6C). CH25h is a cell surface bound enzyme that is involved in cholesterol and lipid metabolism and mediates the production of 25-hydroxycholesterol. Previous studies have linked this gene to AD and an immunomodulatory pathway (7). Our data show that this enzyme is induced in primary microglia in a RIPK1-dependent manner in an AD mouse model.
Fig. 6.

RIPK1-mediated transcriptional program impairs lysosomal function. (A) A multistudy comparison of the transcription levels of several genes up-regulated in a RIPK1-dependent manner in APP/PS1 microglia vs. APP/PS1;RIPK1D138N microglia with the published datasets. Column 2, APP/PS1 vs. WT microglia; column 3, APP/PS1;RIPK1D138N vs. WT microglia; column 4, APP/PS1 vs. WT microglia (64); column 5, 5xFAD vs. WT microglia (65); column 6, LPS-stimulated vs. control microglia (66); column 7 microglia isolated from 4-mo-old mice vs. microglia isolated from 24-mo-old mice (67); column 8, microglia of SOD1G93A transgenic mice vs. WT control microglia (39). (B) A comparison of the transcript levels of CH25H in our microglia-derived RNA-seq dataset, whole brain tissue, and also a qPCR from a new cohort of brain-derived microglia in WT, RIPK1D138N, APP/PS1;WT, and APP/PS1;RIPK1D138N mice. (C) BV2 cells were treated with IFNγ in the presence or absence of Nec-1s. CH25H transcript levels were assessed by qPCR. (D) A comparison of the Cst7 transcript levels in our brain-derived microglia RNA-seq dataset, whole brain tissue, as well as qPCR from a new cohort of brain-derived microglia from WT, RIPK1D138N, APP/PS1;WT, and APP/PS1;RIPK1D138N mice. (E) BV2 cells were treated with IFNγ in the presence or absence of Nec-1s. CST7 transcript levels were assessed by qPCR. *P < 0.05, **P < 0.01, ***P < 0.001, Student’s t test.
Interestingly, a subset of the genes we identified as being up-regulated in microglia from APP/PS1 mice in a RIPK1-dependent manner were recently reported as top biomarkers associated with DAM in AD by a single-cell RNA-seq analysis (12) (Fig. S5). We performed additional experiments to validate the expression of Cst7, a gene encoding a endosomal/lysosomal cathepsin inhibitor known as cystatin F and normally expressed by immune cells (13), that was indeed regulated by RIPK1 in microglia; and, furthermore, its expression was also enhanced by IFNγ in an RIPK1-dependent manner. (Fig. 6 D and E). Cst7 is massively induced in the CNS in microglia of SOD1G93A transgenic mice (up to 52-fold) (39), aging microglia, during demyelination (40), and in a prion disease model (41). Our data show a robust increase of this transcript in APP/PS1 mice (Fig. 6D). To confirm that CST7 protein levels were also induced, we analyzed the expression of Cst7 in APP/PS1 by immunostaining using an anti-Cst7 antibody (42). The levels of Cst7 were increased in the APP/PS1 mouse brains compared with WT animals (Fig. 7A). The aggregation of IBA1+ microglial cells around amyloid deposits is a hallmark of AD (43, 44). We found that Cst7 was highly expressed in the IBA1+ microglia around ThS+ plaques in the cortex of APP/PS1 mice (Fig. 7 B and C) while dispersed IBA+ microglia were generally not positive for Cst7 (Fig. 7C). Importantly, inhibition of RIPK1 in APP/PS1;RIPK1D138N microglia led to the loss of Cst7+/IBA1+ microglia. In human AD brains, we also detected increased levels of Cst7 RNA, as assessed by qPCR (Fig. 7D), and Cst7 protein, as assessed by immunostaining (Fig. 7E).
Fig. S5.

A Comparison of RIPK1-regulated transcriptional changes with those reported to be associated with DAM. A comparison of the transcript levels of DAM-associated genes (12) in the microglia derived RNA-seq dataset in WT, RIPK1D138N, APP/PS1;WT, and APP/PS1;RIPK1D138N mice that were attenuated with inhibition of RIPK1 kinase activity by RIPK1D138N mutation (A) and those that were not (B).
Fig. 7.

CST7 is increased in AD. (A) Immunostaining using anti-CST7 antibody in slices from the WT and APP/PS1 mice in both the cortex and hippocampus (Hipp). (Bottom) Higher magnification of APP/PS1 slices in the cortex. Three WT and three APP/PS1 animals were used to validate this finding. (B) Immunostaining using anti-CST7 antibody in slices from APP/PS1 mice in the cortex followed by ThS+ staining. Two magnifications are shown. Three WT and three APP/PS1 animals were used to validate this finding. (C) Coimmunostaining using an anti-CST7 antibody and the microglial marker IBA1 in slices from WT, APP/PS1, and APP/PS1;RIPK1D138N. DAPI was used to stain nuclei. Three WT and three APP/PS1 animals were used to validate this finding. (D) RNA was isolated from postmortem tissue from control and AD patients. Levels of CST7 were examined by q-PCR. GAPDH was used as a housekeeping gene, and fold change was determined using the ΔΔCT method (**P < 0.01, Student’s t test; five control and five AD patients). (E) Immunostaining using anti-CST7 antibody in slices from the temporal lobe from control and AD patients. (Bottom) Higher magnification images from AD tissue. (F) Brain cells derived from WT or APP/PS1 animals (5 to 6 mo old) treated with either Nec-1s or vehicle for 1 mo were then FACS sorted based as CD11b+ CD45low/intermediate vs. CD11b+ CD45High cells. RNA levels of CST7 and Ch25H in both populations of cells (n = 3 to 4 animals per group, **P < 0.01, #P < 0.05 [APP/PS1 CD45 low/inter vs. APP/PS1 CD45 high], Student’s t test). (G) BV2 cells were transfected with either empty vector or a CST7 expressing plasmid overnight. The cells were then treated with either vehicle or chloroquine for 4 h. Western blot analysis was performed to examine RIPK1, p62, LC3, p-cJun and cJun levels. Beta actin was used as a loading control. Western blot images are representative of two experiments. (H) Vector or CST7 was transfected in HEK293T or BV2 cells, and cathepsin C activity was assessed by a fluorometric assay.
Our data suggest that CST7 levels are increased in microglia in APP/PS1 mice and in human AD brains. To examine whether increased Cst7 and Ch25h induction is localized in a subpopulation of microglial or macrophages, we performed FACS sorting experiments for CD11b+ cells that expressed different levels of CD45 (CD45low/intermediate vs. CD45High) (Fig. S6). Consistent with the notion that the CD11b+CD45high cells represent macrophages and activated microglia (45), TREM2 surface levels were higher in this cell population compared with the CD11b+ CD45low/intermediate population (46) (Fig. S6 A and B). While RIPK1 and TMEM119 were expressed in both of these populations and their expressions were not altered in the APP/PS1 mice or by Nec-1s, there was a significant induction of both Cst7 and Ch25H in both CD45-expressing populations, which was attenuated by inhibition of RIPK1 (Fig. 7F). However, the fold induction of Cst7 in the APP/PS1 mice in the CD45high population is dramatically higher than that in the CD45low/intermediate population. These data confirm that Cst7 increase is predominantly in the activated or disease-associated microglia.
Fig. S6.

(A) Representative FACS plot of CD45 and CD11b immunostained that were sorted as CD45low/intermediate vs. CD45High cells, which were used for qRT-PCR. (B, Top) Representative FACS plot of TREM2 surface expression in CD11b+/CD45low/intermediate and CD11b+/CD45High cell populations. (Bottom) Mean fluorescent intensity was quantified (n = 3 to 4 animals per group, **P < 0.01, Student’s t test). (C) FACS sorted microglia/macrophages from WT or APP/PS1 animals (5 to 6 mo old) treated with either Nec-1s or vehicle for 1 mo and the RNA levels of TMEM119, RIPK1 were assessed by real time qPCR in both CD11b+ CD45low/intermediate and CD11b+ CD45High cells (n = 3 to 4 animals per group).
While previous reports have not fully elucidated the functional significance of DAM around amyloid plaques, the RIPK1-dependent induction of Cst7, a lysosomal cathepsin inhibitor, suggests that RIPK1 might regulate lysosomal function in microglia. To directly test this possibility, we transfected Cst7 into BV2 cells. We found that the expression of Cst7 led to the accumulation of p62 and LC3II, which was minimally further impacted upon the addition of lysosomal inhibitor chloroquine (Fig. 7G and Fig. S7). Thus, the increased expression of Cst7 can attenuate lysosomal function in a microglial cell line. Finally, we directly tested the effect of expressing Cst7 on intracellular cathepsin L activity and found that CST7 overexpression attenuated activity in a dose-dependent manner in both BV2 cells and 293T cells (Fig. 7H). These data suggest that attenuation of lysosomal function, as it occurs in a subset of AD-associated microglia (47), may be in part regulated by RIPK1 signaling.
Fig. S7.

BV2 cells were transfected with either empty vector (HA), GFP, or an HA-CST7–expressing plasmid overnight. To confirm the expression of Cst7, anti-HA conjugated beads were used to immunoprecipitate HA-Cst7, treated with endoH to remove glycosylation and then analyzed by immunoblotting using anti-CST7 (two replicates experiments were done).
Discussion
In this study, we demonstrate that the levels of RIPK1 are elevated in microglia in postmortem cortical samples from AD patients and in a mouse model of AD. We show that inhibiting the kinase activity of RIPK1 is effective in inhibiting microglial inflammation in vitro and in an animal model of AD. We demonstrate that inhibition of RIPK1 leads to increased clearance of Aβ in vitro by microglia and reduction of amyloid plaques in the CNS, in vivo. In addition, the inhibition of RIPK1 was correlated with a significant improvement in memory deficit of APP/PS1 mice. Two major hallmarks of AD pathogenesis are amyloid deposits comprised of Aβ fibrils and neuroinflammation. Microglia and macrophages are the major mediators of neuroinflammation in the CNS. Activation of these cells initiates the inflammatory cascade that results in the release of potentially neurotoxic cytokines to promote neurodegeneration. On the other hand, microglia are involved in uptake and removal of Aβ by phagocytosis and degradation in lysosomal cathepsins (48). However, persistent inflammation can impair the phagocytic ability of microglia through an unknown mechanism (49). Here, we show that promoting the expression of Cst7 in microglia by RIPK1 may be critical in reducing the phagocytic capacity of activated microglia. Since the generation and clearance of Aβ in the brain is subject to tight regulation, even a modest reduction in their clearance might be sufficient to lead to their accumulation and subsequent deposition into plaques to promote pathogenesis (50). Thus, effective modulation of neuroinflammation by inhibiting RIPK1 in the CNS might promote the clearance of Aβ species through microglia/macrophages by reducing the expression of Cst7. These data suggest that inhibition of RIPK1 is sufficient to reduce neuroinflammation mediated by microglia, which in turn reduces the formation of amyloid plaques and improves cognitive function, at least in the early stages of AD.
We show that reduction in protein turnover pathways mediated by proteasomes and lysosomes is sufficient to promote the activation of RIPK1. This is consistent with our previous observation where we show that optineurin deficiency promotes the activation of RIPK1 by reducing its turnover mediated by K48 ubiquitination (21). Defects in both the ubiquitin–proteasome (UPS) and lysosomal pathways have been found in AD (51, 52). We suggest that such defects in protein turnover in microglia might lead to the activation of RIPK1, which in turn promotes the transcription of genes such as Cst7 and a vicious cycle of microglial dysfunction and inflammation by further exacerbating phagocytic activity and lysosomal degradation.
Our results highlight the role of RIPK1 in mediating the microglial/macrophage disease-associated response in AD. These cells play an important role in mediating the disease progression of AD (53). Inhibition of RIPK1 by pharmacological or genetic means promoted the degradation of Aβ by microglia in vitro, as well as reduced amyloid plaque burden, and ameliorated the behavioral deficits observed in the APP/PS1 mice. Consistent with the role of RIPK1 in mediating neuroinflammatory response in the CNS, pharmacological inhibition of RIPK1 phenocopied the effect of genetic inactivation of RIPK1 in a variety of neuroinflammatory conditions, including TNFa-induced inflammation and animal models of AD, ALS, and multiple sclerosis (MS) (21, 22, 54). On the other hand, Nec-1s could not directly inhibit neuronal cell death induced by Aβ, suggesting that Nec-1s does not target Aβ or directly inhibit neuronal cell death. Inhibition of RIPK1 by Nec-1 has been shown to reduce the extent of injury in a variety of animal models (24), which is consistent with the role of RIPK1 as a key mediator of inflammation.
Our RNA-seq analysis of adult microglia identified CH25h, a susceptibility gene for late onset Alzheimer’s disease (38), as one of the RIPK1-regulated genes. The enzyme cholesterol 25 hydroxylase (Ch25h) catalyzes the rate-limiting step to synthesize the oxysterol 7α,25-dihydroxycholesterol (25HC) from cholesterol. 25HC is a potent corepressor of sterol regulatory element binding protein (SREBP) processing (55). Thus, CH25H is an important regulator of lipid metabolism. Interestingly, similar to that of Cst7, the transcriptional level of CH25H is also known to be up-regulated in the spinal cord of patients with ALS (56). CH25H is also up-regulated in microglia after the induction of experimental autoimmune encephalomyelitis (EAE), an animal model for MS (57). CH25H deficiency significantly attenuated EAE disease course by limiting trafficking of pathogenic CD4+ T lymphocytes to the CNS. In macrophages, 25HC has been shown to be induced by infection and act as an amplifier of inflammatory signaling by regulating transcription (58). Chronic induction of CH25H has been proposed to contribute both to atherosclerosis and to AD (59). Thus, the role of RIPK1 in regulating the transcriptional induction of CH25H is also consistent with the recent report about the involvement of RIPK1 in atherosclerosis (60).
Cst7, whose expression is found primarily in cells of the immune system, such as T cells, natural killer (NK) cells, and dendritic cells, can bind and inhibit cathepsin C (13). In these peripheral immune populations, cystatin F activity inhibits endosomal/lysosomal cathepsins and contributes to cellular differentiation and functions (61, 62). Here, we show that the activation of RIPK1-mediated transcriptional response leads to a highly elevated production of Cst7, a cathepsin inhibitor, in activated microglia/macrophages around the amyloid plaques and in human AD pathological samples. Increased expression of Cst7 led to microglial dysfunction by blocking lysosomal trafficking. Importantly, inhibition of RIPK1 restored the normal levels of Cst7 expression in APP/PS1 mice. Since increased expression of Cst7 has been found in multiple animal models of neurodegenerative diseases, including in the microglia of SOD1G93A transgenic mice (39), in aging microglia, during demyelination (40), in a prion disease model (41), and in human AD, inhibition of RIPK1 may modulate a microglial inflammatory response common in multiple neurodegenerative diseases. Thus, inhibiting RIPK1 and thereby reducing Cst7 up-regulation may alleviate lysosomal distress in microglia, which is known to be present in AD and its animal models (63), and be beneficial for the treatment of various inflammatory disease indications. Furthermore, increased levels of Cst7 may provide an important biomarker for RIPK1-dependent inflammation in neurodegenerative diseases.
Materials and Methods
Animals.
C57BL/6 (B6) mice were purchased from The Jackson Laboratory. All animals were maintained in a pathogen-free environment, and experiments on mice were conducted according to the protocols approved by the Harvard Medical School Animal Care Committee. B6C3-Tg(APPswe,PSEN1dE9)85Dbo/Mmjax (N9) C57BL/6 mice were purchased from JAX. Hemizygous B6C3-Tg(APPswe,PSEN1dE9)85Dbo/Mmjax (N9) C57BL/6 mice were used. RIPK1D138N mice were a kind gift from Manolis Pasparakis, University of Cologne, Cologne, Germany.
Nec-1s Administration.
The method of Nec-1s [R-5-((7-Chloro-1H-indol-3-yl)methyl)-3-methyl-2,4-imidazolidinedione] formulation and delivery was previously described in ref. 14. Custom synthesized Nec-1s was first dissolved in DMSO (50% wt/vol) and then transferred into 35% PEG solution, and this was suspended in water containing 2% sucrose. Mice were provided with vehicle control and Nec-1s as drinking water ad libitum. Each mouse drank vehicle or Nec-1s containing water about 5 to 10 mL/d (Nec-1s = 2.5 to 5 mg/d).
Statistical Analysis.
Data are expressed as mean ± SEM. Significance was assessed with Student’s t test or one-way ANOVA followed by Bonferroni’s post hoc test using Prism version 6.0 software (GraphPad).
SI Materials and Methods
Water T-Maze.
The animal behavior study was conducted in the NeuroBehavior Laboratory, Harvard Institute of Medicine. The mouse genotypes were blinded to the testers. The water T-maze (WTM) behavioral paradigm assesses spatial learning and memory by training mice to use the spatial cues in a room to navigate to a hidden platform to escape water. The test also measures cognitive flexibility through a reversal learning procedure in which mice must learn a new location of the hidden platform. The testing apparatus is a plus maze (each arm 14 cm in length and 4.6 cm in width) made of clear Plexiglas, with each arm designated as N, S, E, or W. A divider was placed on the maze to block off the appropriate arm so that the mouse could choose only the E or W arm for escape. The maze was filled with water (25 to 26 °C), and an escape platform was placed on the E side of the maze submerged 1 cm below the surface of the water. To ensure that the mice could not see the submerged platform, the water was made opaque by adding white, nontoxic paint. At the start of the trial, the divider was put in place to block off the appropriate arm, and mice were carried to the appropriate start point. The experimenter scored a correct or incorrect response for each trial, and mice were allowed to stay on the platform for 10 s before being removed. Mice were given 10 trials each day, with semirandomized starting points from the N and S positions. The criterion for acquisition was 80% or more correct responses averaged across the 10 trials for two consecutive days. The day after all of the mice had reached the acquisition criterion, reversal training began. The platform was moved to the opposite side (W), and the same procedure was repeated until the mice had learned the new position of the platform.
Open Field Activity Test.
The open field (OF) test measures both general locomotor activity and anxiety-like behavior in the mouse. The mouse OF chambers used (Med Associates) are made of clear Plexiglas and consist of a square base (27 cm × 27 cm) with walls 20 cm high. For each testing session, the mouse was allowed free exploration in the environment for 1 h. A computer-assisted infrared tracking system and software (Activity Monitor; Med Associates) was used to record the number of beam breaks and time and entries into center and peripheral zones. An increase in the percentage of ambulatory time (in seconds) spent in the center of the OF was used as a surrogate measure of anxiolytic-like behavior. The total distance traveled (in centimeters) was used as a measure of general locomotor activity.
Human Pathological Samples.
Frozen brain tissues from the frontal cortex and temporal lobes of 10 patients with AD and 10 nondemented control subjects were obtained from the Massachusetts Alzheimer’s Disease Research Center Brain Bank. The demographic characteristics of the subjects are shown in Table S1. Paraffin-embedded sections were deparaffinned and rehydrated. Two rounds of antigen retrieval were performed on the sections using citrate buffer. RIPK1 or cell-specific markers were incubated overnight. Appropriate biotinylated (Vector Laboratories) and fluorescently labeled (Invitrogen) secondary antibodies were used. The specificity of RIPK1 staining was confirmed by performing 3,3′-diaminobenzidine staining in the absence of primary antibody and by using two different RIPK1 antibodies.
ELISA.
Mouse cortex was homogenized in 1% Triton X-100 in PBS supplemented with Complete Protease Inhibitor (Roche). Total protein levels were determined by Bradford protein assay (Bio-Rad). The levels of TNFα, IL-6, and IL-1β in the brain were determined using the appropriate ELISA kit according to the manufacturer’s instructions (R&D Systems). Intracellular concentration of Aβ42 was measured using a specific sandwich-type ELISA (KHB3441, Human Aβ42 Kit; Invitrogen) according to the manufacturer’s instructions.
Histology and Immunochemistry.
Animals were killed and perfused with PBS followed by 4% paraformaldehyde. Then, 20-μm brain sections were prepared on a cryostat. For immunostaining, tissue sections were mounted and blocked with 10% normal goat serum and 1% BSA and then incubated with primary antibodies at 4 °C overnight. The following primary antibodies were used: GFAP (Invitrogen), IBA1 (Wako), CD11b (eBiosciences), RIPK1 (BD, Cell Signaling), RIPK3 (Serotec, Cell Signaling). Anti-Cst7 was a gift from Colin Watts, University of Dundee, Dundee, UK. Alexa Fluor secondary antibodies against the various species DAPI stains were purchased from Life Technology and used according to the manufacturer’s instructions. RIPK1 antibody specificity has previously been characterized (21, 22). All images were collected with a Nikon Ti-E confocal microscope equipped with an A1R scan head with spectral detector and resonant scanners; images were acquired with Nikon Elements software. For each image point, z-series optical sections were collected with a step size of 0.5 μm, using a Prior Proscan focus motor. Gamma, brightness, and contrast were adjusted on displayed images (identically for compared image sets) using FIJI software.
Western Blot Analysis.
Cells were lysed in radioimmunoprecipitation assay (RIPA) buffer, RIPA with 8 M urea, or 1% Triton lysis buffer (for Triton soluble experiments) and resolved on SDS/PAGE and transferred to a nitrocellulose membrane following standard protocols. For differential solubility experiments, cell were sequentially centrifuged, and supernatants were removed and pellets resuspended in harsher buffer conditions. Protein concentration was measures using the BCA reagent (Thermo Fisher). The following antibodies were used: RIPK1 (BD, Cell Signaling, and custom-made), β-actin (Santa Cruz), RIP3 (Serotec, Cell Signaling), and p-S166-RIPK1 (Cell Signaling). The blots were quantified using FIJI software. Each total protein was normalized to a housekeeping protein such as actin or tubulin; phosphorylated proteins were normalized to the total proteins. Subsequently, normalized band intensities were divided by the average of the control group to determine normalized fold change vs. the control group. In our experiments, this is represented as a decimal value.
Cell Culture.
BV2 cells were cultured in DMEM supplemented with 10% FBS and penicillin and streptomycin. Transfection of BV2 cells was done using a modified Lipofectamine 2000 protocol in which we reduced the concentration of Lipofectamine (∼75% of the recommended volume) and replaced the culture medium after 6 h of transfection. Primary microglia were isolated from mice forebrains as described previously (64). Briefly, postnatal day one to two, mouse brains were dissected, meninges were removed, and the tissue was digested with HBSS containing 0.025% trypsin for 10 min at 37 °C. The cells were then washed with DMEM containing 10% heat-inactivated FBS and 1% penicillin-streptomycin, mechanically dissociated by trituration, filtered through a sterile 70-μm filter, and then plated onto poly-d-lysine–coated 75-cm2 flasks. Microglia were isolated by shaking the mixed glia-containing flasks for 0.5 h at 200 rpm. Cells were cultured in 10% FBS and penicillin and streptomycin for 1 to 2 d.
Microglial Isolation for RNA Sequencing.
Mice were perfused with PBS, and brains were dissected and mechanically dissociated into single cells, filtered through a 70-μm strainer, and centrifuged on a 37%/70% isotonic percoll gradient for 20 min, as previously described (65). After myelin and debris were removed, most of the remaining volume (except the pellet) was used for FACS. CD11b+, CD45intermediate cells were sorted directly into Triazol for RNA extraction using the Qiagen micro RNA easy Kit. Cathepsin L activity was assessed using transfected BV2 and 293T cells according to the manufacturer’s instructions (Millipore).
Microglial Isolation for Flow Cytometry and qPCR.
Mice were killed, and the brains were removed. The cerebellum was discarded, and the rest of the brain was chopped with a razor blade, followed by being homogenized with a 19-gauge needle in Accutase (Sigma). After 10 min of digestion, the brains were homogenized twice with a 21-gauge needle. The suspension was filtered through a 40-μm cell strainer and centrifuged at 300 × g. The pellet was resuspended in PBS, and 25% BSA (IgG & Protease Free from Jackson ImmunoResearch) in PBS was added on top. This suspension was centrifuged for 10 min (room temperature) at 1,200 × g. A top layer of myelin and supernatant was removed. The pellet was resuspended in ACK Lysing Buffer (Thermo Fisher). After 5 min of lysis (room temperature), the cells were centrifuged for 5 min at 4 °C at 300 × g. The resulting pellet was stained with CD11b, CD45, and TREM2 antibodies for subsequent FACS sorting and qPCR.
RNA-seq.
We prepared RNA-seq libraries following a published Smart-seq2 protocol (66) with the following modifications. We used between 20 and 450 pg of total RNAs in place of single cell lysate. We performed 18 cycles of PCR for samples starting with less than 100 pg total RNA and 15 cycles for the others to amplify the cDNA. We used 1/4 volume of a standard NexteraXT (Illumina) reaction with 0.3 ng of amplified cDNA for each sample. We sequenced the pooled libraries on an Illumina NextSeq500 instrument with 50 bases for read1 and 25 bases read2. Reads were converted to fastq files and aligned with Bowtie to the mm10 University of California, Santa Cruz mouse transcriptome. Gene expression levels for each gene were calculated using RSEM.
Supplementary Material
Acknowledgments
We thank Dr. Collin Watts (University of Dundee) for the anti-mouse Cst7 Ab. We thank Gary Kasof (Cell Signaling) for developing the phospho-S166 RIPK1 antibody. We thank Dr. Manolis Pasparakis (University of Cologne) for Ripk1D138N mice. We thank Dr. Barbara Caldarone (NeuroBehavior Laboratory, Harvard Institute of Medicine) for conducting mouse behavior analysis. We thank Dr. Jennifer Walters and staff (Harvard Medical School Nikon microscope facility) for help with fluorescence microscopy. We thank Dr. Matthew Frosch (Harvard Neuropathology Services) for providing human brain pathological samples. We acknowledge the support of an Aging and Disability Resource Center grant. This work was supported by National Institute of Neurological Disorders and Stroke Grant 1R01NS082257 and NIH Grant 1R01AG047231 (to J.Y.). D.O. was supported by a postdoctoral fellowship from the National Multiple Sclerosis Society and a National MS Society Career Transition Award. Y.I. was supported in part by postdoctoral fellowships from the Daiichi Sankyo Foundation of Life Science, the Nakatomi Foundation, the Mochida Memorial Foundation for Medical and Pharmaceutical Research, and the Japan Society for the Promotion of Science. H.C. was supported by a scientific research training grant from Huazhong University of Science and Technology.
Footnotes
Conflict of interest statement: Denali Therapeutics has licensed the Necrostatin program (including Nec-1s) from Harvard Medical School. J.Y. is a consultant of Denali Therapeutics.
See Commentary on page 10813.
This article contains supporting information online at www.pnas.org/lookup/suppl/doi:10.1073/pnas.1714175114/-/DCSupplemental.
References
- 1.Mandrekar-Colucci S, Landreth GE. Microglia and inflammation in Alzheimer’s disease. CNS Neurol Disord Drug Targets. 2010;9:156–167. doi: 10.2174/187152710791012071. [DOI] [PMC free article] [PubMed] [Google Scholar]
- 2.Karch CM, Goate AM. Alzheimer’s disease risk genes and mechanisms of disease pathogenesis. Biol Psychiatry. 2015;77:43–51. doi: 10.1016/j.biopsych.2014.05.006. [DOI] [PMC free article] [PubMed] [Google Scholar]
- 3.Abduljaleel Z, et al. Evidence of trem2 variant associated with triple risk of Alzheimer’s disease. PLoS One. 2014;9:e92648. doi: 10.1371/journal.pone.0092648. [DOI] [PMC free article] [PubMed] [Google Scholar]
- 4.Hollingworth P, et al. Alzheimer’s Disease Neuroimaging Initiative. CHARGE consortium. EADI1 consortium Common variants at ABCA7, MS4A6A/MS4A4E, EPHA1, CD33 and CD2AP are associated with Alzheimer’s disease. Nat Genet. 2011;43:429–435. doi: 10.1038/ng.803. [DOI] [PMC free article] [PubMed] [Google Scholar]
- 5.Jonsson T, et al. Variant of TREM2 associated with the risk of Alzheimer’s disease. N Engl J Med. 2013;368:107–116. doi: 10.1056/NEJMoa1211103. [DOI] [PMC free article] [PubMed] [Google Scholar]
- 6.Lambert JC, et al. European Alzheimer’s Disease Initiative (EADI) Genetic and Environmental Risk in Alzheimer’s Disease. Alzheimer’s Disease Genetic Consortium. Cohorts for Heart and Aging Research in Genomic Epidemiology Meta-analysis of 74,046 individuals identifies 11 new susceptibility loci for Alzheimer’s disease. Nat Genet. 2013;45:1452–1458. doi: 10.1038/ng.2802. [DOI] [PMC free article] [PubMed] [Google Scholar]
- 7.Wollmer MA. Cholesterol-related genes in Alzheimer’s disease. Biochim Biophys Acta. 2010;1801:762–773. doi: 10.1016/j.bbalip.2010.05.009. [DOI] [PubMed] [Google Scholar]
- 8.Tarkowski E, Andreasen N, Tarkowski A, Blennow K. Intrathecal inflammation precedes development of Alzheimer’s disease. J Neurol Neurosurg Psychiatry. 2003;74:1200–1205. doi: 10.1136/jnnp.74.9.1200. [DOI] [PMC free article] [PubMed] [Google Scholar]
- 9.Weitz TM, Town T. Microglia in Alzheimer’s disease: It’s all about context. Int J Alzheimers Dis. 2012;2012:314185. doi: 10.1155/2012/314185. [DOI] [PMC free article] [PubMed] [Google Scholar]
- 10.Lee CY, Landreth GE. The role of microglia in amyloid clearance from the AD brain. J Neural Transm (Vienna) 2010;117:949–960. doi: 10.1007/s00702-010-0433-4. [DOI] [PMC free article] [PubMed] [Google Scholar]
- 11.Cho MH, et al. Autophagy in microglia degrades extracellular β-amyloid fibrils and regulates the NLRP3 inflammasome. Autophagy. 2014;10:1761–1775. doi: 10.4161/auto.29647. [DOI] [PMC free article] [PubMed] [Google Scholar]
- 12.Keren-Shaul H, et al. A unique microglia type associated with restricting development of Alzheimer’s disease. Cell. 2017;169:1276–1290.e17. doi: 10.1016/j.cell.2017.05.018. [DOI] [PubMed] [Google Scholar]
- 13.Hamilton G, Colbert JD, Schuettelkopf AW, Watts C. Cystatin F is a cathepsin C-directed protease inhibitor regulated by proteolysis. EMBO J. 2008;27:499–508. doi: 10.1038/sj.emboj.7601979. [DOI] [PMC free article] [PubMed] [Google Scholar]
- 14.Ofengeim D, Yuan J. Regulation of RIP1 kinase signalling at the crossroads of inflammation and cell death. Nat Rev Mol Cell Biol. 2013;14:727–736. doi: 10.1038/nrm3683. [DOI] [PubMed] [Google Scholar]
- 15.Polykratis A, et al. Cutting edge: RIPK1 kinase inactive mice are viable and protected from TNF-induced necroptosis in vivo. J Immunol. 2014;193:1539–1543. doi: 10.4049/jimmunol.1400590. [DOI] [PMC free article] [PubMed] [Google Scholar]
- 16.Shutinoski B, et al. K45A mutation of RIPK1 results in poor necroptosis and cytokine signaling in macrophages, which impacts inflammatory responses in vivo. Cell Death Differ. 2016;23:1628–1637. doi: 10.1038/cdd.2016.51. [DOI] [PMC free article] [PubMed] [Google Scholar]
- 17.Teng X, et al. Structure-activity relationship study of novel necroptosis inhibitors. Bioorg Med Chem Lett. 2005;15:5039–5044. doi: 10.1016/j.bmcl.2005.07.077. [DOI] [PubMed] [Google Scholar]
- 18.Degterev A, et al. Chemical inhibitor of nonapoptotic cell death with therapeutic potential for ischemic brain injury. Nat Chem Biol. 2005;1:112–119. doi: 10.1038/nchembio711. [DOI] [PubMed] [Google Scholar]
- 19.Degterev A, et al. Identification of RIP1 kinase as a specific cellular target of necrostatins. Nat Chem Biol. 2008;4:313–321. doi: 10.1038/nchembio.83. [DOI] [PMC free article] [PubMed] [Google Scholar]
- 20.Christofferson DE, et al. A novel role for RIP1 kinase in mediating TNFα production. Cell Death Dis. 2012;3:e320. doi: 10.1038/cddis.2012.64. [DOI] [PMC free article] [PubMed] [Google Scholar]
- 21.Ito Y, et al. RIPK1 mediates axonal degeneration by promoting inflammation and necroptosis in ALS. Science. 2016;353:603–608. doi: 10.1126/science.aaf6803. [DOI] [PMC free article] [PubMed] [Google Scholar]
- 22.Ofengeim D, et al. Activation of necroptosis in multiple sclerosis. Cell Rep. 2015;10:1836–1849. doi: 10.1016/j.celrep.2015.02.051. [DOI] [PMC free article] [PubMed] [Google Scholar]
- 23.Kondylis V, Kumari S, Vlantis K, Pasparakis M. The interplay of IKK, NF-κB and RIPK1 signaling in the regulation of cell death, tissue homeostasis and inflammation. Immunol Rev. 2017;277:113–127. doi: 10.1111/imr.12550. [DOI] [PubMed] [Google Scholar]
- 24.Zhou W, Yuan J. Necroptosis in health and diseases. Semin Cell Dev Biol. 2014;35:14–23. doi: 10.1016/j.semcdb.2014.07.013. [DOI] [PubMed] [Google Scholar]
- 25.Magister S, Kos J. Cystatins in immune system. J Cancer. 2013;4:45–56. doi: 10.7150/jca.5044. [DOI] [PMC free article] [PubMed] [Google Scholar]
- 26.Berger SB, et al. Cutting edge: RIP1 kinase activity is dispensable for normal development but is a key regulator of inflammation in SHARPIN-deficient mice. J Immunol. 2014;192:5476–5480. doi: 10.4049/jimmunol.1400499. [DOI] [PMC free article] [PubMed] [Google Scholar]
- 27.Tarkowski E, Blennow K, Wallin A, Tarkowski A. Intracerebral production of tumor necrosis factor-alpha, a local neuroprotective agent, in Alzheimer disease and vascular dementia. J Clin Immunol. 1999;19:223–230. doi: 10.1023/a:1020568013953. [DOI] [PubMed] [Google Scholar]
- 28.Fillit H, et al. Elevated circulating tumor necrosis factor levels in Alzheimer’s disease. Neurosci Lett. 1991;129:318–320. doi: 10.1016/0304-3940(91)90490-k. [DOI] [PubMed] [Google Scholar]
- 29.Frost JL, et al. An anti-pyroglutamate-3 Aβ vaccine reduces plaques and improves cognition in APPswe/PS1ΔE9 mice. Neurobiol Aging. 2015;36:3187–3199. doi: 10.1016/j.neurobiolaging.2015.08.021. [DOI] [PMC free article] [PubMed] [Google Scholar]
- 30.Audrain M, et al. Alzheimer’s disease-like APP processing in wild-type mice identifies synaptic defects as initial steps of disease progression. Mol Neurodegener. 2016;11:5. doi: 10.1186/s13024-016-0070-y. [DOI] [PMC free article] [PubMed] [Google Scholar]
- 31.Xiong H, et al. Biochemical and behavioral characterization of the double transgenic mouse model (APPswe/PS1dE9) of Alzheimer’s disease. Neurosci Bull. 2011;27:221–232. doi: 10.1007/s12264-011-1015-7. [DOI] [PMC free article] [PubMed] [Google Scholar]
- 32.Troy CM, et al. Caspase-2 mediates neuronal cell death induced by beta-amyloid. J Neurosci. 2000;20:1386–1392. doi: 10.1523/JNEUROSCI.20-04-01386.2000. [DOI] [PMC free article] [PubMed] [Google Scholar]
- 33.Nakagawa T, et al. Caspase-12 mediates endoplasmic-reticulum-specific apoptosis and cytotoxicity by amyloid-beta. Nature. 2000;403:98–103. doi: 10.1038/47513. [DOI] [PubMed] [Google Scholar]
- 34.Baron R, Babcock AA, Nemirovsky A, Finsen B, Monsonego A. Accelerated microglial pathology is associated with Aβ plaques in mouse models of Alzheimer’s disease. Aging Cell. 2014;13:584–595. doi: 10.1111/acel.12210. [DOI] [PMC free article] [PubMed] [Google Scholar]
- 35.Saito T, et al. Single App knock-in mouse models of Alzheimer’s disease. Nat Neurosci. 2014;17:661–663. doi: 10.1038/nn.3697. [DOI] [PubMed] [Google Scholar]
- 36.Riederer BM, Leuba G, Vernay A, Riederer IM. The role of the ubiquitin proteasome system in Alzheimer’s disease. Exp Biol Med (Maywood) 2011;236:268–276. doi: 10.1258/ebm.2010.010327. [DOI] [PubMed] [Google Scholar]
- 37.Subramanian A, et al. Gene set enrichment analysis: A knowledge-based approach for interpreting genome-wide expression profiles. Proc Natl Acad Sci USA. 2005;102:15545–15550. doi: 10.1073/pnas.0506580102. [DOI] [PMC free article] [PubMed] [Google Scholar]
- 38.Papassotiropoulos A, et al. Cholesterol 25-hydroxylase on chromosome 10q is a susceptibility gene for sporadic Alzheimer’s disease. Neurodegener Dis. 2005;2:233–241. doi: 10.1159/000090362. [DOI] [PubMed] [Google Scholar]
- 39.Chiu IM, et al. A neurodegeneration-specific gene-expression signature of acutely isolated microglia from an amyotrophic lateral sclerosis mouse model. Cell Rep. 2013;4:385–401. doi: 10.1016/j.celrep.2013.06.018. [DOI] [PMC free article] [PubMed] [Google Scholar]
- 40.Ma J, et al. Microglial cystatin F expression is a sensitive indicator for ongoing demyelination with concurrent remyelination. J Neurosci Res. 2011;89:639–649. doi: 10.1002/jnr.22567. [DOI] [PubMed] [Google Scholar]
- 41.Nuvolone M, et al. Cystatin F is a biomarker of prion pathogenesis in mice. PLoS One. 2017;12:e0171923. doi: 10.1371/journal.pone.0171923. [DOI] [PMC free article] [PubMed] [Google Scholar]
- 42.Colbert JD, Plechanovová A, Watts C. Glycosylation directs targeting and activation of cystatin f from intracellular and extracellular sources. Traffic. 2009;10:425–437. doi: 10.1111/j.1600-0854.2009.00881.x. [DOI] [PMC free article] [PubMed] [Google Scholar]
- 43.Itagaki S, McGeer PL, Akiyama H, Zhu S, Selkoe D. Relationship of microglia and astrocytes to amyloid deposits of Alzheimer disease. J Neuroimmunol. 1989;24:173–182. doi: 10.1016/0165-5728(89)90115-x. [DOI] [PubMed] [Google Scholar]
- 44.Mrak RE. Microglia in Alzheimer brain: A neuropathological perspective. Int J Alzheimers Dis. 2012;2012:165021. doi: 10.1155/2012/165021. [DOI] [PMC free article] [PubMed] [Google Scholar]
- 45.Sedgwick JD, et al. Isolation and direct characterization of resident microglial cells from the normal and inflamed central nervous system. Proc Natl Acad Sci USA. 1991;88:7438–7442. doi: 10.1073/pnas.88.16.7438. [DOI] [PMC free article] [PubMed] [Google Scholar]
- 46.Jay TR, et al. TREM2 deficiency eliminates TREM2+ inflammatory macrophages and ameliorates pathology in Alzheimer’s disease mouse models. J Exp Med. 2015;212:287–295. doi: 10.1084/jem.20142322. [DOI] [PMC free article] [PubMed] [Google Scholar]
- 47.François A, et al. Involvement of interleukin-1β in the autophagic process of microglia: Relevance to Alzheimer’s disease. J Neuroinflammation. 2013;10:151. doi: 10.1186/1742-2094-10-151. [DOI] [PMC free article] [PubMed] [Google Scholar]
- 48.Yang CN, et al. Mechanism mediating oligomeric Aβ clearance by naïve primary microglia. Neurobiol Dis. 2011;42:221–230. doi: 10.1016/j.nbd.2011.01.005. [DOI] [PubMed] [Google Scholar]
- 49.Malm TM, Jay TR, Landreth GE. The evolving biology of microglia in Alzheimer’s disease. Neurotherapeutics. 2015;12:81–93. doi: 10.1007/s13311-014-0316-8. [DOI] [PMC free article] [PubMed] [Google Scholar]
- 50.Tanzi RE, Bertram L. Twenty years of the Alzheimer’s disease amyloid hypothesis: A genetic perspective. Cell. 2005;120:545–555. doi: 10.1016/j.cell.2005.02.008. [DOI] [PubMed] [Google Scholar]
- 51.van Leeuwen FW, et al. Frameshift mutants of beta amyloid precursor protein and ubiquitin-B in Alzheimer’s and Down patients. Science. 1998;279:242–247. doi: 10.1126/science.279.5348.242. [DOI] [PubMed] [Google Scholar]
- 52.McBrayer M, Nixon RA. Lysosome and calcium dysregulation in Alzheimer’s disease: Partners in crime. Biochem Soc Trans. 2013;41:1495–1502. doi: 10.1042/BST20130201. [DOI] [PMC free article] [PubMed] [Google Scholar]
- 53.Perry VH, Nicoll JA, Holmes C. Microglia in neurodegenerative disease. Nat Rev Neurol. 2010;6:193–201. doi: 10.1038/nrneurol.2010.17. [DOI] [PubMed] [Google Scholar]
- 54.Newton K, et al. Activity of protein kinase RIPK3 determines whether cells die by necroptosis or apoptosis. Science. 2014;343:1357–1360. doi: 10.1126/science.1249361. [DOI] [PubMed] [Google Scholar]
- 55.Brown MS, Goldstein JL. The SREBP pathway: Regulation of cholesterol metabolism by proteolysis of a membrane-bound transcription factor. Cell. 1997;89:331–340. doi: 10.1016/s0092-8674(00)80213-5. [DOI] [PubMed] [Google Scholar]
- 56.Malaspina A, Kaushik N, de Belleroche J. Differential expression of 14 genes in amyotrophic lateral sclerosis spinal cord detected using gridded cDNA arrays. J Neurochem. 2001;77:132–145. doi: 10.1046/j.1471-4159.2001.t01-1-00231.x. [DOI] [PubMed] [Google Scholar]
- 57.Wanke F, et al. EBI2 is highly expressed in multiple sclerosis lesions and promotes early CNS migration of encephalitogenic CD4 T cells. Cell Rep. 2017;18:1270–1284. doi: 10.1016/j.celrep.2017.01.020. [DOI] [PubMed] [Google Scholar]
- 58.Gold ES, et al. 25-hydroxycholesterol acts as an amplifier of inflammatory signaling. Proc Natl Acad Sci USA. 2014;111:10666–10671. doi: 10.1073/pnas.1404271111. [DOI] [PMC free article] [PubMed] [Google Scholar]
- 59.Lathe R, Sapronova A, Kotelevtsev Y. Atherosclerosis and Alzheimer–Diseases with a common cause? Inflammation, oxysterols, vasculature. BMC Geriatr. 2014;14:36. doi: 10.1186/1471-2318-14-36. [DOI] [PMC free article] [PubMed] [Google Scholar]
- 60.Karunakaran D, et al. Targeting macrophage necroptosis for therapeutic and diagnostic interventions in atherosclerosis. Sci Adv. 2016;2:e1600224. doi: 10.1126/sciadv.1600224. [DOI] [PMC free article] [PubMed] [Google Scholar]
- 61.Magister S, et al. Regulation of cathepsins S and L by cystatin F during maturation of dendritic cells. Eur J Cell Biol. 2012;91:391–401. doi: 10.1016/j.ejcb.2012.01.001. [DOI] [PubMed] [Google Scholar]
- 62.Maher K, Konjar S, Watts C, Turk B, Kopitar-Jerala N. Cystatin F regulates proteinase activity in IL-2-activated natural killer cells. Protein Pept Lett. 2014;21:957–965. doi: 10.2174/0929866521666140403124146. [DOI] [PubMed] [Google Scholar]
- 63.Yang DS, et al. Therapeutic effects of remediating autophagy failure in a mouse model of Alzheimer disease by enhancing lysosomal proteolysis. Autophagy. 2011;7:788–789. doi: 10.4161/auto.7.7.15596. [DOI] [PMC free article] [PubMed] [Google Scholar]
- 64.Orre M, et al. Isolation of glia from Alzheimer’s mice reveals inflammation and dysfunction. Neurobiol Aging. 2014;35:2746–2760. doi: 10.1016/j.neurobiolaging.2014.06.004. [DOI] [PubMed] [Google Scholar]
- 65.Wang Y, et al. TREM2 lipid sensing sustains the microglial response in an Alzheimer’s disease model. Cell. 2015;160:1061–1071. doi: 10.1016/j.cell.2015.01.049. [DOI] [PMC free article] [PubMed] [Google Scholar]
- 66.Holtman IR, et al. Induction of a common microglia gene expression signature by aging and neurodegenerative conditions: A co-expression meta-analysis. Acta Neuropathol Commun. 2015;3:31. doi: 10.1186/s40478-015-0203-5. [DOI] [PMC free article] [PubMed] [Google Scholar]
- 67.Hickman SE, et al. The microglial sensome revealed by direct RNA sequencing. Nat Neurosci. 2013;16:1896–1905. doi: 10.1038/nn.3554. [DOI] [PMC free article] [PubMed] [Google Scholar]
Associated Data
This section collects any data citations, data availability statements, or supplementary materials included in this article.