Abstract
Multiwalled carbon nanotubes (CNTs) were carboxylated via microwave irradiation where the treatment time was varied to alter the degree of functionalization, and as many as one in 15 carbons in the CNT could be oxidized. Chemical, physical, electrochemical, and colloidal behavior of the carboxylated CNTs was studied. All properties changed with the degree of functionalization to a point beyond which they appeared to remain constant. The surface area increased from 173.9 to 270.9 m2/g while the critical coagulation concentration (CCC) values increased from 142.14 to 168.69 mM in the presence of NaCl, and the corresponding increase was from 0.97 to 5.32 mM in the presence of MgCl2. As seen from cyclic voltammetry curves, the functionalized CNTs showed mainly non-Faradic interactions with Na2SO4, but showed Faradic behaviors in alkaline KOH.
Keywords: Carbon nanotubes, Degree of functionalization, Colloidal stability, Electrochemical property
Introduction
Carbon nanotubes (CNTs) have found diverse applications due to their extraordinary physical and chemical properties (Iijima 1991, Nair et al. 2012). The sidewalls of CNTs are mostly defect-free and therefore inert to chemical attack. CNTs are also insoluble in water and other solvents, and functionalization is used to render them dispersible or soluble (Huang et al. 2002, Sun et al. 2002, Aitchison et al. 2007).
The most common approaches to CNT functionalization include covalent attachment of functional groups and noncovalent interactions with polymers including DNA (Lin et al. 2002). Introducing carboxylic groups on CNTs is usually the first step in covalent functionalization which also renders the CNTs dispersible in water (Goyanes et al. 2007, Salzmann et al. 2007, Chen and Mitra 2008). Carboxylated CNTs then can be further functionalized to amine, ester, amide, polymeric, or other groups (Lin et al. 2002, Coleman et al. 2003, Goyanes et al. 2007, Rogel-Hernández et al. 2011). Carboxylated CNTs are usually prepared by refluxing, sonication, or microwave treatment with strong acids (Huang et al. 2002, Sun et al., 2002, Chen and Mitra 2008). Other methods such as ozonation, hydrogen peroxide, and ammonium hydroxide have also been used (Datsyuk et al. 2008, Naeimi et al. 2009, Martín et al. 2013, Morales-Lara et al. 2013). The strength of the reagents, the treatment time and reaction temperature determines the degree of functionalization in terms of the number of carboxylated groups generated on the CNT structure. While most of the oxidation methods are effective, microwave irradiation has been reported to be faster than conventional methods such as refluxing (Perreux and Loupy 2001, Chen and Mitra 2008). Since it is an intense short-term treatment, it is estimated that the degree of functionalization can be controlled by relatively smaller variations in treatment time.
While there has been much work on functionalization of CNTs, there is very little understanding of the degree of functionalization in terms of the ratio of carbon atoms to the functional groups attached to the tube structure. Also basic questions such as what level of functionalization is possible are yet to be addressed in the literature. Since carboxylated CNTs are the starting material for a variety of other functionalization, this degree will affect the loading of these materials that include metals, polymers, and drugs, which will also affect the performance of the functionalized analog. The degree of carboxylation will also alter fundamental physical and chemical properties such a dispersibility, reactivity, and electrochemical behaviors. These are yet to be studied systematically to understand what kinds of variations are expected when the level of carboxylation is altered. The objective of this study is to systematically investigate how the degree of carboxylation affects physical, chemical, colloidal, as well as electrochemical properties of CNTs.
Experimental
Preparation of the f-CNTs
Multiwalled carbon nanotubes (CNTs) (OD 20–30 nm, length 10–30 μm, purity >95%) were purchased from Cheap Tubes Inc., and all other chemicals were purchased from Sigma-Aldrich with purity higher than 95%. The synthesis of the functionalized CNTs (referred to as f-CNTs) was carried out in a microwave accelerated reaction system (Chen and Mitra 2008). Pre-weighed amounts of CNTs with a mixture of concentrated H2SO4 and HNO3 were added to reaction chambers. In order to create oxygen-containing functional groups effectively, concentrated acids, high temperatures, and long reaction times are used to enhance functionalization. In this study, we used concentrated acids without dilution, and the reaction time was varied to alter the degree of functionalization. The reaction vessels were subject to microwave radiation at a preset temperature of 140 °C. The time of treatment was varied from 5 to 120 min. After cooling to room temperature, the products were vacuum filtered using Milli-Q water with 10 μm filter papers until the filtration reached a neutral pH. The f-CNTs were then dried in a vacuum oven at 70 °C until constant weight.
Characterizations and electrochemical behavior of the f-CNTs
Scanning electron microscope (SEM) images and elemental analysis data for samples were collected on an LEO 1530 VP scanning electron microscope equipped with an energy-dispersive X-ray analyzer. Around 40 nanotubes from each sample were measured independently to obtain the diameter distribution by SEM. TEM measurements were carried out using Hitachi H-7500 instrument by dispersing the samples in Milli-Q water and adding to 200-mesh TEM grids prior to drying. The specific surface areas (SSA) of the samples were measured using a QuantaChrome NOVA 3000 series (Model N32–11) High Speed Gas Sorption Analyzer at 77.40 K. The samples were heated and degassed at 300 °C in a vacuum oven for 3 h before the measurements. Defects in the CNT structure were studied by Raman spectroscopy with a DXR Raman instrument.
Electrochemical behavior of different CNT samples were measured by cyclic voltammetry using an electrochemical analyzer (Model: 320C, Homiangz LLC) at a scan rate of 0.01 V/s in 2 M Na2SO4 and 0.05 V/s in 2 M KOH where the working electrode (3 mg) comprised of 15% polyvinylidene fluoride (PVDF), 10% carbon black, and 75% CNTs.
Dispersibility studies
Fifty milligram per liter stock solutions of f-CNTs were prepared by sonicating pre-weighted amounts f-CNTs in Milli-Q water. Four hundred millimolar stock solutions of sodium chloride and magnesium chloride were prepared by dissolving pre-weighted amounts of salts in Milli-Q water. Different concentrations of f-CNTs and salt solutions were prepared by diluting the stock solutions.
Particle sizes of 1 mg/l f-CNTs dispersions and zeta potential of 5 mg/ f-CNTs dispersions were measured in Milli-Q water and in the presence of 10 mM salt. Particle size and zeta potential were measured at 25 °C using a Malvern instrument (Zetasizer Nano ZS90) at a 90° scatter angle. The aggregation distributions were measured using 1 mg/l f-CNTs dispersion in the presence of salt solutions where the concentration ranged from 0.5 to 300 mM, and the measurement period was between 160 s to 1.5 h.
Results and discussion
Characterizations
The elemental analysis of CNTs and f-CNTs were measured by EDX and the data is presented in Table 1. The oxygen content increased with the treatment time from 5 to 40 min but did not change significantly beyond that. Raw CNTs also had residual Ni catalysts, which decreased from raw CNTs to the functionalized CNTs for treatment times of 5 and 10 min and there was no Ni detected beyond 20 min. Assuming all oxygen in f-CNTs were from the COOH groups, the ratio between carbon atom and carboxyl group (C: COOH) was calculated based on EDX data. The ratio decreased from 34.8 to 16.2 with treatment time 5 to 40 min with relatively less significant change (up to 14.7) beyond that. The functionalized CNTs with different treatment times were referred as f-CNT34.8, f-CNT23.8, f-CNT20.6, f-CNT16.2, f-CNT15.7, f-CNT14.9, and f-CNT14.7 based on the C: COOH ratio. The specific surface area (SSA) of samples are shown in Table 1. This increased from 173.9 to 266 m2/g with treatment time from raw CNTs to 40 min. There was no further increase in SSA beyond 40 min.
Table 1. Diameter, elemental analysis, C: COOH ratio, SSA, ID/IG of CNTs and f-CNTs.
| Sample name | Treatment time (min) | Diameter (nm) | % by weight | C:COOH | SSA (m2/g) | ID/IG | ||
|---|---|---|---|---|---|---|---|---|
|
| ||||||||
| C | O | Ni | ||||||
| CNTs | 0 | 20 ± 5 | 93.5 | 4.90 | 1.60 | N/A | 173.9 | 0.89 |
| f-CNT34.8 | 5 | 23 ± 4 | 91.9 | 6.84 | 1.26 | 34.8 | 220.3 | 1.10 |
| f-CNT23.8 | 10 | 33 ± 7 | 89.9 | 9.65 | 0.45 | 23.8 | 246.8 | 1.29 |
| f-CNT20.6 | 20 | 36 ± 8 | 89.0 | 11.0 | – | 20.6 | 245.7 | 1.36 |
| f-CNT16.2 | 40 | 38 ± 9 | 86.6 | 13.4 | – | 16.2 | 266.0 | 1.61 |
| f-CNT15.7 | 60 | 38 ± 9 | 86.2 | 13.8 | – | 15.7 | 263.2 | 1.60 |
| f-CNT14.9 | 90 | 38 ± 8 | 85.6 | 14.4 | – | 14.9 | 250.6 | 1.62 |
| f-CNT14.7 | 120 | 38 ± 9 | 85.5 | 14.5 | – | 14.7 | 270.9 | 1.59 |
N/A not available
The intensity ratio of the D (defect band) and G band (graphite band) from Raman spectroscopy increased from raw CNT to f-CNT16.2. The higher ID/IG ratio typically implies higher levels of defects associated with functionalization. It is evident that the degree of functionalization based on ID/IG ratio did not change much beyond 40 min. Based on all these results, 40 min appears to be the treatment time where the degree of functionalization reached its maximum.
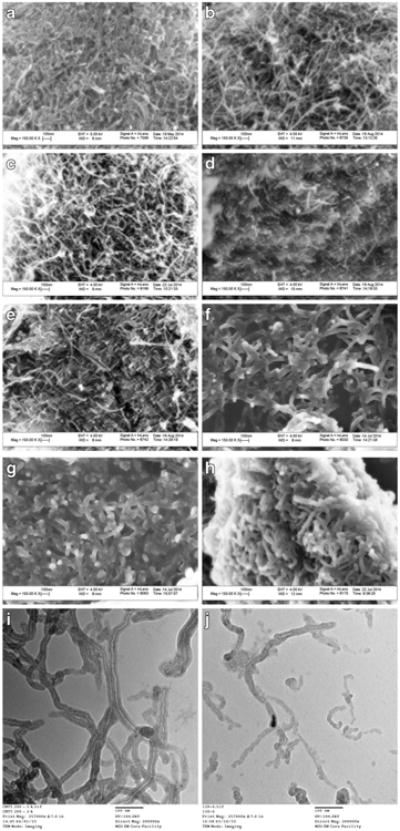
The morphologies of f-CNTs are shown in SEM and TEM images (Fig. 1). The diameters of carbon nano-tubes are presented in Table 1. It has been reported that the diameter of CNTs increase on functionalization (Wu and Mitra 2014), and that is what was observed here. Based on the Student's t test, there were significant differences between raw CNT and f-CNT34.8, f-CNT23.8, and f-CNT20.6. However, there was no significant change in diameters from f-CNT20.6 to f-CNT14.7. The TEM images of the CNT34.8 and CNT14.7 are shown in Fig. 1, the latter showed many smaller fragments, which implied that some tubes may have been shortened when treated for long periods. It could be seen that when the CNTs were treated for longer periods, CNTs dispersed better and tended to aggregate less in water.
Fig. 1. SEM images of a CNTs, b f-CNT34.8, c f-CNT23.8, d f-CNT20.6, e f-CNT16.2, f f-CNT15.7, g f-CNT14.9, h f-CNT14.7; TEM images of i f-CNT34.8 and j f-CNT14.7.
Electrochemical behavior of the f-CNTs
The electrochemical properties of the different functionalized CNTs were compared with two different electrolytes. The first was 2 M Na2SO4 where a double layer formation was anticipated, and the second was 2 M KOH which was expected to exhibit Faradic interactions with the electrode. Figure 2a shows the cyclic voltammetry of the different f-CNTs at the scan rate of 0.01 V/s in 2 M Na2SO4 electrolyte. The CNT and the f-CNTs showed similar voltammograms. During a CV scan, a voltage was applied to the electrode which generated a double layer of polarized ions where electric charge was stored. The larger the layer, the charge stored increased. The defects created by carboxylation were expected to enhance the formation of electric double layer at the CNT surface. It can be seen that as the treatment time increased from 5 to 40 min, the electrodes showed larger anodic as well as cathodic current. Once again, the current reached the maximum around 40 min of treatment. As the surface area and the number of carboxylated sites increased (Table 1), the ions had more active sites at the CNT-electrolyte interface, forming larger layers/Helmholtz planes and storing more charges. At higher treatment time the current appeared to drop. This was attributed to somewhat higher resistance as the tubes were damaged and shortened. One thing should be noted that the performance of raw CNTs was better than lightly treated CNTs (f-CNT34.8, f-CNT23.8, f-CNT20.6). The areas encircled by the CV curves were also calculated and shown in Table 2. For the treated CNTs, current/area increased until CNT16.2, after which there was no increasing trend.
Fig. 2. The cyclic voltammetry of different CNT samples a at the scan rate of 0.01 V/s in 2 M Na2SO4 electrolyte, b at the scan rate of 0.05 V/s in 2 M KOH electrolyte and c at the scan rate of 0.05 V/s in 2 M KOH and Na2SO4 electrolyte.
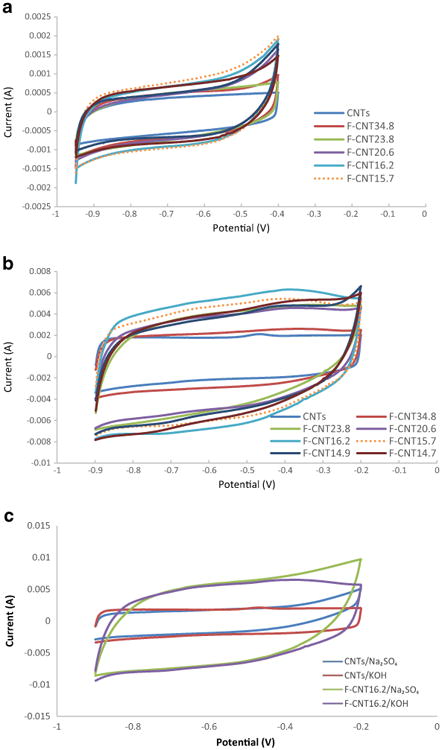
Table 2. The areas encircled by the CV curves.
| CNTs | f-CNT34.8 | f-CNT23.8 | f-CNT20.6 | f-CNT16.2 | f-CNT15.7 | f-CNT14.9 | f-CNT14.7 | |
|---|---|---|---|---|---|---|---|---|
| Area in Na2SO4 electrolyte | 4.64E-4 | 5.82E-4 | 5.99E-4 | 6.07E-4 | 7.91E-4 | 8.74E-4 | 5.95E-4 | 7.24E-4 |
| Area in KOH electrolyte | 2.77E-3 | 3.35E-3 | 5.31E-3 | 5.42E-3 | 7.35E-3 | 6.60E-3 | 5.57E-3 | 6.06E-3 |
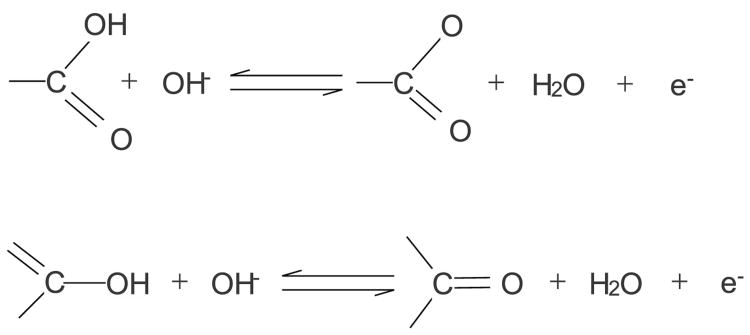
Figure 2b shows the cyclic voltammetry in 2 M KOH. The difference between the raw CNTs and the f-CNTs was more pronounced. The CNTs showed a flat profile, and f-CNT34.8 was similar to the raw CNTs. The difference around −0.8 V was attributed to the reversible faradaic redox reactions on CNT surface probably caused by the metal oxide impurities in raw CNTs. This bulge shape disappeared as functionalization removed those metal/metal oxides. The peak emerged at −0.5 V also vanished in the case of f-CNTs indicating that metal/metal oxide which might cause the peak was removed. f-CNT34.8 onward the shape change was quite dramatic till CNT16.2 whose peak currents reached 6 mA. This was attributed to both the non-Faradic and Faradic effects. Due to difference in electrolytes, electrochemical process could be different. For the f-CNTs, another bulge appeared around −0.38 V, which was enhanced as the treatment time increased. This was attributed to the redox interactions of oxygen-containing groups(Frackowiak et al. 2000). It has been known that the treatment would generate oxygen-containing groups, especially carboxylic groups which interact with the alkaline electrolyte via the following process(Oh et al. 2014) (Scheme 1).
Scheme 1. Redox behavior of oxygen-containing groups on f-CNTs.
The above interaction was insignificant or even might not happen in neutral electrolyte since no peak/bulge shape was observed. Once again, high treatment times (longer than 1 h) did not show any improvement.
CNT sample behaviors in different electrolytes were compared in Fig. 2c. For raw CNTs, the CV curves showed similar shapes in both electrolytes except the rise at the positive voltage end in Na2SO4, which can be ascribed to water decomposition and gas evolution. The electrochemical interactions between the functionalized CNT samples and electrolytes were different in neutral and basic environment: the anodic bulge at 0.4 V did not show up in neutral Na2SO4 electrolyte.
For an electrode showing a capacitive behavior, specific capacitance (Csp) as a resultant capacitance can be obtained using the following equation and its CV curve. The integration part in the equation is the area encircled by the CV curve and the larger the area is, the more significant the capacitive behavior is.
The areas encircled by the CV curves were also calculated and shown in Table 2. For the treated CNTs, current/area increased until CNT16.2 and CNT15.7, after which there was no increasing trend, indicating that the interactions between CNT and electrolyte (Faradic caused by carboxylic functional groups and non-Faradic caused by electric double-layer) and capacitance behavior were enhanced until certain point of treatment.
Dispersibility of the f-CNTs
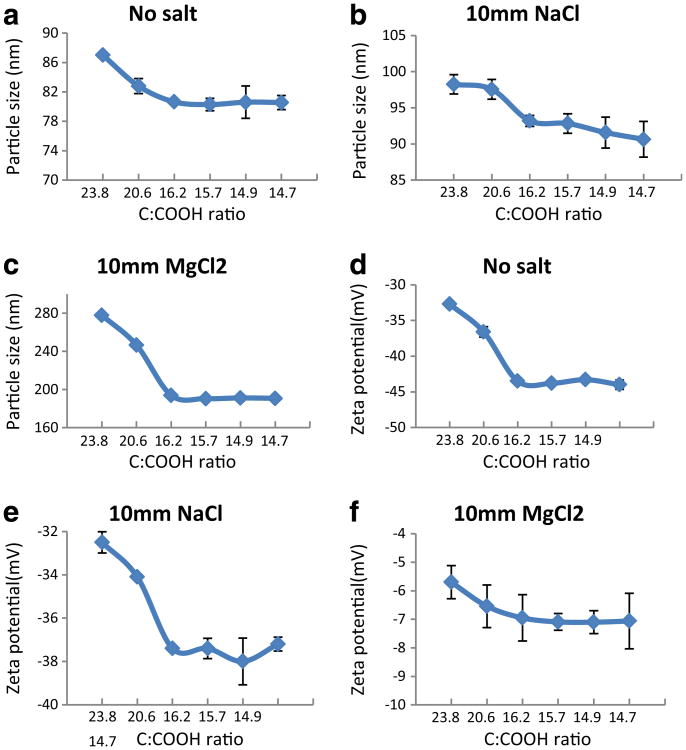
The particle size of and zeta potential the f-CNTs in Milli-Q water and in the presence of salts are presented in Fig. 3. The water dispersibility of carboxylated f-CNTs is due to the negatively charged oxygen-containing groups on the surface of the tubes. In the presence of salt solutions, positively charged metal ions compressed the double layer which led to the aggregation of the tubes. Since raw CNTs and CNT34.8 are not dispersible in water, dispersibility study has been done for f-CNTs with treatment time longer than 5 min. In all three media, the particle size decreased as the treatment time increased from 10 to 40 min, and did not change past 40 min. This implied that from 10 to 40 min, the degree functionalization increased, and 40 min is long enough to maximize the number of carboxylic groups on the surface.
Fig. 3. Particle size (a, b, c) and zeta potential (d, e, f) of f-CNTs in Milli-Q water and in the present of NaCl and MgCl2.
For all f-CNTs, the particle sizes in Milli-Q water were smaller than those in the presence of salt, and the sizes in MgCl2 were larger than those in NaCl. This observation is in line with Schulze–Hardy rule (Elimelech et al. 1998) which states that it is the valence of the counter ions that has the principal effect on the stability of the colloid. It was also observed that in the range of 10 to 40 min, the longer treatment time led to more negative zeta potential, beyond which it stayed unchanged. The divalent Mg salt led to a relatively larger value in the zeta potential for all the f-CNTs compared to the monovalent Na salt.
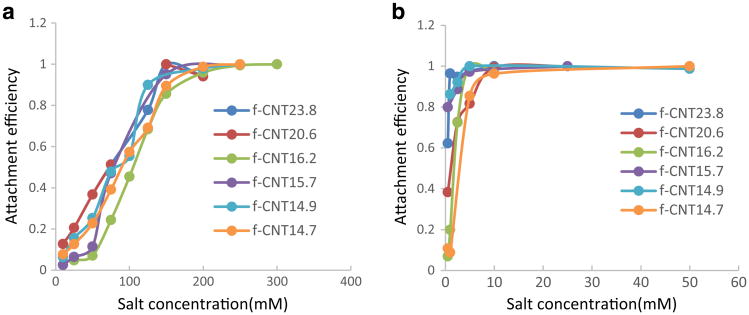
An increase in CNT aggregation with increasing salt concentration and counterion valence consistent with the DLVO theory and the Schulze-Hardy rule and has been reported previously (Elimelech et al. 1998, Ntim et al. 2012). Time-resolved dynamic light scattering (TRDLS) has been extensively used to determine the aggregation behavior of diverse nanoparticles in the presence of salts, organic matter, and biological materials (Ntim et al. 2012). TRDL was used to investigate the initial aggregation kinetics of f-CNT dispersions which was measured by monitoring the time-dependent increase in hydrodynamic radius (rh). The attachment efficiency (α), which is the inverse of the Fuchs stability ratio commonly used in colloidal stability studies was used to quantify the aggregation kinetics (Desai et al. 2014):
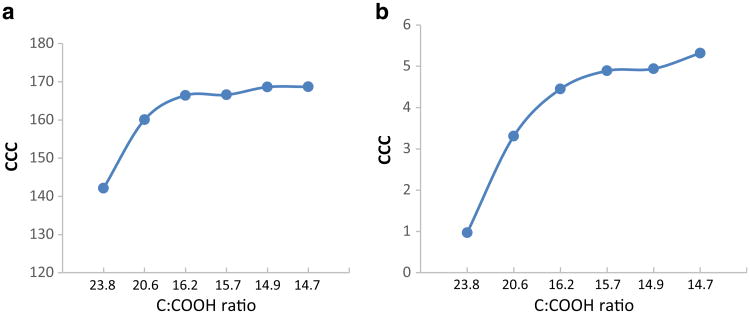
where and represented slow and fast aggregation regimes respectively. Figure 4a, b shows attachment efficiency for the f-CNTs in the presence of NaCl and MgCl2. In the presence of these electrolytes, the f-CNTs exhibited classical aggregation behavior (Saleh et al. 2008). At low ionic strengths, α increased with salt concentration and then reached a steady state. The critical coagulation concentration (CCC) is the point when α became independent of salt concentration. A higher CCC implied higher stability in presence of the salt. Figure 5 shows that the CCC value of the f-CNTs in the presence of salts. CCC increased with the increase of treatment time from 10 to 40 min. Beyond 40 min, there was only a slight change of CCC value. This again implied that the f-CNTs prepared under longer treatment time up to 40 min were more stable in the aqueous environment. All the f-CNTs had higher CCC values in NaCl than in MgCl2. From 10 to 120 min treatment, the CCC values increased from 142.14 to 168.69 mM with increase in treatment time in the presence of NaCl, and the corresponding increase was from 0.97 to 5.32 mM in the presence of MgCl2.
Fig. 4. Attachment efficiency of f-CNTs in a function of a NaCl and b MgCl2.
Fig. 5. CCC value of f-CNTs in the present of a NaCl and b MgCl2.
Conclusions
CNTs were systematically functionalized under different microwave treatment times to generate carboxylated CNTs with different levels of functionalization. Properties such as elemental composition, SSA and ID/IG ratio from Raman spectroscopy varied with the degree of functionalization. The highest attainable degree of functionalization corresponded to a C:COOH ratio of 14.7. Electrochemical performance of f-CNTs increased with treatment time from 5 to 40 min beyond which it stayed constant. Based on particle sizes, zeta potentials and CCC values in NaCl and MgCl2, the colloidal behaviors of f-CNTs under different condition were found to be significantly different. f-CNTs under longer treatment time (beyond 40 min) showed smaller particle sizes, more negative zeta potential values and higher CCC values. It implied that f-CNTs with higher degree of functionalization had higher colloidal stability. In general, 40 min was considered as the optimum treatment time, beyond which the improvement was less significant. In the aspect of electrochemical properties, the functionalized CNTs showed mainly non-Faradic interactions with Na2SO4, but showed Faradic behaviors in alkaline KOH. The results demonstrate that the CNT functionalization can be carried out relatively precisely by altering the treatment time to generate f-CNTs that have different C:COOH ratio, colloidal as well as electrochemical behavior. These are important considerations for studying quantitative aspects of CNT modifications.
Acknowledgments
Funding: This study was funded by the National Institute of Environmental Health Sciences (NIEHS) (Grant Number R01ES023209). Any opinions, findings, and conclusions or recommendations expressed in this material are those of the author (s) and do not necessarily reflect the views of NIEHS.
Footnotes
Compliance with ethical standards: Conflict of interest: The authors declare that they have no conflict of interest.
References
- Aitchison TJ, et al. Purification, cutting, and sidewall functionalization of multiwalled carbon nanotubes using potassium permanganate solutions. J Phys Chem C. 2007;111(6):2440–2446. [Google Scholar]
- Chen Y, Mitra S. Fast microwave-assisted purification, functionalization and dispersion of multi-walled carbon nanotubes. J Nanosci Nanotechnol. 2008;8(11):5770–5775. doi: 10.1166/jnn.2008.215. [DOI] [PubMed] [Google Scholar]
- Coleman KS, et al. Functionalization of single-walled carbon nanotubes via the Bingel reaction. J Am Chem Soc. 2003;125(29):8722–8723. doi: 10.1021/ja0355675. [DOI] [PubMed] [Google Scholar]
- Datsyuk V, et al. Chemical oxidation of multiwalled carbon nanotubes. Carbon. 2008;46(6):833–840. [Google Scholar]
- Desai C, et al. Aggregation behavior of nanodiamonds and their functionalized analogs in an aqueous environment. Environmental Science: Processes & Impacts. 2014;16(3):518–523. doi: 10.1039/c3em00378g. [DOI] [PubMed] [Google Scholar]
- Elimelech M, et al. Particle deposition and aggregation: measurement, modelling and simulation. Butterworth-Heinemann; 1998. [Google Scholar]
- Frackowiak E, et al. Supercapacitor electrodes from multiwalled carbon nanotubes. Appl Phys Lett. 2000;77(15):2421–2423. [Google Scholar]
- Goyanes S, et al. Carboxylation treatment of multiwalled carbon nanotubes monitored by infrared and ultraviolet spectroscopies and scanning probe microscopy. Diam Relat Mater. 2007;16(2):412–417. [Google Scholar]
- Huang W, et al. Sonication-assisted functionalization and solubilization of carbon nanotubes. Nano Lett. 2002;2(3):231–234. [Google Scholar]
- Iijima S. Helical microtubules of graphitic carbon. Nature. 1991;354(6348):56–58. [Google Scholar]
- Lin Y, et al. Functionalizing multiple-walled carbon nanotubes with aminopolymers. J Phys Chem B. 2002;106(6):1294–1298. [Google Scholar]
- Martín O, et al. An efficient method for the carboxylation of few-wall carbon nanotubes with little damage to their side-walls. Mater Chem Phys. 2013;140(2–3):499–507. [Google Scholar]
- Morales-Lara F, et al. Functionalization of multiwall carbon nanotubes by ozone at basic pH. Comparison with oxygen plasma and ozone in gas phase. J Phys Chem C. 2013;117(22):11647–11655. [Google Scholar]
- Naeimi H, et al. Efficient and facile one pot carboxylation of multiwalled carbon nanotubes by using oxidation with ozone under mild conditions. Appl Surf Sci. 2009;256(3):631–635. [Google Scholar]
- Nair AK, et al. Cooperative deformation of carboxyl groups in functionalized carbon nanotubes. Int J Solids Struct. 2012;49(18):2418–2423. [Google Scholar]
- Ntim SA, et al. Size dependent aqueous dispersibility of carboxylated multiwall carbon nanotubes. J Environ Monit. 2012;14(10):2772–2779. doi: 10.1039/c2em30405h. [DOI] [PMC free article] [PubMed] [Google Scholar]
- Oh YJ, et al. Oxygen functional groups and electrochemical capacitive behavior of incompletely reduced graphene oxides as a thin-film electrode of supercapacitor. Electrochim Acta. 2014;116(0):118–128. [Google Scholar]
- Perreux L, Loupy A. A tentative rationalization of microwave effects in organic synthesis according to the reaction medium, and mechanistic considerations. Tetrahedron. 2001;57(45):9199–9223. [Google Scholar]
- Rogel-Hernández E, et al. Side-Wall functionalization of multi-walled carbon nanotubes with t-butyl Diazoacetate. J Mex Chem Soc. 2011;55(1):7–10. [Google Scholar]
- Saleh NB, et al. Aggregation kinetics of multiwalled carbon nanotubes in aquatic systems: measurements and environmental implications. Environ Sci Technol. 2008;42(21):7963–7969. doi: 10.1021/es801251c. [DOI] [PubMed] [Google Scholar]
- Salzmann CG, et al. The role of carboxylated carbonaceous fragments in the functionalization and spectroscopy of a single-walled carbon-nanotube material. Adv Mater. 2007;19(6):883–887. [Google Scholar]
- Sun YP, et al. Functionalized carbon nanotubes: properties and applications. Acc Chem Res. 2002;35(12):1096–1104. doi: 10.1021/ar010160v. [DOI] [PubMed] [Google Scholar]
- Wu Z, Mitra S. Length reduction of multi-walled carbon nanotubes via high energy ultrasonication and its effect on their dispersibility. J Nanopart Res. 2014;16(8):1–7. [Google Scholar]


