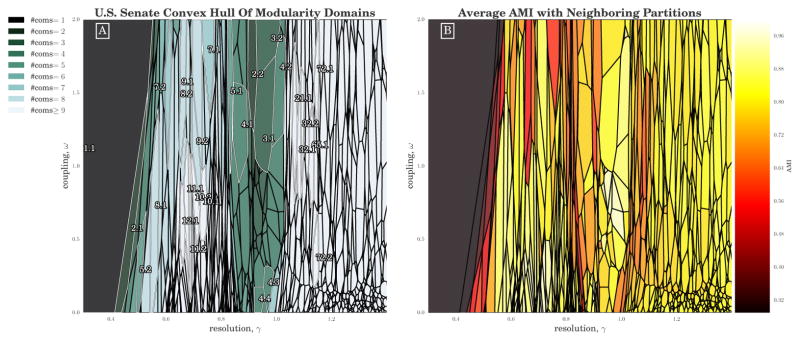
Figure 6.
(A) Domains of optimization for the pruned set of partitions, colored by the number of communities within each partition. The set of partitions was generated from 240, 000 runs of GenLouvain [41] on a 600 × 400 uniform grid over [0.3, 2] × [0, 2] in (γ,ω). The largest partitions are labeled “X.Y” with X the number of communities with ≥ 5 nodes and Y the rank of the domain area (that is, in terms of size) for that given number of communities (e.g., “5.2” is the second-largest domain corresponding to 5-community partitions). The partitions of each labeled domain are visualized in Appendix A; (B) Weighted-average AMI of each partition with its neighboring domains’ partitions, weighted by the length of the borders between neighboring domains.

