

Abstract
Integrin adhesion receptors are essential for development and functioning of multi-cellular animals. Integrins mediate cell adhesion to the extracellular matrix and to counter-receptors on adjacent cells and the ability of integrins to bind extracellular ligands is regulated in response to intracellular signals that act on the short cytoplasmic tails of integrin subunits. Integrin activation, the rapid conversion of integrin receptors from low to high affinity, requires binding of talin to integrin β tails and, once bound, talin provides a connection from activated integrins to the actin cytoskeleton. A wide range of experimental approaches have contributed to the current understanding of the importance of talin in integrin signaling. Here we describe two methods that have been central to our investigations of talin; a biochemical assay that has allowed characterization of interactions between integrin cytoplasmic tails and talin and a fluorescent activated cell sorting procedure to assess integrin activation in cultured cells expressing talin domains, mutants, dominant negative constructs, or shRNA.
Keywords: Integrin, talin, activation
1. Introduction
Integrin adhesion receptors are type I transmembrane heterodimeric glycoproteins capable of bi-directionally transmitting signals between the intracellular and extracellular environments. The extracellular domains of the integrins specifically bind in a cation-dependent manner to extracellular matrix (ECM) proteins or to counter-receptors on adjacent cells, and the short cytoplasmic tails link to cytoskeletal elements, adaptors and signaling proteins inside the cell (1–7). These adhesive interactions permit transmission of mechanical and chemical signals into and out of the cell and are crucial for a great many processes including embryonic development, tissue maintenance and repair, host defense, and hemostasis (8–16). A notable feature of integrins, central to these activities, is their ability to undergo extensive conformational changes that regulate their affinity for extracellular ligands (17). Conformational rearrangement of the extracellular domains occurs in response to signals that impinge on the integrin cytoplasmic tails, a process referred to as “inside-out” signaling or integrin activation (3, 5). It is now appreciated that the large cytoskeletal adaptor protein, talin, plays a central role in integrin function, both as a mechanical link between integrins and the actin cytoskeleton and as an essential regulator of integrin activation (7, 18–22).
Talin is a cytoskeletal actin-binding protein composed of an amino terminal globular, 50 kDa, head followed by a 220-kDa rod domain (18, 19). The talin head (amino acids 1-433) contains a three-lobed FERM (4.1, ezrin, radixin, moesin) domain preceded by an F0 domain and followed by a 33-amino acid stretch (23–25). The third lobe of the talin FERM (F3) is structurally related to a phosphotyrosine-binding (PTB) domain and mediates direct binding to an NP(I/L)Y motif in integrin β tails (23, 25). The talin rod is composed of a series of helical bundles (26, 27) and contains the major binding sites for actin and vinculin, as well as a dimerization site and a second integrin-binding site (28–30). The potential that talin provides a step in an integrin-mediated transmembrane linkage from the ECM to actin was first appreciated more than 20 years ago (31) and more recently, advanced biophysical analysis has demonstrate a role for talin as a molecular mechanosensor and confirmed the importance of talin in providing an initial linkage from integrins to actin that is important for stabilizing cell spreading (21, 22, 32).
In addition to its mechanical role, approximately 10 years ago talin was first implicated in regulation of integrin activation (33). Using recombinant mimics of integrin β subunit cytoplasmic tails we showed that talin bound directly to integrin β tails, and localized the talin-binding site within the β tail to the first NP(I/L)Y motif and the integrin binding site to the F3 sub-domain of the talin head (23, 33). We further showed that over-expression of integrin-binding F3-containing fragments of talin triggered activation of αIIbβ3 integrins, but that talin or integrin mutants defective in binding were impaired in activation (33, 34). Based on these data and the finding that knockdown of talin impaired integrin activation we proposed that talin binding, via its PTB domain-like F3 sub-domain, to the integrin β tail was a final common step in integrin activation (34). This conclusion has extensive in vitro and in vivo support from additional structural and mutational analyses, and from the phenotypes of knockout and knock-in model organisms (35–41).
While a key role for the PTB-like domain-integrin β tail interaction in integrin activation is now well established, additional complexities have recently become apparent. Integrin activation by the F3 sub-domain also requires additional interactions with membrane-proximal integrin residues (36) and in intact talin this interaction is impaired due to a previously predicted (42), auto-inhibitory talin head-rod interaction (43, 44). Talin binding to integrin β tails is regulated by phospholipid binding and intracellular signaling pathways through control of talin localization and release of the auto-inhibitory activation (43, 45–47). Competition between talin and other integrin β tail-binding proteins provides an additional layer of regulation (36, 48, 49). Surprisingly, while talin can bind most short integrin β tail and talin-binding seems to be a general requirement, at least for β1, β2 and β3 integrin activation, differences in the ability of minimal integrin-binding talin domains to activate β1 and β3 integrins have highlighted differences between integrins and shown the importance of domains outside of the PTB-like F3 domain for cellular activation of integrins (50). More strikingly, evidence suggests that additional factors that cooperate with talin during integrin activation are important in vivo. The first such factors to be identified are the members of the kindlin family of proteins (20, 51). These proteins are structurally related to talin but bind to a distinct site on integrins and are required for normal integrin activation in vivo. A detailed understanding of how kindlins exert their effects is lacking and whether other proteins play similar roles by cooperating with talin during integrin activation remains to be determined. Thus, in spite of the extensive studies already performed on talin, many questions concerning its role in integrin signaling remain. A wide range of experimental approaches spanning structural biology, biochemistry, biophysics, cell biology and genetics have shaped our understanding of talin. Amongst them, two general methods have been central to our investigations of talin in integrin signaling; a biochemical assay that allowed characterization of integrin cytoplasmic tail interactions and a robust method to assess integrin activation in cultured cells expressing talin domains, mutants, dominant negative constructs, or shRNA. Here we will describe the assays we have used to investigate the roles of talin in integrin signaling, techniques that will continue to be useful in the examination of the role of proteins that modulate talin function.
2. Materials
2.1 Generation of recombinant talin head fragments and endogenous talin from mammalian cell lysates
Complete DMEM: Dulbecco’s Modified Eagle’s Medium (DMEM) (Gibco/BRL) supplemented with 10% fetal bovine serum (Atlanta Biologicals), 1% of 100× penicillin (10000 units/ml)/streptomycin (10000 μg/ml) (Gibco/BRL), 1% of 100× sodium pyruvate (100 mM) (Gibco/BRL), and 1% of 100× MEM non-essential amino acids solution (10 mM) (Gibco/BRL).
Dulbecco’s Phosphate Buffed Saline (DPBS) (Gibro/BRL).
Lipofectamine Reagent (Invitrogen)
Cell lysis buffer: 50 mM NaCl, 10 mM Pipes, 150 mM sucrose, 50 mM NaF, 40 mM Na4P2O7, pH 6.8, 0.5% Triton X-100, 0.1% sodium deoxycholate and EDTA-free protease inhibitor tablet (Roche).
BCA Protein assay (Pierce).
2.2 Purification of recombinant talin head fragments from bacterial cell lysates
Luria Broth Base (LB) (Invitrogen).
Isopropyl-beta-D-thiogalactopyranoside (IPTG), dioxane free (American Bioanalytical).
GST lysis buffer: phosphate buffered saline (PBS) pH 7.4, 1% Triton X-100, 1 mM dithiothreitol (DTT) and protease inhibitor tablet (Roche).
Glutathione-sepharose beads (GE Healthcare).
PBS wash buffer: PBS, 1% Triton X-100, and 1 mM DTT.
GST wash buffer: 0.1 M Tris-HCL pH 7.5, 0.1 M NaCl, 1% Triton X-100, 1 mM DTT, and protease inhibitor tablet.
GST elution buffer: add GST wash buffer with 20 mM glutathione (MP Biomedicals).
2.3 Integrin β Tails Binding Assay
Ni2+-NTA resin (Novagen).
Buffer XT: 50 mM NaCl, 10mM Pipes, 150 mM sucrose, 50 mM NaF, 40 mM Na4P2O7, 1 mM Na3VO4, 0.05% Triton X-100, pH 6.8.
2.4 Generation GST fused Fibronectin (9–11) from Bacteria
GST-Fibronectin(9–11) cDNA was engineered as previously described (52).
BL21 E. coli bacterial culture.
Luria Broth Base (LB) (Invitrogen).
Ampicillin Sodium Salt (American Bioanalytical).
IPTG
GST lysis buffer: phosphate buffered saline (PBS) pH 7.4, 1% Triton X-100, 1 mM DTT and protease inhibitor tablet (Roche).
Glutathione-sepharose beads (GE Healthcare).
PBS wash buffer: PBS, 1% Triton X-100, and 1 mM DTT.
GST wash buffer: 0.1 M Tris-HCL pH 7.5, 0.1 M NaCl, 1% Triton X-100, 1 mM DTT, and protease inhibitor tablet.
GST elution buffer: GST wash buffer with 20 mM glutathione (MP Biomedicals).
5× SDS Sample Buffer (100ml): 15.625 ml 1M Tris Base pH 6.8, 10 gm SDS, 20 ml glycerol, 0.1% Bromo phenol blue-100 mg. Add 1 ml β-mercapto ethanol to 3 ml of buffer to make 5× working solution.
Float-A-Lyser® (Spectrum Laboratories), 10 mm diameter, 3ml volume and 3,500 Da molecular weight cut-off.
2.5 Biotinylation of GST-Fibronectin (9–11)
Biotinyl-N-hydroxy-succininide (EZ-Link™ NHS-Biotin, spacer arm 13.5Å; Pierce).
Dimethyl sulfoxide (DMSO) (J.T. baker).
Fresh NaHCO3 1M solution.
PD10 desalting columns (Sephadex™ G-25 M; Amersham Bioscience).
Bovine Serum Albumin (BSA).
2.6 Fluorescence Activated Cell Sorting Activation Assay
5ml FACS polystyrene round-bottom tubes (BD Falcon).
Dulbecco’s Phosphate Buffered Saline (DPBS) (Gibco/BRL).
Ethylenediaminetetraacetic acid (EDTA) (American Bioanlaytical).
Nylon screening mesh (80μm) (Sefar NITEX®).
Tyrode’s Buffer pH 7.3: 136.9mM NaCl, 10mM Hepes, 5,5mM Glucose, 11.9nM NaHCO3, 2.7mM KCl, 0,5mM CaCl, 1,5mM MgCl, 0,4mM NaH2PO4.
EDTA-0.05% Trypsin (Gibco/BRL).
Rat Anti-mouse integrin β1 chain antibody (clone 9EG7) (BD Pharmingen).
Purified mouse IgM anti-human αIIbβ3 integrin PAC-1 antibody (BD Bioscience).
Streptavidin-AlloPhycocyanin (Thermo Scientific).
Alexa647-conjugated Donkey Anti-mouse IgG (H+L) antibody and Alexa647-conjugated goat anti-mouse IgM antibody (Molecular probes™ − Invitrogen).
MnCl2 (J.T. baker).
Mouse anti-human αIIbβ3 integrin D57 antibody. D57 is a function-independent antibody used for the detection of β3 integrins and αIIbβ3 on the surface of cells(53).
3. Methods
3.1 Biochemical analysis of integrin-talin interactions
Integrins are large heterodimeric proteins composed of bulky extra extracellular domains, a transmembrane region and generally short cytoplasmic tails and as a consequence raise challenges for biochemical analysis. In an effort to examine intracellular biochemical interactions with the integrin tail, we utilize a system of bacterial, recombinantly expressed proteins containing the integrin cytoplasmic tails. This system has provided a framework for reliably identifying the molecular requirements for integrin binding proteins, correlates with findings from genetic and structural experiments, and has been useful for providing extensive information on talin-integrin tail interactions (23, 33, 34, 48, 50, 54). The integrin tail pull-down assay has been described in detail in a previous review with a focus on the role of the integrin tail (55). The assay relies on expression and purification of recombinant integrin cytoplasmic tails consisting of an N-terminal His-tag followed by a thrombin cleavage site, a cysteine-residue linker, a coiled-coil sequence, a glycine spacer, and the integrin cytoplasmic domain (55). The cysteine linker and coiled-coil regions allow parallel dimerization of integrin tails in aqueous solution, act as a spacer between the integrin tail and affinity matrix and mimic the helical structure of integrin transmembrane domains. The His-tag allows purification of the recombinant proteins by metal ion-affinity chromatography and immobilization of the purified integrin tail on His-bind resin for use in binding assays. In the following sections we briefly discuss preparation of cell lysates for talin pull-down assays, the expression and purification of recombinant talin fragments in bacteria, and the pull-down assays themselves.
3.1.1 Preparation of mammalian cell lysates containing recombinant talin head fragments and endogenous talin
Integrin β tail pull-down assays can be performed using a variety of cell lysates (18, 55, 56). However, we generally use Chinese hamster ovary (CHO) cells because they can be efficiently transfected using standard protocols, have consistently provided successful expression for many of our proteins of interest, and are the cell type in which we have optimized the integrin activation assays discussed later in this review.
Culture CHO cells in complete DMEM media until confluent on a 10-cm tissue culture dish. If using untransfected cells, proceed to step “3”.
Wash cells with DPBS and transiently transfect cDNA encoding fragments of talin fused to epitope tags such as GFP, FLAG, HA, etc., utilizing Invitrogen’s recommendations for working with lipofectamine reagent. Typical talin fragments include F3, F2F3, F1F2F3, and entire head, encoding the amino acids 309-405, 206-405, 86-405, and 1-433, respectively (see Note 1).
24 hours post-transfection, wash cells with cold DPBS, lyse by scraping in 0.5 ml cell lysis buffer, collect into a 1.5 ml microcentrifuge tube and incubate on ice for 20 min.
Separate the insoluble fraction from the lysate by centrifugation at 20000 × g for 10 min at 4°C.
Determine the protein concentration of the supernatant using the BCA protein assay and either use lysates immediately or store at −20°C until required.
3.1.2 Expression and purification of recombinant talin fragments from bacterial cell lysates
Based on sequence analysis and insights from structural findings, we have been able to express recombinant fragments of talin fused to a tag useful for protein purification (23, 33, 50). Here we will describe purification of talin fragment fused to GST, however other tags, such as His-tag, may also be used (57).
Inoculate 100 ml of LB containing the appropriate antibiotics with BL21 E. coli culture containing GST-talin fusion protein expression construct. Grow overnight at 37°C in a rotary shaker incubator (radius of gyration: one inch) with agitation at 225 rpm.
Use the overnight culture to inoculate 2 liters of LB with appropriate antibiotic and continue to grow the culture to an approximate OD600 of 0.4 (see Note 2).
Induce the bacteria with IPTG (0.2 mM final concentration) and grow for 3 hours (see Note 2).
Harvest the bacteria by centrifugation and resuspend in 60 ml of GST lysis buffer on ice. Lyse by sonication and repeat until the bacterial extract is no longer viscous.
Centrifuge at 30000 × g for 25 min at 4°C and collect the supernatant.
During this final centrifugation step, prepare 0.5 ml glutathione-sepharose beads. Wash with 10 volumes PBS and then mix with supernatant from step “5”.
Incubate the glutathione-sepharose beads with the bacterial lysate overnight at 4°C with slight agitation to avoid bead sedimentation.
Load the beads onto a column. Wash once with 20 volumes PBS wash buffer followed by two washes with 20 volumes GST wash buffer.
Elute GST fusion proteins with 20 volumes of GST elution buffer and collect eluate in 1 ml fractions.
Analyze the elution fractions on a 10% Tris-glycine SDS polyacrylamide gel to identify fractions containing the GST-fusion protein. Determine the concentration of fusion protein in positive fractions and keep at 4°C for immediate use or store at −20°C until needed.
3.1.3 Preparation of recombinant integrin β tails and subsequent binding assays
The details for these steps have been described by Lad et al. (55). Briefly, this assay entails:
Bacterial expression of integrin cytoplasm tails containing an N-terminal His-tag.
Purification of integrin cytoplasmic tails from the bacterial lysates through two rounds of sonication and centrifugation, batch absorption to Ni2+NTA resin, elution from the resin followed by purification via reversed-phase high-pressure liquid chromatography.
Preparation of the affinity matrix through the steps of mixing purified integrin tails with Ni2+-charged beads in the presence of binding buffer, followed by washing steps to remove urea and exchange integrin tail-coated resin into Buffer XT.
Mixing either cell lysates or bacterially purified proteins with the integrin tails for 24 or 2 hours, respectively, at 4°C, followed by several washing steps, resuspending beads in SDS sample buffer, boiling samples and analyzing on SDS polyacrylamide gel through either immunoblotting and/or Coomassie stain (see Note 3).
3.2 Integrin activation assays
Integrin activation assays provide functional readouts that have complemented our biochemical and structural studies to reveal the effect of different talin fragments on the activation of surface expressed integrins. These assays rely on Fluorescence Activated Cell Sorting (FACS), to measure protein expression and integrin activation state in individual cells. Here, we will outline the basis for these assays that make powerful tools in screening for players in integrin signaling (58) and discovering new regulators of talin-mediated integrin activation (54, 59–61).
Integrin activation involves conformational changes in the ectodomains that result in an increase in affinity for ligand. As the dynamically regulated integrin domains are exposed on the surface of the cell, and so accessible to reporter ligand or antibody binding, we can use FACS analysis as a means to measure integrin activation in live cells. Our FACS assays rely on the selective binding of integrin ligands or ligand-mimetic antibodies only to activated integrins. When combined with transiently-expressed fluorescently-tagged talin fragments this assay permits us to assess the effect of talin on activation of endogenous or exogenously expressed integrin using multi-color FACS analysis. This technique, coupled to proper data analysis, offers an excellent tool to study the intricate control of integrin activation and a variety of FACS-based integrin activation assays have been developed (62–65). We will discuss the details of those in use in our lab which are based on an assay originally developed by the Shattil and Ginsberg labs (63, 66). This sensitive assay, initially developed for αIIbβ3 integrins, has been amended to also allow measurements on fibronectin-binding β1 integrins and has become a powerful tool for understanding modes of regulation of integrin activity.
3.2.1. Probes used to assess integrin activation by flow cytometry
Antibodies
Monoclonal antibodies that recognize neo-epitopes on the extracellular domain of the activated integrin are commonly used to report integrin activation state; examples include Ab24 a β2 integrin specific mouse antibody (67) and HUTS-21 antibody a β1 specific mouse antibody (68). The anti-αIIbβ3 mouse monoclonal IgM antibody PAC1, which is the basis of our αIIbβ3-activation assay, is notable as it is a ligand-mimetic antibody that binds to the extracellular ligand-binding site in the integrin in a very similar way to the specific ligand (69, 70). PAC1 is capable of competing with fibrinogen for binding to active αIIbβ3 integrins (71) and sequencing has revealed that the complementarity-determining region 3 within PAC1 heavy chain contains an RYD sequence forming the integrin-binding site and behaving like the RGD sequence in fibrinogen (69). Mutagenesis around this site has permitted generation of activation-specific antibodies against human and mouse αIIbβ3 and αvβ3 (72, 73) and the Drosophila αPS2βPS (74).
Ligands
Soluble ligands can also be used to probe integrin activation in flow cytometry because integrins require activation to bind to soluble ligands. Natural ligands are often large, multivalent proteins that bind more than one integrin, making them unsuitable for studying integrin activation; however intact fluorescently-labeled fibrinogen has been successfully used in integrin activation assays (34, 73, 75). More commonly, soluble recombinant fragments from extracellular integrin ligands, engineered to ensure specificity towards the integrin of interest and to lower multivalency are used in activation assays (50, 76–80). We use a well characterized GST-fused fragment of fibronectin to probe α5β1 integrin activation. The GST-fibronectin(9–11) (GST-FN9-11) fragment contains the 9th, 10th and 11th type III repeats of Xenopus fibronectin (52). This fragment carries the α5β1 integrin-binding RGD site (repeat 10) along with the synergy motif “PPSRN” (repeat 9) known to support the spreading of many cell types (81). Fibronectin is well conserved and the Xenopus protein also binds human and mouse integrins.
Specificity controls
Specific binding of ligand mimetic anti-integrin antibodies or soluble ligands can be inhibited by RGD peptides, small molecule antagonists such as, Ro43-5054 or 3F (69, 82–84). Integrin-ligand binding is also divalent cation-dependant and therefore can be inhibited by EDTA (85). Antibody or soluble ligand binding in the presence of integrin antagonists or EDTA can therefore be used to assess background non-specific binding in our FACS assays and provides a control for the specificity and selectivity of the activation reporters being used. In addition, binding should be enhanced in presence of integrin activators such as the divalent cation Mn2+ or activating antibodies.
3.2.2. Expression and Purification of GST-FN 9-11
Inoculate 1L of LB, 50 μg/ml Ampicillin, with 25 ml of overnight culture of BL21 E.coli carrying the GST-tagged Fibronection(9–11) construct. Incubate at 37°C in a rotary shaker (radius of gyration: one inch) with agitation at 225 rpm until it reaches an OD600 of 0.4.
Induce the bacterial culture with IPTG (final concentration 0.2 mM) and continue culture for 3 hours, at 37°C with shaking.
Harvest the bacteria by centrifugation for 20 min at 5500 × g at 4°C. Gently resuspend the pellet in 30 ml of GST Lysis Buffer and avoid making bubbles, then transfer the mixture into a beaker and maintain at 4°C.
Lyse the bacteria with 10 seconds bursts of sonication followed by 50 seconds on ice to avoid overheating. Repeat until the extract is no longer viscous.
Centrifuge at 30000 × g for 25 min at 4°C and collect the supernatant.
During the last centrifugation step, prepare 250 μl glutathione-sepharose beads. Wash with 10 ml of PBS and then mix with the supernatant from step “5”.
Incubate the glutathione-sepharose beads with the bacterial lysate overnight at 4°C with slight agitation to avoid bead sedimentation.
Load the beads onto a column and wash with 10 ml of PBS-Triton X-100 at 4°C, followed by two 10 ml washes with Wash Buffer.
Elute the GST-FN 9-11 fragment with 1.5 ml of Elution Buffer at 4°C. Incubate 5 min at room temperature and collect the eluted fraction in a 1.5 ml centrifuge tube and store on ice. Repeat to collect 6 to 8 fractions.
Check the levels and purity of eluted protein in each fraction by SDS-PAGE followed by protein staining.
Pool the two fractions containing most GST-FN9-11 protein, load into a Spectra/Pro® Float-A-Lyser® unit (Diameter: 10 mm, Volume: 3 ml, MWCO: 3,500Da) (Spectrum Laboratories) and dialysis against 4L of PBS at room temperature overnight to remove the free glutathione. Replace dialysis fluid with fresh PBS and continue dialysis for 2h.
Collect the dialyzed GST-FN9-11 and store on ice.
3.2.3. Biotinylation of GST-FN9-11
To enable detection of the FN9-11 with flurophore conjugated streptavidin we covalently attach NHS-biotin (short chain) to the purified, dialyzed protein. For optimal biotinylation, the FN9-11 concentration should be between 0.5 and 2.0 mg/ml.
Dissolve 1 mg of biotinyl-N-hydroxy-succinimide in 100 μl DMSO.
Mix 800 μl dialyzed FN9-11with 100 μl freshly prepared 1M NaHCO3, and 100 μl of the biotin solution and incubate for 1 h at room temperature with gentle agitation.
During the incubation step, pre-equilibrate a PD10 desalting column. Add 1 ml of 1% BSA to the column to block non-specific binding sites and wash extensively with 20 to 40 ml PBS.
Load the biotinylated FN 9-11 sample onto the pre-equilibrated PD10 column and elute the FN 9-11 in 1 to 1.5ml fractions by adding PBS.
Identify protein-containing fractions based on absorbance at 280 nm and store at 4°C.
3.2.4. Preparation of cells for use in integrin activation assays
The integrin activation assays described below can be used on a wide range of cell types. Platelets and polymorphonuclear neutrophils present a good cell model for studying activation of endogenous integrins because they are abundant, can be readily harvested from blood, and because integrin activation is tightly regulated in these cells (66, 86). These primary cells are however not readily transfectable and so to investigate the effects of specific proteins or pathways on integrin activation a variety of adherent, immortalized and well established cell lines have been used, including CHO, NIH-3T3 and Jurkat (34, 48, 87), as well as ES cell-derived megakaryocytes (88) and murine bone marrow derived megakaryocytes (89, 90).
We make extensive use of CHO cells as lines in which to assess the effect of knocking down integrin regulatory molecules or over-expressing talin, talin fragments or molecules that cooperate with talin (23, 33, 34, 59). CHO cells have been widely used to investigate β1 integrins (91, 92) and a variety of CHO cell lines that express different wild type and chimeric integrins has permitted investigation of other integrin families not normally present in CHO cells, most notably the platelet integrin αIIbβ3 (53, 83, 91, 93) CHO cells are cultured as previously described (94) in Dulbecco’s Modified Eagle’s Medium (DMEM) supplemented with 10% fetal calf serum (FCS), 100 U/ml of penicillin, 0.1 mg/ml of streptomycin, 2 mM of L-glutamine, and 1% nonessential amino acids at 37°C in 5% CO2.
To assess the effect of specific integrin regulators, we transiently over-express fluorescent, GFP- or DsRed-tagged recombinant proteins in the chosen cell line using pcDNA3 (Invitrogen); pEGFP (BD Biosciences Clontech) or pDsRed (BD Biosciences Clontech) vectors as follows:
Seed 1×10⁶ CHO cells per 10 cm plate for transfection the next day (see Note 4).
Mix 250 μl of DMEM with 2–4 μg of DNA and add 4 μl lipofectamine/μg of DNA. Incubate the mixture at room temperature for 15 min.
Wash the cells once with 5 ml of room temperature PBS to remove the serum and any dead cells, then add 5 ml of DMEM and the DNA-lipofectamine mixture from step 2 to the plate and incubate for 5 hours at 37 °C in incubator (5 % CO2)
Wash the plate once with 5 ml room temperature PBS, then add 10 ml of Complete DMEM and incubate at 37°C, 5 % CO2, over night.
3.2.5 FACS Integrin Activation Assay
This assay assesses integrin activation by measuring the binding of PAC1 antibody or biotinylated-FN9-11 or to cells expressing constructs of interest. Cells are transfected as described above, and sixteen to eighteen hours after transfection integrin activation is assessed by FACS. Bound FN9-11 or PAC1 is detected using streptavidin or anti-mouse IgM antibodies conjugated to APC or Alexa647 fluorophores whose emitted fluorescence is measured in the FL4 channel of the FACS machine. The optimum concentrations of PAC1, FN9-11 and fluorophore-conjugated secondary antibody or streptavidin for the cell line under study is determined by titration. Expression levels of the expressed GFP- or Ds-Red conjugated proteins are assessed in the FL1 or FL2 channel respectively. The separation between the emission optima for the GFP or DsRed fluorophores and the APC or Alexa647 fluorophores avoids crosstalk between the FL1 or FL2 channels and the FL4 channel so simplifying analysis of the results.
Cells from each plate, over-expressing one fluorescent protein of interest or control, are routinely divided into 4 tubes to undergo different treatments prior to FACS analysis. In three tubes integrin activation state is assessed either in native conditions, in the presence of an inhibitor of ligand binding such as EDTA or small molecule inhibitor, or in the presence of an exogenous integrin activator such as 1 mM Mn2+ or activating antibody (9EG7 for α5β1 integrins anti-LIBS6 for αIIbβ3 integrins). As described below these conditions allow for assessment of the non-specific background binding and the maximum fully stimulated binding and the native binding can then be related to these minima and maxima. In the fourth tube integrin surface expression is assessed with an antibody that binds integrin in an activation-independent manner, we use PB1 (95) to measure hamster α5β1 levels in CHO cells and D57 (53) to assess αIIbβ3 expression levels. These measures can be used to normalize integrin activation results to the total integrin expression level.
The method outlined below describes a basic FACS integrin activation assay. Similar methods are used for α5β1 and αIIbβ3 the major difference being that FN9-11 is used to report α5β1 activation while PAC1 is used for αIIbβ3.
Wash transfected plates once with 5 ml room temperature PBS to remove dead cells and serum contained in the medium. Add 0.7 ml of 0.5 mM EDTA, 0.05% trypsin and incubate 5–10 min at 37°C.
Neutralize trypsin with 0.7 ml of Complete DMEM, collect the detached cells in a tube and spin for 5 min at 200 g at room temperature.
Wash the cells by re-suspending them in 1.5 ml room temperature PBS. Filter the cell suspension through an 80 μm Nylon screening mesh (SEFAR NITEX®; see Note 5) and then remove 10 μl for cell counting.
Pellet cells by spinning 5 min at 200 g at room temperature, and re-suspend gently at 6 to 8×10⁶/ml in Tyrode’s Buffer.
Transfer 45 μl of cell suspension to each of 4 FACS tubes; 4 FACS tubes for each transfected plate allows measurement of reporter binding in native, activated and inhibited condition as well as one tube to measure integrin expression levels by standard antibody FACS assay performed in parallel using anti-α5 or anti-αIIbβ3 antibodies PB1 or D57 respectively.
Add 2.5 μl 200 mM EDTA to the inhibited tubes and incubate 10 min at room temperature.
Add 2.5 μl Tyrode’s Buffer to each native tube.
For activated tubes add 5 μl 20 mM MnCl2, or if using activating antibodies, 5 μl 100 μg/ml 9EG7 for α5β1 assays, or anti-LIBS6 for αIIbβ3 assays.
Add 2.5 μl of the appropriate dilution of activation reporter (determined by titration) to each tube; biotinylated-GST-FN9-11 for α5β1 assays, PAC1 for αIIbβ3 assays.
Incubate FACS tubes at 30 °C for 30 min.
Wash off unbound ligand/antibody by adding 250 μl Tyrode’s Buffer to each tube then pellet cells 5 min at 200 g at room temperature. Carefully pour off the supernatant.
For α5β1 assays, re-suspend the cells in 50 μl of 2% APC-conjugated Streptavidin in Tyrode’s Buffer. For αIIbβ3 assays re-suspend the cells in 50 μl of 2.5 μg/ml alexa647-conjugated anti-Mouse IgM in Tyrode’s Buffer.
Incubate FACS tubes for 30 min on ice in the dark.
Wash off unbound antibodies by adding 250 μl cold Tyrode’s Buffer to each tube then pellet cells 5 min at 200 g at 4°C, then carefully pour off the supernatant.
Re-suspend cells in 400 μl cold PBS.
Analyze stained cells using FACS Calibur or LSRII FACS machines and collecting 10000–30000 cells per condition.
3.2.6 Data analysis
The FACS analysis described above provides data on FN9-11 or PAC1 binding to transfected and un-transfected cells under a variety of conditions. These data can be processed using Flowjo analysis software. Analysis first requires identification of the live cells based on their forward and side scatter (Figure 1a). Cells with the appropriate forward and side scatter are gated and further analysis is performed on this population. The GFP or DsRed signal (respectively FL1 or FL2) is plotted against the PAC1 or FN 9-11 binding signal (FL4) providing a visual representation of how the ability of cells to bind soluble integrin ligand changes in response to expression of the fluorophore-tagged recombinant protein (Figure 1b). Gating of cells based on GFP or DsRed fluorescence permits segregation into expressing and non-expressing populations or further separation into high- and low-expressing cells. The PAC1 or FN9-11 binding to cells in each of these populations can then be expressed as a frequency histogram and geometric mean fluorescence intensity (GMFI) of cells in the population calculated (Figure 1c). Applying the same multi-gating parameters to all tubes from a given sample allows calculation of GMFI values for the native, activated and inhibited conditions and a similar approach allows calculation of integrin levels on the cells based on anti-integrin antibody staining (Figure 1c). As discussed below these data permit calculation of the activation state of integrins on the transfected cells. Applying the same gating parameters to cells transfected with different constructs allows comparison of the effect of different talin domains on integrin activation. Furthermore since all data is expressed based on populations gated for comparable GFP or DsRed expression levels any differences in expression levels between constructs are evident and can be controlled for.
Figure 1.
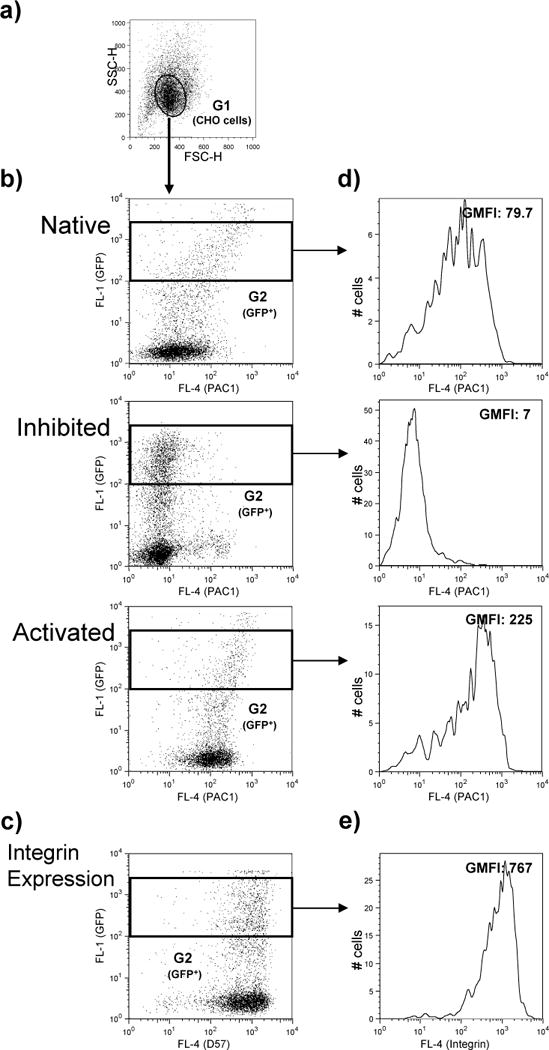
Analysis of αIIbβ3 activation in CHO cells expressing GFP-talin head. CHO cells stably expressing αIIbβ3 were transfected with DNA encoding GFP-talin head, the following day αIIbβ3 activation and expression were assessed as described in the text. Binding of the ligand-mimetic monoclonal antibody PAC1 was measured under native, activating and inhibited conditions and integrin expression was determined using the D57 monoclonal antibody. Data were analyzed using Flowjo software. a) A plot of forward scatter (FCA-A) vs side scatter (SCA-A) was prepared and the gate G1 was drawn around the CHO cells population based on its homogenous size and granularity; debris and dead cells that scatter differently were excluded. For each condition, using data from cells falling within the G1 gate, GFP signal in the FL1 channel was plotted against the PAC1 (b) or the D57 (c) signal in the FL4 channel. A rectangular gate, G2, was then drawn to identify cells expressing GFP at high levels. Frequency histograms were plotted as a means of expressing PAC1 (d) or D57 (e) binding to cells within the G2 gate and the geometric mean fluorescence intensity was calculated.
We routinely use activation index as a measure of integrin activation. This is expressed as AI = (F – F0)/(Fmax – F0), where F is the geometric mean fluorescence intensity (GMFI) of FN9–11 binding, F0 is the GMFI of FN9–11 binding in presence of binding inhibitor (peptide, antibody or EDTA), Fmax is the GMFI of FN9–11 binding in the presence of binding activator (antibody or Mn2+). Alternatively, since we can measure integrin expression levels on the gated population we can express activation as the specific reporter ligand binding normalized for integrin expression using the equation AI = (F – F0)/(Fintegrin), where Fintegrin is the normalized GMFI of a function-independent integrin-specific antibody binding to transfected cells (50).
The assay described above readily permits assessment of the effect of expression of fluorophore tagged proteins on integrin activation state. It is straightforward to modify this assay to assess the effect of non-tagged proteins that are co-transfected with an expression construct for a fluorescent marker protein (e.g. talin constructs co-transfected with GFP (50, 96)). Alternatively, another non-fluorescent marker protein, such as a transmembrane protein to which an antibody to the extracellular domain is available, can be used allowing transfection to be assessed by antibody staining in parallel with assessment of integrin activation (33, 97). The disadvantage of such assays is that they do not allow for direct measurement of the levels of the protein of interest and rely instead on the assumption that expression levels of the protein of interest and the marker protein are directly proportional.
The recent discovery of new integrin co-activators, such as kindlin (59–61), has highlighted the importance of assessing integrin activation using more than one protein at a time. The basic integrin activation assay can therefore be modified to assess levels of two differently-tagged co-expressed proteins simultaneous with measuring integrin activation state. In these assays we use cells co-expressing GFP- and DsRed-tagged proteins (e.g. DsRed-talin and GFP-kindlin or GFP-talin and DsRed-kindlin (3, 98)). By monitoring the expression of each protein and the integrin activation reporter in different channels, we are able to more accurately investigate the effect of expressing an additional factor, such as kindlin, on talin-mediated integrin activation (see Note 6).
Preparing doubly transfected cell
A key step in assays involving two activator proteins is efficient co-expression of both proteins as in many cases expression of one protein can impair the expression of the second. The transfection protocol for expressing two proteins is essentially the same as that described above for expressing a single protein but in a co-transfection setting, the expression of each fluorescent protein should initially be assessed by varying the amounts and ratios of the two DNAs to optimize their co-expression in the double transfected cells. This process needs to be repeated for each pair of proteins and fluorophores under test, and for each cell line being used.
Preparation of compensation controls
Monitoring both green and red signals in adjacent channels (FL1 and FL2) requires careful setup of the FACS machine using the proper compensation controls prior to acquisition of the double transfected cells. Controls should include untransfected cells, cells expressing only GFP and cells expressing only DsRed. These control cells are processed along with the experimental samples but do not receive PAC1 or FN 9-11 and therefore should only exhibit background levels of fluorescence in the FL4 channel.
Prior to acquisition of the experimental samples, the acquisition gate and channel voltages are set using untransfected cells. This provides a background signal in each channel. GFP-expressing cells are then run and setting adjusted to compensate for any green signal that bleeds through into the red channel. Likewise DsRed-expressing cells are then used to compensate for any red signal that bleeds into the green channel.
Data analysis
Data analysis proceeds much as described in Figure 1 but requires an additional step to gate on cells expressing both green and red fluorescent proteins (Figure 2). After gating on the live cell population based on forward and side scatter, a population that is positive for both DsRed and GFP signal is then selected. The GMFI signal for GFP and DsRed in this gate is then calculated and a similar gate is applied to other experimental samples. This gate is then adjusted to ensure that the gated population in each sample has comparable GMFI for GFP and DsRed. The GMFI of PAC1, FN9-11 or anti-integrin antibody binding within this gate is then calculated (Figure 2) for each condition and activation indices calculated as described above.
Figure 2.
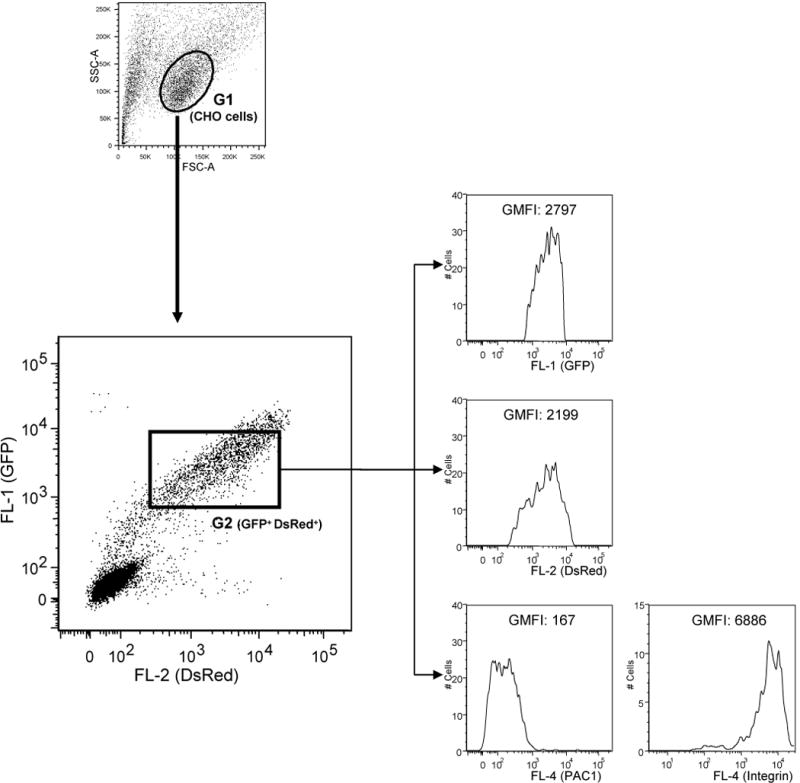
Analysis of αIIbβ3 activation in CHO cells expressing GFP-talin head and DsRed-kindlin1. CHO cells stably expressing αIIbβ3 were transfected with DNA encoding GFP-talin head and DsRed-kindlin1 and αIIbβ3 activation and expression was assessed as described in the text. Results were analyzed as described in Figure 1 but the G2 gate was drawn to define a double positive (GFP and DsRed) CHO cell population. Histogram plots from cells in this gate were generated to measure the GMFI of GFP, DsRed and PAC1 or D57.
Footnotes
When expressing recombinant fragments of talin head in mammalian cells we find that expression levels and transfection efficiency depend on cell type and on the boundaries of the construct used. With therefore vary the amount of cDNA used during the transfection step to optimize protein production.
When working with bacterial cultures recombinant talin expression levels vary depending on the boundaries of the construct and the epitope/affinity tag used. In an effort to maximize protein expression we sometimes induce at a higher OD600, as high as 0.8, vary the amount of IPTG used for induction, and increase the total volume of LB used to increase the overall yield. To improve purification of talin fragments from bacteria we also vary the lysis buffer or induce protein expression at lower temperatures e.g. 12–16 °C overnight.
Common areas for optimization in the integrin tail binding assays include varying the stringency of the binding buffer, varying the amount of cell lysate or purified recombinant protein used in the binding assay and lastly decreasing the amount of integrin tails coated on the matrix in an effort to reduce non-specific binding.
Seeding 1 × 10⁶ CHO cells in a 10 cm plate ensures that cells will be adherent and sufficiently confluent when transfected the following day. We find cell confluency is important for good transfection and efficient expression of recombinant proteins. Under our experimental conditions, 106 cells CHO cells will have 60–70% confluency on the day of transfection generally yielding 40–50% transfection efficiency. If different cell types are used the seeding density will need to be optimized for each cell type.
Filtration of cell suspensions proior to analysis by FACS is important to remove large cell aggregates that might clog the FACS machine and interfere with data acquisition.
Advanced applications of the FACS Integrin Activation Assay using two co-expressed activators are performed as described for the basic integrin activation FACS but some modifications are required to (i) ensure efficient expression of both proteins, (ii) allow accurate measurement of both GFP and DsRed fluorophores in the same cell without extensive crosstalk between the FL1 and FL2 channels and (iii) ensure that comparable populations of double transfected cells are used for data analysis. These areas are highlighted below.
References
- 1.Luo BH, Carman CV, Springer TA. Structural basis of integrin regulation and signaling. Annu Rev Immunol. 2007;25:619–47. doi: 10.1146/annurev.immunol.25.022106.141618. [DOI] [PMC free article] [PubMed] [Google Scholar]
- 2.Arnaout MA, Goodman SL, Xiong JP. Structure and mechanics of integrin-based cell adhesion. Curr Opin Cell Biol. 2007;19:495–507. doi: 10.1016/j.ceb.2007.08.002. [DOI] [PMC free article] [PubMed] [Google Scholar]
- 3.Harburger D, Calderwood DA. Integrin signalling at a glance. J Cell Sci. 2009;122:159–63. doi: 10.1242/jcs.018093. [DOI] [PMC free article] [PubMed] [Google Scholar]
- 4.Hynes RO. Integrins: bidirectional, allosteric signaling machines. Cell. 2002;110:673–87. doi: 10.1016/s0092-8674(02)00971-6. [DOI] [PubMed] [Google Scholar]
- 5.Askari J, Buckley P, Mould A, Humphries M. Linking integrin conformation to function. J Cell Sci. 2009;122:165–70. doi: 10.1242/jcs.018556. [DOI] [PMC free article] [PubMed] [Google Scholar]
- 6.Chen J, Salas A, Springer TA. Bistable regulation of integrin adhesiveness by a bipolar metal ion cluster. Nat Struct Biol. 2003;10:995–1001. doi: 10.1038/nsb1011. [DOI] [PubMed] [Google Scholar]
- 7.Ginsberg MH, Partridge A, Shattil SJ. Integrin regulation. Curr Opin Cell Biol. 2005;17:509–16. doi: 10.1016/j.ceb.2005.08.010. [DOI] [PubMed] [Google Scholar]
- 8.Humphries J, Byron A, Humphries M. Integrin ligands at a glance. J Cell Sci. 2006;119:3901–3. doi: 10.1242/jcs.03098. [DOI] [PMC free article] [PubMed] [Google Scholar]
- 9.Evans EA, Calderwood DA. Forces and bond dynamics in cell adhesion. Science. 2007;316:1148–53. doi: 10.1126/science.1137592. [DOI] [PubMed] [Google Scholar]
- 10.Legate KR, Fassler R. Mechanisms that regulate adaptor binding to β-integrin cytoplasmic tails. J Cell Sci. 2009;122:187–98. doi: 10.1242/jcs.041624. [DOI] [PubMed] [Google Scholar]
- 11.Hynes RO. Cell-matrix adhesion in vascular development. J Thromb Haemost. 2007;5(Suppl 1):32–40. doi: 10.1111/j.1538-7836.2007.02569.x. [DOI] [PubMed] [Google Scholar]
- 12.Brakebusch C, Fassler R. β1 integrin function in vivo: adhesion, migration and more. Cancer Metastasis Rev. 2005;24:403–11. doi: 10.1007/s10555-005-5132-5. [DOI] [PubMed] [Google Scholar]
- 13.Dupuy AG, Caron E. Integrin-dependent phagocytosis: spreading from microadhesion to new concepts. J Cell Sci. 2008;121:1773–83. doi: 10.1242/jcs.018036. [DOI] [PubMed] [Google Scholar]
- 14.Aplin JD. Adhesion molecules in implantation. Rev Reprod. 1997;2:84–93. doi: 10.1530/ror.0.0020084. [DOI] [PubMed] [Google Scholar]
- 15.Petri B, Phillipson M, Kubes P. The physiology of leukocyte recruitment: an in vivo perspective. J Immunol. 2008;180:6439–46. doi: 10.4049/jimmunol.180.10.6439. [DOI] [PubMed] [Google Scholar]
- 16.Nieswandt B, Moser M, Pleines I, Varga-Szabo D, Monkley S, Critchley D, Fassler R. Loss of talin1 in platelets abrogates integrin activation, platelet aggregation, and thrombus formation in vitro and in vivo. J Exp Med. 2007;204:3113–8. doi: 10.1084/jem.20071827. [DOI] [PMC free article] [PubMed] [Google Scholar]
- 17.Takagi J, Springer TA. Integrin activation and structural rearrangement. Immunol Rev. 2002;186:141–63. doi: 10.1034/j.1600-065x.2002.18613.x. [DOI] [PubMed] [Google Scholar]
- 18.Calderwood DA, Ginsberg MH. Talin forges the links between integrins and actin. Nat Cell Biol. 2003;5:694–7. doi: 10.1038/ncb0803-694. [DOI] [PubMed] [Google Scholar]
- 19.Critchley DR. Biochemical and structural properties of the integrin-associated cytoskeletal protein talin. Annu Rev Biophys. 2009;38:235–54. doi: 10.1146/annurev.biophys.050708.133744. [DOI] [PubMed] [Google Scholar]
- 20.Moser M, Legate KR, Zent R, Fassler R. The tail of integrins, talin, and kindlins. Science. 2009;324:895–9. doi: 10.1126/science.1163865. [DOI] [PubMed] [Google Scholar]
- 21.Jiang G, Giannone G, Critchley DR, Fukumoto E, Sheetz MP. Two-piconewton slip bond between fibronectin and the cytoskeleton depends on talin. Nature. 2003;424:334–7. doi: 10.1038/nature01805. [DOI] [PubMed] [Google Scholar]
- 22.Zhang X, Jiang G, Cai Y, Monkley SJ, Critchley DR, Sheetz MP. Talin depletion reveals independence of initial cell spreading from integrin activation and traction. Nat Cell Biol. 2008;10:1062–8. doi: 10.1038/ncb1765. [DOI] [PMC free article] [PubMed] [Google Scholar]
- 23.Calderwood DA, Yan B, de Pereda JM, Alvarez BG, Fujioka Y, Liddington RC, Ginsberg MH. The phosphotyrosine binding-like domain of talin activates integrins. J Biol Chem. 2002;277:21749–58. doi: 10.1074/jbc.M111996200. [DOI] [PubMed] [Google Scholar]
- 24.Critchley DR. Cytoskeletal proteins talin and vinculin in integrin-mediated adhesion. Biochem Soc Trans. 2004;32:831–6. doi: 10.1042/BST0320831. [DOI] [PubMed] [Google Scholar]
- 25.Calderwood DA, Fujioka Y, de Pereda JM, Garcia-Alvarez B, Nakamoto T, Margolis B, McGlade CJ, Liddington RC, Ginsberg MH. Integrin β cytoplasmic domain interactions with phosphotyrosine-binding domains: a structural prototype for diversity in integrin signaling. Proc Natl Acad Sci U S A. 2003;100:2272–7. doi: 10.1073/pnas.262791999. [DOI] [PMC free article] [PubMed] [Google Scholar]
- 26.Papagrigoriou E, Gingras AR, Barsukov IL, Bate N, Fillingham IJ, Patel B, Frank R, Ziegler WH, Roberts GC, Critchley DR, Emsley J. Activation of a vinculin-binding site in the talin rod involves rearrangement of a five-helix bundle. Embo J. 2004;23:2942–51. doi: 10.1038/sj.emboj.7600285. [DOI] [PMC free article] [PubMed] [Google Scholar]
- 27.Gingras AR, Ziegler WH, Frank R, Barsukov IL, Roberts GC, Critchley DR, Emsley J. Mapping and consensus sequence identification for multiple vinculin binding sites within the talin rod. J Biol Chem. 2005;280:37217–24. doi: 10.1074/jbc.M508060200. [DOI] [PubMed] [Google Scholar]
- 28.Lee HS, Bellin RM, Walker DL, Patel B, Powers P, Liu H, Garcia-Alvarez B, de Pereda JM, Liddington RC, Volkmann N, Hanein D, Critchley DR, Robson RM. Characterization of an actin-binding site within the talin FERM domain. J Mol Biol. 2004;343:771–84. doi: 10.1016/j.jmb.2004.08.069. [DOI] [PubMed] [Google Scholar]
- 29.Gingras AR, Bate N, Goult BT, Hazelwood L, Canestrelli I, Grossmann JG, Liu H, Putz NS, Roberts GC, Volkmann N, Hanein D, Barsukov IL, Critchley DR. The structure of the C-terminal actin-binding domain of talin. Embo J. 2008;27:458–69. doi: 10.1038/sj.emboj.7601965. [DOI] [PMC free article] [PubMed] [Google Scholar]
- 30.Burridge K, Mangeat P. An interaction between vinculin and talin. Nature. 1984;308:744–6. doi: 10.1038/308744a0. [DOI] [PubMed] [Google Scholar]
- 31.Horwitz A, Duggan K, Buck C, Beckerle MC, Burridge K. Interaction of plasma membrane fibronectin receptor with talin–a transmembrane linkage. Nature. 1986;320:531–3. doi: 10.1038/320531a0. [DOI] [PubMed] [Google Scholar]
- 32.del Rio A, Perez-Jimenez R, Liu R, Roca-Cusachs P, Fernandez JM, Sheetz MP. Stretching single talin rod molecules activates vinculin binding. Science. 2009;323:638–41. doi: 10.1126/science.1162912. [DOI] [PMC free article] [PubMed] [Google Scholar]
- 33.Calderwood DA, Zent R, Grant R, Rees DJ, Hynes RO, Ginsberg MH. The Talin head domain binds to integrin β subunit cytoplasmic tails and regulates integrin activation. J Biol Chem. 1999;274:28071–4. doi: 10.1074/jbc.274.40.28071. [DOI] [PubMed] [Google Scholar]
- 34.Tadokoro S, Shattil SJ, Eto K, Tai V, Liddington RC, de Pereda JM, Ginsberg MH, Calderwood DA. Talin binding to integrin β tails: a final common step in integrin activation. Science. 2003;302:103–6. doi: 10.1126/science.1086652. [DOI] [PubMed] [Google Scholar]
- 35.Calderwood DA. Integrin activation. J Cell Sci. 2004;117:657–66. doi: 10.1242/jcs.01014. [DOI] [PubMed] [Google Scholar]
- 36.Wegener KL, Partridge AW, Han J, Pickford AR, Liddington RC, Ginsberg MH, Campbell ID. Structural basis of integrin activation by talin. Cell. 2007;128:171–82. doi: 10.1016/j.cell.2006.10.048. [DOI] [PubMed] [Google Scholar]
- 37.Czuchra A, Meyer H, Legate KR, Brakebusch C, Fassler R. Genetic analysis of beta1 integrin “activation motifs” in mice. J Cell Biol. 2006;174:889–99. doi: 10.1083/jcb.200604060. [DOI] [PMC free article] [PubMed] [Google Scholar]
- 38.Tsujioka M, Yoshida K, Nagasaki A, Yonemura S, Muller-Taubenberger A, Uyeda TQ. Overlapping functions of the two talin homologues in Dictyostelium. Eukaryot Cell. 2008;7:906–16. doi: 10.1128/EC.00464-07. [DOI] [PMC free article] [PubMed] [Google Scholar]
- 39.Tanentzapf G, Martin-Bermudo MD, Hicks MS, Brown NH. Multiple factors contribute to integrin-talin interactions in vivo. J Cell Sci. 2006;119:1632–44. doi: 10.1242/jcs.02859. [DOI] [PubMed] [Google Scholar]
- 40.Ratnikov BI, Partridge AW, Ginsberg MH. Integrin activation by talin. J Thromb Haemost. 2005;3:1783–90. doi: 10.1111/j.1538-7836.2005.01362.x. [DOI] [PubMed] [Google Scholar]
- 41.Wennerberg K, Fassler R, Warmegard B, Johansson S. Mutational analysis of the potential phosphorylation sites in the cytoplasmic domain of integrin β1A. Requirement for threonines 788–789 in receptor activation. J Cell Sci. 1998;111(Pt 8):1117–26. doi: 10.1242/jcs.111.8.1117. [DOI] [PubMed] [Google Scholar]
- 42.Yan B, Calderwood DA, Yaspan B, Ginsberg MH. Calpain cleavage promotes talin binding to the β3 integrin cytoplasmic domain. J Biol Chem. 2001;276:28164–70. doi: 10.1074/jbc.M104161200. [DOI] [PubMed] [Google Scholar]
- 43.Goksoy E, Ma YQ, Wang X, Kong X, Perera D, Plow EF, Qin J. Structural basis for the autoinhibition of talin in regulating integrin activation. Mol Cell. 2008;31:124–33. doi: 10.1016/j.molcel.2008.06.011. [DOI] [PMC free article] [PubMed] [Google Scholar]
- 44.Goult BT, Bate N, Anthis NJ, Wegener KL, Gingras AR, Patel B, Barsukov IL, Campbell ID, Roberts GC, Critchley DR. The structure of an interdomain complex that regulates talin activity. J Biol Chem. 2009;284:15097–106. doi: 10.1074/jbc.M900078200. [DOI] [PMC free article] [PubMed] [Google Scholar]
- 45.Han J, Lim CJ, Watanabe N, Soriani A, Ratnikov B, Calderwood DA, Puzon-McLaughlin W, Lafuente EM, Boussiotis VA, Shattil SJ, Ginsberg MH. Reconstructing and deconstructing agonist-induced activation of integrin αIIbβ3. Curr Biol. 2006;16:1796–806. doi: 10.1016/j.cub.2006.08.035. [DOI] [PubMed] [Google Scholar]
- 46.Lee HS, Lim CJ, Puzon-McLaughlin W, Shattil SJ, Ginsberg MH. RIAM activates integrins by linking talin to ras GTPase membrane-targeting sequences. J Biol Chem. 2009;284:5119–27. doi: 10.1074/jbc.M807117200. [DOI] [PMC free article] [PubMed] [Google Scholar]
- 47.Martel V, Racaud-Sultan C, Dupe S, Marie C, Paulhe F, Galmiche A, Block MR, Albiges-Rizo C. Conformation, localization, and integrin binding of talin depend on its interaction with phosphoinositides. J Biol Chem. 2001;276:21217–27. doi: 10.1074/jbc.M102373200. [DOI] [PubMed] [Google Scholar]
- 48.Kiema T, Lad Y, Jiang P, Oxley CL, Baldassarre M, Wegener KL, Campbell ID, Ylanne J, Calderwood DA. The molecular basis of filamin binding to integrins and competition with talin. Mol Cell. 2006;21:337–47. doi: 10.1016/j.molcel.2006.01.011. [DOI] [PubMed] [Google Scholar]
- 49.Takala H, Nurminen E, Nurmi SM, Aatonen M, Strandin T, Takatalo M, Kiema T, Gahmberg CG, Ylanne J, Fagerholm SC. β2 integrin phosphorylation on Thr758 acts as a molecular switch to regulate 14-3-3 and filamin binding. Blood. 2008;112:1853–62. doi: 10.1182/blood-2007-12-127795. [DOI] [PubMed] [Google Scholar]
- 50.Bouaouina M, Lad Y, Calderwood DA. The N-terminal domains of talin cooperate with the phosphotyrosine binding-like domain to activate beta1 and β3 integrins. J Biol Chem. 2008;283:6118–25. doi: 10.1074/jbc.M709527200. [DOI] [PubMed] [Google Scholar]
- 51.Larjava H, Plow EF, Wu C. Kindlins: essential regulators of integrin signalling and cell-matrix adhesion. EMBO Rep. 2008;9:1203–8. doi: 10.1038/embor.2008.202. [DOI] [PMC free article] [PubMed] [Google Scholar]
- 52.Ramos JW, DeSimone DW. Xenopus embryonic cell adhesion to fibronectin: position-specific activation of RGD/synergy site-dependent migratory behavior at gastrulation. J Cell Biol. 1996;134:227–40. doi: 10.1083/jcb.134.1.227. [DOI] [PMC free article] [PubMed] [Google Scholar]
- 53.O’Toole TE, Katagiri Y, Faull RJ, Peter K, Tamura R, Quaranta V, Loftus JC, Shattil SJ, Ginsberg MH. Integrin cytoplasmic domains mediate inside-out signal transduction. J Cell Biol. 1994;124:1047–59. doi: 10.1083/jcb.124.6.1047. [DOI] [PMC free article] [PubMed] [Google Scholar]
- 54.Calderwood DA, Tai V, Di Paolo G, De Camilli P, Ginsberg MH. Competition for talin results in trans-dominant inhibition of integrin activation. J Biol Chem. 2004;279:28889–95. doi: 10.1074/jbc.M402161200. [DOI] [PubMed] [Google Scholar]
- 55.Lad Y, Harburger DS, Calderwood DA. Integrin cytoskeletal interactions. Methods Enzymol. 2007;426:69–84. doi: 10.1016/S0076-6879(07)26004-5. [DOI] [PubMed] [Google Scholar]
- 56.Pfaff M, Liu S, Erle DJ, Ginsberg MH. Integrin β cytoplasmic domains differentially bind to cytoskeletal proteins. J Biol Chem. 1998;273:6104–9. doi: 10.1074/jbc.273.11.6104. [DOI] [PubMed] [Google Scholar]
- 57.Garcia-Alvarez B, de Pereda JM, Calderwood DA, Ulmer TS, Critchley D, Campbell ID, Ginsberg MH, Liddington RC. Structural determinants of integrin recognition by talin. Mol Cell. 2003;11:49–58. doi: 10.1016/s1097-2765(02)00823-7. [DOI] [PubMed] [Google Scholar]
- 58.Matter ML, Ginsberg MH, Ramos JW. Identification of cell signaling molecules by expression cloning. Sci STKE. 2001;2001:PL9. doi: 10.1126/stke.2001.103.pl9. [DOI] [PubMed] [Google Scholar]
- 59.Harburger DS, Bouaouina M, Calderwood DA. Kindlin-1 and -2 directly bind the C-terminal region of β integrin cytoplasmic tails and exert integrin-specific activation effects. J Biol Chem. 2009;284:11485–97. doi: 10.1074/jbc.M809233200. [DOI] [PMC free article] [PubMed] [Google Scholar]
- 60.Moser M, Nieswandt B, Ussar S, Pozgajova M, Fassler R. Kindlin-3 is essential for integrin activation and platelet aggregation. Nat Med. 2008;14:325–30. doi: 10.1038/nm1722. [DOI] [PubMed] [Google Scholar]
- 61.Ma YQ, Qin J, Wu C, Plow EF. Kindlin-2 (Mig-2): a co-activator of β3 integrins. J Cell Biol. 2008;181:439–46. doi: 10.1083/jcb.200710196. [DOI] [PMC free article] [PubMed] [Google Scholar]
- 62.Stewart MP, Cabanas C, Hogg N. T cell adhesion to intercellular adhesion molecule-1 (ICAM-1) is controlled by cell spreading and the activation of integrin LFA-1. J Immunol. 1996;156:1810–7. [PubMed] [Google Scholar]
- 63.Ginsberg MH, Frelinger AL, Lam SC, Forsyth J, McMillan R, Plow EF, Shattil SJ. Analysis of platelet aggregation disorders based on flow cytometric analysis of membrane glycoprotein IIb-IIIa with conformation-specific monoclonal antibodies. Blood. 1990;76:2017–23. [PubMed] [Google Scholar]
- 64.Stallmach A, Giese T, Pfister K, Wittig BM, Kunne S, Humphries M, Zeitz M, Meuer SC. Activation of β1 integrins mediates proliferation and inhibits apoptosis of intestinal CD4-positive lymphocytes. Eur J Immunol. 2001;31:1228–38. doi: 10.1002/1521-4141(200104)31:4<1228::aid-immu1228>3.0.co;2-k. [DOI] [PubMed] [Google Scholar]
- 65.Heilmann E, Hynes LA, Burstein SA, George JN, Dale GL. Fluorescein derivatization of fibrinogen for flow cytometric analysis of fibrinogen binding to platelets. Cytometry. 1994;17:287–93. doi: 10.1002/cyto.990170403. [DOI] [PubMed] [Google Scholar]
- 66.Shattil SJ, Cunningham M, Hoxie JA. Detection of activated platelets in whole blood using activation-dependent monoclonal antibodies and flow cytometry. Blood. 1987;70:307–15. [PubMed] [Google Scholar]
- 67.Dransfield I, Hogg N. Regulated expression of Mg2+ binding epitope on leukocyte integrin α subunits. Embo J. 1989;8:3759–65. doi: 10.1002/j.1460-2075.1989.tb08552.x. [DOI] [PMC free article] [PubMed] [Google Scholar]
- 68.Luque A, Gomez M, Puzon W, Takada Y, Sanchez-Madrid F, Cabanas C. Activated conformations of very late activation integrins detected by a group of antibodies (HUTS) specific for a novel regulatory region (355-425) of the common β1 chain. J Biol Chem. 1996;271:11067–75. doi: 10.1074/jbc.271.19.11067. [DOI] [PubMed] [Google Scholar]
- 69.Taub R, Gould RJ, Garsky VM, Ciccarone TM, Hoxie J, Friedman PA, Shattil SJ. A monoclonal antibody against the platelet fibrinogen receptor contains a sequence that mimics a receptor recognition domain in fibrinogen. J Biol Chem. 1989;264:259–65. [PubMed] [Google Scholar]
- 70.Shattil SJ, Hoxie JA, Cunningham M, Brass LF. Changes in the platelet membrane glycoprotein IIb.IIIa complex during platelet activation. J Biol Chem. 1985;260:11107–14. [PubMed] [Google Scholar]
- 71.Shattil SJ, Motulsky HJ, Insel PA, Flaherty L, Brass LF. Expression of fibrinogen receptors during activation and subsequent desensitization of human platelets by epinephrine. Blood. 1986;68:1224–31. [PubMed] [Google Scholar]
- 72.Pampori N, Hato T, Stupack DG, Aidoudi S, Cheresh DA, Nemerow GR, Shattil SJ. Mechanisms and consequences of affinity modulation of integrin αVβ3 detected with a novel patch-engineered monovalent ligand. J Biol Chem. 1999;274:21609–16. doi: 10.1074/jbc.274.31.21609. [DOI] [PubMed] [Google Scholar]
- 73.Bertoni A, Tadokoro S, Eto K, Pampori N, Parise LV, White GC, Shattil SJ. Relationships between Rap1b, affinity modulation of integrin αIIbβ3, and the actin cytoskeleton. J Biol Chem. 2002;277:25715–21. doi: 10.1074/jbc.M202791200. [DOI] [PubMed] [Google Scholar]
- 74.Bunch TA, Helsten TL, Kendall TL, Shirahatti N, Mahadevan D, Shattil SJ, Brower DL. Amino acid changes in Drosophila αPS2βPS integrins that affect ligand affinity. J Biol Chem. 2006;281:5050–7. doi: 10.1074/jbc.M508550200. [DOI] [PubMed] [Google Scholar]
- 75.Kashiwagi H, Tomiyama Y, Tadokoro S, Honda S, Shiraga M, Mizutani H, Handa M, Kurata Y, Matsuzawa Y, Shattil SJ. A mutation in the extracellular cysteine-rich repeat region of the β3 subunit activates integrins αIIbβ3 and αVβ3. Blood. 1999;93:2559–68. [PubMed] [Google Scholar]
- 76.Montanez E, Ussar S, Schifferer M, Bosl M, Zent R, Moser M, Fassler R. Kindlin-2 controls bidirectional signaling of integrins. Genes Dev. 2008;22:1325–30. doi: 10.1101/gad.469408. [DOI] [PMC free article] [PubMed] [Google Scholar]
- 77.Chan JR, Hyduk SJ, Cybulsky MI. Chemoattractants induce a rapid and transient upregulation of monocyte α4 integrin affinity for vascular cell adhesion molecule 1 which mediates arrest: an early step in the process of emigration. J Exp Med. 2001;193:1149–58. doi: 10.1084/jem.193.10.1149. [DOI] [PMC free article] [PubMed] [Google Scholar]
- 78.Chan JR, Hyduk SJ, Cybulsky MI. Detecting rapid and transient upregulation of leukocyte integrin affinity induced by chemokines and chemoattractants. J Immunol Methods. 2003;273:43–52. doi: 10.1016/s0022-1759(02)00417-9. [DOI] [PubMed] [Google Scholar]
- 79.Weber KS, Ostermann G, Zernecke A, Schroder A, Klickstein LB, Weber C. Dual role of H-Ras in regulation of lymphocyte function antigen-1 activity by stromal cell-derived factor-1α: implications for leukocyte transmigration. Mol Biol Cell. 2001;12:3074–86. doi: 10.1091/mbc.12.10.3074. [DOI] [PMC free article] [PubMed] [Google Scholar]
- 80.Hughes PE, Oertli B, Hansen M, Chou FL, Willumsen BM, Ginsberg MH. Suppression of integrin activation by activated Ras or Raf does not correlate with bulk activation of ERK MAP kinase. Mol Biol Cell. 2002;13:2256–65. doi: 10.1091/mbc.01-10-0480. [DOI] [PMC free article] [PubMed] [Google Scholar]
- 81.Bowditch RD, Hariharan M, Tominna EF, Smith JW, Yamada KM, Getzoff ED, Ginsberg MH. Identification of a novel integrin binding site in fibronectin. Differential utilization by β3 integrins. J Biol Chem. 1994;269:10856–63. [PubMed] [Google Scholar]
- 82.Heckmann D, Meyer A, Marinelli L, Zahn G, Stragies R, Kessler H. Probing integrin selectivity: rational design of highly active and selective ligands for the α5β1 and αvβ3 integrin receptor. Angew Chem Int Ed Engl. 2007;46:3571–4. doi: 10.1002/anie.200700008. [DOI] [PubMed] [Google Scholar]
- 83.O’Toole TE, Ylanne J, Culley BM. Regulation of integrin affinity states through an NPXY motif in the β subunit cytoplasmic domain. J Biol Chem. 1995;270:8553–8. doi: 10.1074/jbc.270.15.8553. [DOI] [PubMed] [Google Scholar]
- 84.Kouns WC, Kirchhofer D, Hadvary P, Edenhofer A, Weller T, Pfenninger G, Baumgartner HR, Jennings LK, Steiner B. Reversible conformational changes induced in glycoprotein IIb-IIIa by a potent and selective peptidomimetic inhibitor. Blood. 1992;80:2539–47. [PubMed] [Google Scholar]
- 85.Abrams C, Deng YJ, Steiner B, O’Toole T, Shattil SJ. Determinants of specificity of a baculovirus-expressed antibody Fab fragment that binds selectively to the activated form of integrin αIIbβ3. J Biol Chem. 1994;269:18781–8. [PubMed] [Google Scholar]
- 86.Bouaouina M, Blouin E, Halbwachs-Mecarelli L, Lesavre P, Rieu P. TNF-induced β2 integrin activation involves Src kinases and a redox-regulated activation of p38 MAPK. J Immunol. 2004;173:1313–20. doi: 10.4049/jimmunol.173.2.1313. [DOI] [PubMed] [Google Scholar]
- 87.Rose DM, Liu S, Woodside DG, Han J, Schlaepfer DD, Ginsberg MH. Paxillin binding to the α4 integrin subunit stimulates LFA-1 (integrin αLβ2)-dependent T cell migration by augmenting the activation of focal adhesion kinase/proline-rich tyrosine kinase-2. J Immunol. 2003;170:5912–8. doi: 10.4049/jimmunol.170.12.5912. [DOI] [PubMed] [Google Scholar]
- 88.Eto K, Leavitt AL, Nakano T, Shattil SJ. Development and analysis of megakaryocytes from murine embryonic stem cells. Methods Enzymol. 2003;365:142–58. doi: 10.1016/s0076-6879(03)65010-x. [DOI] [PubMed] [Google Scholar]
- 89.Shiraga M, Ritchie A, Aidoudi S, Baron V, Wilcox D, White G, Ybarrondo B, Murphy G, Leavitt A, Shattil S. Primary megakaryocytes reveal a role for transcription factor NF-E2 in integrin αIIbβ3 signaling. J Cell Biol. 1999;147:1419–30. doi: 10.1083/jcb.147.7.1419. [DOI] [PMC free article] [PubMed] [Google Scholar]
- 90.Kashiwagi H, Shiraga M, Honda S, Kosugi S, Kamae T, Kato H, Kurata Y, Tomiyama Y. Activation of integrin αIIbβ3 in the glycoprotein Ib-high population of a megakaryocytic cell line, CMK, by inside-out signaling. J Thromb Haemost. 2004;2:177–86. doi: 10.1111/j.1538-7836.2003.00529.x. [DOI] [PubMed] [Google Scholar]
- 91.O’Toole TE, Loftus JC, Du XP, Glass AA, Ruggeri ZM, Shattil SJ, Plow EF, Ginsberg MH. Affinity modulation of the αIIbβ3 integrin (platelet GPIIb-IIIa) is an intrinsic property of the receptor. Cell Regul. 1990;1:883–93. doi: 10.1091/mbc.1.12.883. [DOI] [PMC free article] [PubMed] [Google Scholar]
- 92.Harper PA, Juliano RL. Fibronectin-independent adhesion of fibroblasts to the extracellular matrix: mediation by a high molecular weight membrane glycoprotein. J Cell Biol. 1981;91:647–53. doi: 10.1083/jcb.91.3.647. [DOI] [PMC free article] [PubMed] [Google Scholar]
- 93.Calderwood DA, Huttenlocher A, Kiosses WB, Rose DM, Woodside DG, Schwartz MA, Ginsberg MH. Increased filamin binding to β-integrin cytoplasmic domains inhibits cell migration. Nat Cell Biol. 2001;3:1060–8. doi: 10.1038/ncb1201-1060. [DOI] [PubMed] [Google Scholar]
- 94.Prevost N, Kato H, Bodin L, Shattil SJ. Platelet integrin adhesive functions and signaling. Methods Enzymol. 2007;426:103–15. doi: 10.1016/S0076-6879(07)26006-9. [DOI] [PubMed] [Google Scholar]
- 95.Brown PJ, Juliano RL. Selective inhibition of fibronectin-mediated cell adhesion by monoclonal antibodies to a cell-surface glycoprotein. Science. 1985;228:1448–51. doi: 10.1126/science.4012302. [DOI] [PubMed] [Google Scholar]
- 96.Chou FL, Hill JM, Hsieh JC, Pouyssegur J, Brunet A, Glading A, Uberall F, Ramos JW, Werner MH, Ginsberg MH. PEA-15 binding to ERK1/2 MAPKs is required for its modulation of integrin activation. J Biol Chem. 2003;278:52587–97. doi: 10.1074/jbc.M309322200. [DOI] [PubMed] [Google Scholar]
- 97.Ramos JW, Kojima TK, Hughes PE, Fenczik CA, Ginsberg MH. The death effector domain of PEA-15 is involved in its regulation of integrin activation. J Biol Chem. 1998;273:33897–900. doi: 10.1074/jbc.273.51.33897. [DOI] [PubMed] [Google Scholar]
- 98.Goult BT, Bouaouina M, Harburger DS, Bate N, Patel B, Anthis NJ, Campbell ID, Calderwood DA, Barsukov IL, Roberts GC, Critchley DR. The structure of the N-terminus of kindlin-1: A domain important for αIIbβ3 integrin activation. J Mol Biol. 2009 doi: 10.1016/j.jmb.2009.09.061. [DOI] [PMC free article] [PubMed] [Google Scholar]