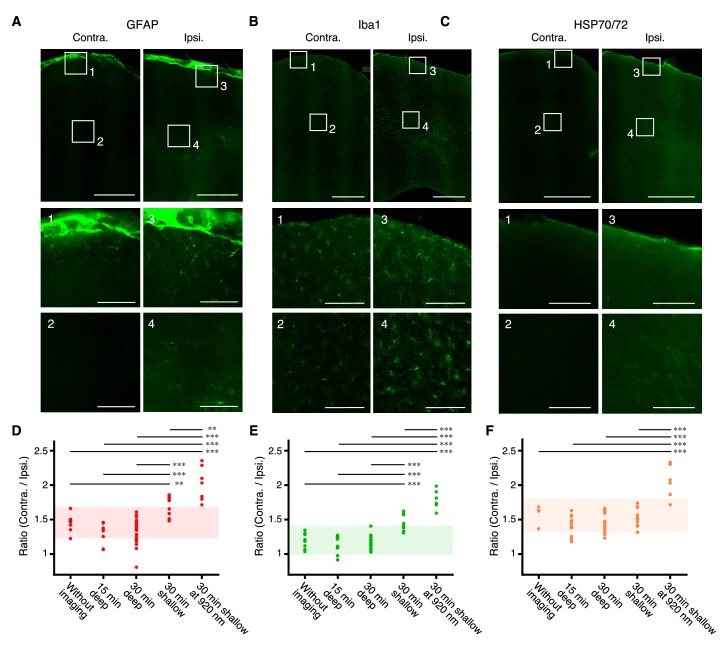
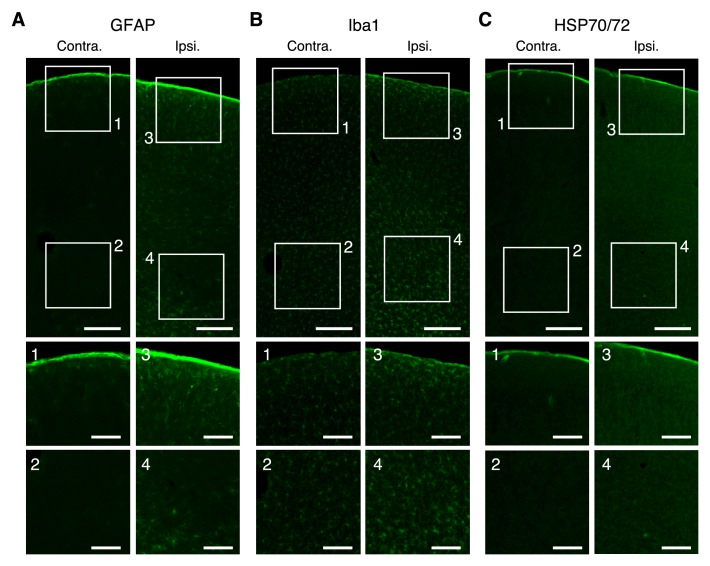
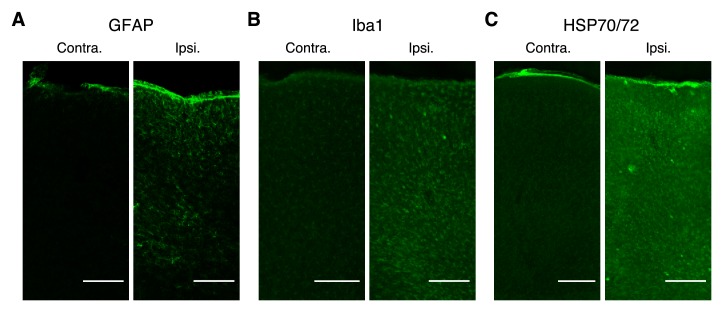
Figure 3. Immunoreactivity after deep imaging of the medial frontal cortex.
(A–C) Top, representative expression of GFAP (A), Iba1 (B), and HSP70/72 (C) in contralateral (left) and imaged (right) hemispheres. Scale bar, 500 µm. Middle and bottom, expanded images of the numbered boxes, including the cortical surface (middle) and imaging sites (bottom). Scale bar, 100 µm. (D–F) Ratios of expression intensity for GFAP (D), Iba1 (E), and HSP70/72 (F) in the AAV-injected hemisphere compared with the contralateral hemisphere. Each dot indicates the ratio in each slice that included both hemispheres. Without imaging: mice with only AAV injections and cranial windows (10 slices from two mice as a negative control for GFAP and Iba1; four slices from one mouse as a negative control for HSP70/72). 15 min and 30 min deep: after 15-min imaging at 800–900 µm depths (eight slices from two mice for GFAP; 10 slices from two mice for Iba1; 15 slices from two mice for HSP70/72) and after 30-min imaging at 900–1100 µm depths (21 slices from four mice for GFAP; 21 slices from four mice for Iba1; 12 slices from two mice for HSP70/72), respectively; 30 min shallow: after 30 min imaging at 300–400 µm depths (eight slices from two mice for GFAP; 10 slices from two mice for Iba1; 10 slices from two mice for HSP70/72); 30 min shallow at 920 nm: after 30-min imaging at 200–300 µm depths (overfilled with 200 mW, 920 nm laser in the slow scanning mode) (seven slices from two mice for GFAP; six slices from two mice for Iba1; six slices from two mice for HSP70/72). Shaded areas indicate the mean ±2 s.d. of the immunoreactivity in the negative control experiment. Horizontal bars indicate significant differences (**: p<0.01,***: p<0.001, one-way ANOVA with Tukey-Kramer method for post-hoc multiple comparisons, see Figure 3—source data 1). Pairs without bar were not significantly different (see Figure 3—source data 1).


