Abstract
Ultrasound elasticity imaging has demonstrated utility in breast imaging, but it is typically performed with handheld transducers and two-dimensional imaging. Two-dimensional (2D) elastography images tissue stiffness of only a plane and hence suffers from errors due to out-of-plane motion, whereas three-dimensional (3D) data acquisition and motion tracking can be used to track out-of-plane motion that is lost in 2D elastography systems. A commercially-available automated breast volume scanning system that acquires 3D ultrasound data with precisely controlled elevational movement of the 1D array ultrasound transducer was employed in this study. A hybrid, guided 3D motion tracking algorithm was developed that first estimated the displacements in one plane using a modified quality-guided search method, and then performed an elevational guided-search for displacement estimation in adjacent planes. To assess the performance of the method, 3D radiofrequency echo data were acquired with this system from a phantom and from an in vivo human breast. For both experiments, the axial displacement fields were smooth and high cross-correlation coefficients were obtained in most of the tracking region. The motion tracking performance of the new method was compared with a correlation-based exhaustive search method on six consecutive volumes (five consecutive volume pairs) of radiofrequency echo data acquired during in vivo scanning of the breast of one subject. For all five motion tracking volume pairs, the average motion-compensated cross-correlation values (between pre-deformation and motion-compensated post-deformation echo fields) obtained by the guided-search motion tracking method were equivalent to those by the exhaustive search method, and the computation time was about a factor of 10 less. Therefore, the proposed 3D ultrasound elasticity imaging method was a more efficient approach to produce a high quality of 3D ultrasound strain image.
Keywords: elasticity imaging, motion tracking, displacement estimation, 3D elastography, 3D strain
Introduction
Elastography can noninvasively reveal variations in tissue elasticity and is increasingly being employed in clinical breast imaging.1 Mammography is the main imaging modality for breast cancer screening and ultrasonography is often used for follow-up.2 Mammography performs poorly in dense breast, however, and even when combined with ultrasonography, has relatively poor specificity.3 As a result, many patients who have benign lesions undergo biopsy which increases anxiety, pain, and cost.4,5 Breast elastography, as an adjunct for conventional B-mode ultrasound imaging, provides higher specificity for breast cancer diagnosis and could reduce the rate of benign biopsy.6
The promise of elastography to aid in diagnosis of breast tumors was initially reported in 1997.7 Currently, two breast elasticity imaging techniques are available in clinical ultrasound systems: strain elastography and shear wave elastography.2 In typical strain elastography, the tissue is deformed by freehand compression with the transducer along the direction of the acoustic beams.8 The stress applied to the tissue is usually unknown, with notable exceptions,9,10 so strain elastography typically provides qualitative elasticity information. In shear wave elastography, an acoustic radiation force impulse (ARFI) is employed to remotely deform the tissue, initiating the propagation of a shear wave, and the shear wave speed is displayed in an image. 11–13 (The square of the shear wave speed is proportional to Young’s modulus under idealized conditions. Specifically, the simple conversion from shear wave speed to shear modulus assumes the region of interest is large compared to the shear wavelength, that measurements are performed well away from material boundaries, the material is homogeneous, isotropic, linearly-elastic with purely elastic response to deformation.) For shear wave elastography of the breast, a threshold shear wave speed can separate malignant lesions from benign lesions,14,15 but those shear wave speed estimates and the decision thresholds are system-dependent.
Many manufacturers of ultrasound machines provide real-time two-dimensional (2D) strain elastography. Most studies reporting strain imaging have used 2D images,16 although there are notable exceptions.16–20 2D elastography is limited by its inability to track motion out of the scan plane. 2D elastography can be used to track displacements only in the axial (the direction of the propagating acoustic beam) and lateral (cross-beam) directions. As a result, 2D motion tracking is subject to decorrelation error caused by motion out of the image plane, since the tissue deforms in 3D (including the elevational direction), even though the applied deformation is mainly in the axial direction. Tracking the out-of-plane elevational motion requires imaging in 3D.
There are several techniques to acquire 3D (volume) ultrasound data. A high-frequency 2D array transducer (with electronic beam steering) allows a fast volume data acquisition rate. But 2D arrays suitable for breast imaging are difficult to manufacture and are not widely available.17 Commercially-available approaches require translation of a linear 1D array in the elevation direction, controlled by either freehand or a stepper motor.20–22 Uniform spatial sampling cannot be guaranteed with the freehand technique, but stepper motor control of the transducer sweep can be used to reproducibly obtain volume ultrasound data. In the work reported here, the ultrasound data acquisition system was a modified, commercially-available whole breast ultrasound system with both axial compression motion and elevational movement of a 1D array ultrasound transducer controlled by motors.
Motion tracking is critical for elasticity imaging. Most displacement tracking algorithms employ a metric analogous to normalized cross-correlation between the pre-deformation and post-deformation signals as the similarity metric and determines the displacement by searching for the maximum correlation.8 An exhaustive search method with normalized cross-correlation as the similarity metric generates huge computational expense and is therefore not well-suited for processing the large 3D datasets. A guided-search method can significantly reduce computational expense and minimize large displacement estimate errors.23–26 The motion tracking method employed in this paper is a modified guided-search method designed for tracking motion in 3D ultrasound radiofrequency (RF) echo data. The displacements were determined by a modified quality-guided search method we call a “2D region growing displacement estimation method”.
Many 3D motion tracking algorithms have been assessed using only simulation or phantom data. Experience with in vivo imaging, however, indicates that both those tests significantly underestimate the challenges associated with clinical breast data.16–22 The 3D motion tracking method reported here was tested using echo data from the whole breast ultrasound system on a phantom and in vivo human breast.
The current implementation of this motion tracking algorithm performs offline analysis of the 3D data and is not intended to display strain images in real-time. However, compared with 2D elastography, 3D elastography can track out-of-plane motion, provide a more complete view of the elastic information of the lesion, and should improve the accuracy in locating and diagnosing the breast abnormalities.
Method
A. Ultrasound data acquisition system
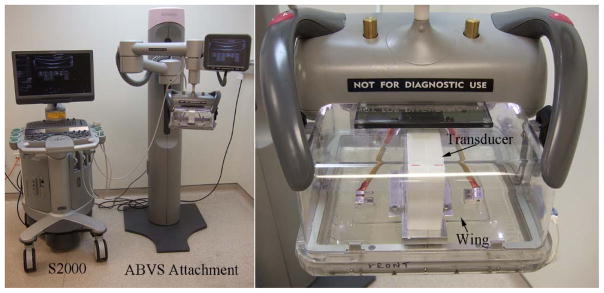
A Siemens Acuson S2000 automated breast volume scanning system (ABVS) was used to acquire volumetric ultrasound RF echo data in this study. As shown in figure 1, the system consists of two parts, a Siemens S2000 ultrasound system and the ABVS attachment. The ABVS is composed of a support tower, an arm, and a transducer pod assembly containing a 15cm long, 768-element 1D array ultrasound transducer (14L5BV). The transducer excitation frequency was set to 11MHz. Elevational transducer motion was controlled by a motor inside the pod assembly that sweeps the transducer in the elevational direction within the pod.
Figure 1.
Volumetric ultrasound data acquisition system consisting of a Siemens S2000 ultrasound system and the automated breast volume scanning subsystem. The ultrasound transducer moves in the elevational direction inside the ABVS transducer pod (right image). To keep the membrane on the transducer side as flat as possible, “wings” (plates) were attached to each side of the transducer that were designed to increase the uniformity of the pressure applied on the membrane by the transducer. The addition of these plates limited the elevation travel of the transducer and necessitated metal stops on the motor travel path. The ABVS arm can move up or down vertically to exert vertical force. Motion of the arm and the transducer are controlled with software scripts.
The commercial system uses an open-mesh screen that couples the transducer to the breast. In this study, that screen assembly was replaced with a compliant, fluid-filled coupling bag. The liquid in the coupling bag for this study was canola oil. “Wings” were attached to the transducer face (see figure 1) to extend the flat scanning surface in the elevational direction. The wings limit the elevational scanning range (but provide a flat reference surface for eventual elastic modulus reconstructions). A motor in the tower was added to lift or lower counterweights which offset the weight of the arm and transducer pod assembly, thus allowing the arm to move vertically (up or down) and apply or release vertical load on the breast. The S2000 was programmed to control the motion of the counterweights (and therefore the arm) and transducer pod. The maximum range for 3D scanning for a single volume with the modified system was 6cm ×15cm × 18cm (axial × lateral × elevational).
Data were acquired using the AXIUS Direct ultrasound research interface27 to obtain radiofrequency echo data sampled at 40 MHz for each scan line in the 3D volume. Data were stored on the S2000 imaging system and downloaded for offline analysis. The electronic signal to noise ratio (SNR) of the echo signal was estimated by the Thomoson’s multitaper method28 to verify that the SNR exceeded 30dB (well above the lower limit for low displacement estimate variance).29
The echo signal correlation cell size and its spatial sampling (beam spacing) for this imaging system were characterized for the purposes of optimizing motion tracking kernel sizes. The selection of the size of correlation kernel was based on several of our previous publications23–26. The size of the motion tracking kernel for guided-search block matching algorithms involves a tradeoff – large kernels can provide unique data matching; small kernels are more computational efficient and minimize decorrelation within the post-deformation match to the tracking kernel. It is also necessary that adjacent spatial samples of the RF echo field are highly correlated so that an accurate estimate of motion at one location is highly correlated with the RF echo data at its adjacent locations and therefore provides a good prediction of motion in its immediate neighborhood (thus allowing a reduction in the search region size)23–25.
B. Displacement tracking algorithm
The ultrasound volume data was acquired both before and after tissue deformation. Displacement estimation was then performed using the pre- and post-deformation 3D RF echo signal data. In this study, the displacement tracking algorithm was designed to estimate displacements of all points on a 3D grid (corresponding to sparsely sampled locations in the RF echo field) within the region of interest (ROI). The displacement estimate sampling has been discussed in a prior publication23. The 3D displacements were estimated (echo data) plane by plane. We used the coordinate system of the pre-deformation RF echo data and found the location where tracking kernels had moved to in the post-deformation RF echo field to obtain displacement estimates. 3D displacement was first estimated for a single plane of echo signal data in the pre-deformation field, and those estimates were used to guide displacement estimation in the adjacent plane. This 3D grid represented the location of centers of small 3D patches of RF echo data (tracking kernels) in the pre-deformation field, and the task was to determine the location where those kernels moved to in the post-deformation field. The difference in those locations for an individual tracking kernel was the estimated displacement for that kernel.
Displacement estimation in this algorithm was a 4-step process. First, following the methods described by Chen, et al.25, and Jiang, et al.26, displacement estimate candidate “seeds” were established as a sparse subset of the 3D grid within the ROI on which the displacements were to be estimated. A method (see Appendix A.1) was used to estimate displacement at each of these seed points and select which displacement estimates among this set of seeds were of sufficiently high quality to be trusted25,26 (and thus become the set of ‘trusted seed points’). Second, a method (see Appendix A.2) was used to select the starting plane of RF echo data within the 3D volume to begin motion tracking. The choice can be arbitrary, such as selecting the central plane of data, or an algorithm can be used to select the plane. Third, displacement was estimated at all remaining grid points in the current plane using a region-growing algorithm (see Appendix A.3). Fourth, displacement of the grid points of the next (adjacent) plane were estimated by using the high-quality displacement estimates in the previous plane along with any trusted seed point that might be in the (now) current plane to guide the block-matching search in that plane (see Appendix A.4).
The full description of region growing motion tracking method (RGMT) is given in the Appendix A.
C. Materials
To determine the echo signal correlation cell size and its spatial sampling (beam spacing) for this imaging system, we computed the 3D autocorrelation of RF echo signals from a uniform phantom that produces diffuse scattering from tiny glass beads (3000E beads; nominally 5–20 μm diameter; Potters Industries, Malvern, PA). The sound speed in the phantom was independently measured30 to be approximately 1517 m/s (comparable to breast tissue31). Figure 2 shows plots of the axial, lateral, and elevational autocorrelation coefficients.
Figure 2.
The measured autocorrelation function for the ABVS systems obtained by scanning a phantom for the (a) axial, (b) lateral, and (c) elevational directions. The full widths at the half maximum of each autocorrelation function are 0.2mm, 0.7mm and 1.4mm, in the axial, lateral, and elevational directions, respectively.
To evaluate the performance of the 2D region growing motion tracking algorithm, a simple layered phantom was made, as layered media and heterogeneity in tumors are commonly found in breast imaging.32–34 The phantom was a 4.7cm cube with a 1cm diameter low (stiffness) contrast spherical inclusion. The phantom was manufactured by first casting the spherical inclusion and allowing it to congeal and then casting the lower half of the background with an indentation in it to house (half of) the spherical inclusion. A thin layer of gel was poured into the indentation, the sphere was inserted, and the upper half of the background was poured to bond to the sphere and the opposing half of the background. The composition of the phantom is described in Table 1. To test the stiffness of different layers of the phantom, acoustic radiation force impulse (ARFI) imaging was performed in situ on the phantom with Siemens ACUSON S3000 Ultrasound System. The shear wave speeds (SWS) of the upper background, the inclusion and the lower background are 3.25, 3.03 and 2.40 m/s, respectively, corresponding to shear moduli of 10.2, 8.8, and 5.5kPa (the density of background and inclusion are about 1.04 g/cm3).
Table 1.
The composition of each component of the nonlinear elastic phantom used in this study. Molten agar (1g/100mL of deionized water) was mixed with 200 Bloom gelatin (16g/100mL water) in a ratio of 3 parts agar solution to 2 parts gelatin solution. Formaldehyde was added (per table values) to cross link the gelatin and raise the melting point.44 Safflower oil was added to the sphere to reduce its elastic modulus while maintaining its gel concentrations.45
| Agar (wt.%) | Gelatin (wt.%) | Formaldehyde (wt.%) | Agar/Gelation Volume Ratio | Safflower Oil Volume Ratio | |
|---|---|---|---|---|---|
| Background Layer 1 | 1% | 16% | 0.3% | 3:2 | 0 |
| Background Layer 2 | 1% | 16% | 0.03% | 3:2 | 0 |
| Sphere | 1% | 16% | 0.3% | 3:2 | 50% |
A 3D region (5.5cm×7.6cm×3.9cm; larger than the phantom to allow for slipping and transverse expansion) was scanned with the ABVS, resulting in 2856×512×230 RF echo samples separated by 0.02mm, 0.15mm and 0.17mm in the axial, lateral, and elevational directions, respectively. The ABVS arm was set to raise the counterweight 0.5 mm after each volume scan, generating the axial deformation to the phantom. Twenty volumes of RF echo data were acquired. Motion tracking was performed from volumes 7 to 9, skipping one volume, to generate a strain of approximate 2%. The desire for approximately 2% frame- (or volume-) average strain is based on optimization from previous studies in strain imaging.23,35
An in vivo human breast was also scanned. The human study was approved by the Health Sciences Institutional Review Board at the University of Wisconsin and was compliant with the Health Insurance Portability and Accountability Act of 1996. The subject was recruited from a pool of subjects scheduled for core biopsy based on mammography and ultrasound findings suggesting a BIRADS classification of 4b or higher. The subject was placed in the supine position on a general purpose scanning bed. Her breast was coated with a thin layer of low-viscosity ultrasound coupling gel, and the same gel was used to coat the contact surface of the compliant standoff bag. The scanning pod was then placed over her breast and lowered (as done with the clinical system) until the bag was well-coupled to the breast. A test sweep of the transducer was performed to determine if there was good coupling between the breast and the bag, so that there was no trapped air, and the volume was centered over the breast mass. A step-wise compression was applied. The subject was asked to hold her breath during each volume scan which took about 16 seconds to complete. Between volumes the motor in the tower raised the counterweights and this, in turn, increased the downward force on the breast to generate the average strain in the breast by about 1%. A 3D region of 6.0cm×7.6cm×3.1cm was scanned each step, resulting in 3116×512×180 RF samples separated by 0.02, 0.15 and 0.17mm, in the axial, lateral, and elevational directions, respectively. A total of 35 volumes of RF echo data were acquired for this subject. After the scan sequence was complete, data were downloaded from the imaging system for off-line analysis which included forming B-mode images for each scan volume. Motion tracking was performed separately on 5 consecutive volume pairs, from volumes 13 to 18.
D. The exhaustive normalized cross-correlation search
For comparison, a simple exhaustive-search motion tracking method (ESMT) was used to determine the displacement of every grid point in the ROI using a large search region and normalized cross-correlation as the metric for displacement estimation8, 36. Motion-compensated cross-correlation between the pre-deformation RF echo field (entire 3D ROI) and the corresponding motion-compensated post-deformation RF field was used to compare the performance of the two tracking methods37.
E. Tests of motion tracking performance
In the phantom experiment, a 1.8cm×2.8cm×1.6cm (axial×lateral×elevational) rectangular area around the inclusion was selected as the ROI for the displacement tracking. The motion-tracking grid points were sampled in this area with intervals of 8×1×1 RF samples (tracking kernels at every eighth axial sample and in every A-line and image plane). The middle plane was selected as the initial plane for displacement estimation. The seed candidate center points were separated by 5 points in both axial and lateral directions. In the initial plane, the threshold of maximum cross correlation sum (see Appendix A) to accept the trusted seeds were set to 0.75×5 and the maximum absolute displacement difference (see Appendix A) threshold in axial, lateral and elevational directions were all set to 1 RF sample. The same thresholds were employed for the elevational guiding point acceptance criteria. The correlation threshold to accept the trusted seeds in adjacent plane was set to 0.8. The tracking kernel size for both the seed selection and the region-growing were 15×3x3 RF samples. The search region for seed selection and region growing were 31×7×7 and 1×1×1 RF samples, respectively.
The exhaustive search motion tracking method was performed on the same data using the same volume pairs and tracking ROI. The tracking kernel was 15×3×3 RF samples (the same as used in the region-growing method), and the search region was 31×7x7 RF samples (the same as the seed selection for the region-growing method).
In the in vivo human experiment, to save computation time, a small rectangular area surrounding the identified lesion was selected as the ROI for motion tracking and strain image formation. The tracking ROI was 1.5cm×3.4cm×1.3cm (axial×lateral×elevational) with motion-tracking grid points separated by 8×1×1 RF samples. The ‘trusted seed’ and ‘guiding point’ acceptance criteria for the initial plane were the same as the phantom experiment. The correlation threshold to accept the trusted seeds in adjacent planes was set to 0.75. The tracking kernel size for seed selection and region-growing were 15×3×3 RF samples (the same as that used in the phantom study). The search region for seed selection and region growing were 41×11×11 RF samples (somewhat larger than that used in the phantom study) and 1×1×1 RF samples, respectively.
The exhaustive search motion tracking method was performed on the same data using the same volume pairs and tracking ROI. The tracking kernel was 15×3×3 RF samples (the same as the region growing), and the search region was 41×11×11 RF samples (the same as the initial seed selection).
To explore the impact of elevational information on the motion tracking results, region growing motion tracking without using elevational information was performed on the same human data using the same volume pairs and tracking ROI. The elevational displacement was forced to be zero. A 2D axial-lateral correlation was used, and the search region was also forced to be in the axial-lateral plane for both seed selection and region growing. Except for removing elevational information, other tracking parameters were all the same as the above-mentioned RGMT with elevational information.
Both the region growing and the exhaustive search methods were written in C++ and called from Matlab via the MEX function. Both algorithms were executed on a computer with an Intel Core i7-4790K CPU and 32GB memory.
Results
A. Result for the phantom experiment
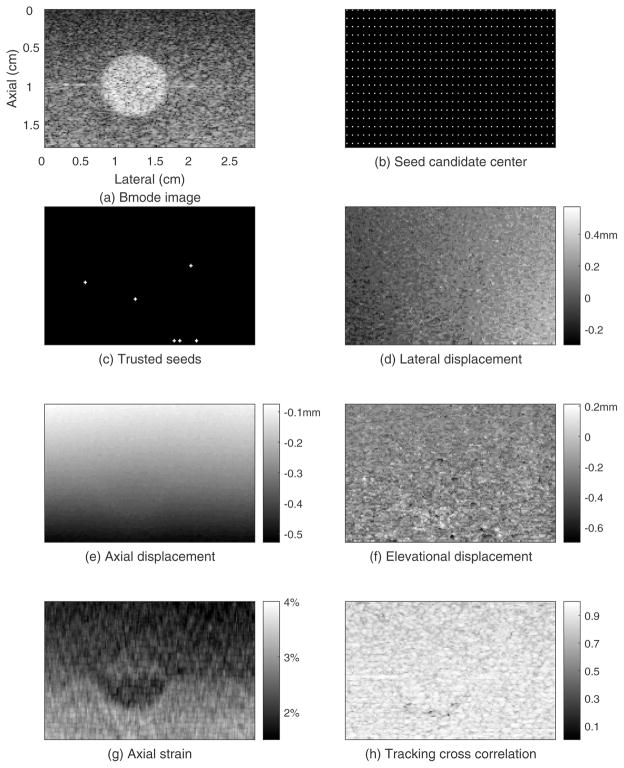
The results for the phantom experiment are shown in figures 3–5. Figure 3 shows the B-mode image and motion tracking results for the initial plane. The electronic SNR for the echo signals in this plane was about 36dB. The spherical inclusion is easily seen in the B-mode image (figure 3(a)). The white points in figure 3(b) are the locations of the seed candidate center points. The white points in figure 3(c) are the trusted seeds that were used for region-growing motion tracking. Each white cross represents one seed center and its 4 neighboring points. In this case, 6 seed centers and their neighboring points were accepted as trusted seeds. Thus, the initial known displacement point set (see Appendix A) contains 6×5=30 points. Figure 3(d) shows the lateral displacement field. The estimated lateral displacement of most points is in the range from −0.2mm to 0.4mm with an average lateral displacement for this plane of 0.1mm. The lateral displacement estimates gradually increase from left to right, which is consistent with lateral expansion accompanying axial compression of the cuboid phantom. Figure 3(e) shows a smoothly varying axial displacement field with estimated displacement at the top of the ROI being approximately −0.1mm and −0.5mm at the bottom of the ROI. Figure 3(f) shows the elevation displacement field with estimates for most points ranging from −0.6mm to 0.2mm. Figure 3(g) shows the axial strain image. The upper half of background was slightly stiffer (darker, average strain of 2.0%) than the lower half (average strain of 2.8%), and the average strain in the sphere was 2.3% in the upper half and 2.2% in the lower half. As a result, the low-contrast spherical inclusion in the upper background was not detectable compared to the background. However, the inclusion can be identified in the lower background. These average strain values indicate that the upper background is the stiffest, the lower background is the softest, and the inclusion stiffness is between them. This result is consistent with the elastic moduli estimated in the shear wave speed test. Figure 3(h) shows the tracking cross-correlation coefficient (TCCC) between the tracking kernel in the pre-deformation RF echo field and its best match in the search region of the post-deformation RF echo field. About 83% of the tracking kernels in this plane had TCCC (with a location in the post-deformation search region) that was higher than 0.8, and the average TCCC in this plane was 0.86.
Figure 3.
Guided-search motion tracking results for the initial displacement estimation plane of the phantom whose elevational position is 0.80cm.
Figure 5.
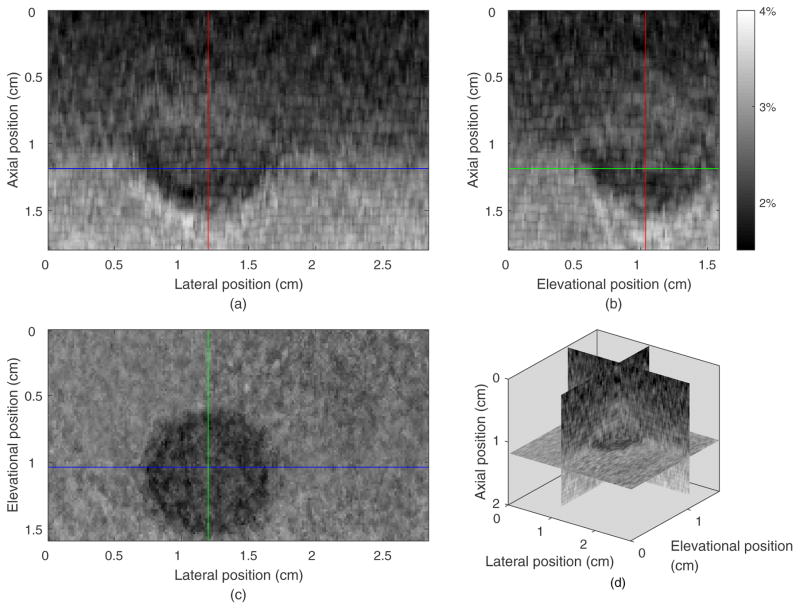
Orthogonal and composite views of the axial stain field from guided-search motion tracking in the 3D ROI of a phantom. (a) The strain image in the axial-lateral plane (the same as the B-mode image plane) whose elevational position is 1.04 cm. (b) the strain field in a axial-elevational plane whose lateral position is 1.20 cm, orthogonal to the typical 2D imaging plane and crossing the vertical line in subfigure (a). (c) The strain field in the lateral-elevational (horizontal) plane whose axial position is 1.20 cm, orthogonal to the typical 2D imaging plane and crossing the horizontal line in subfigure (a). (d) The composite 3D view of the axial strain field.
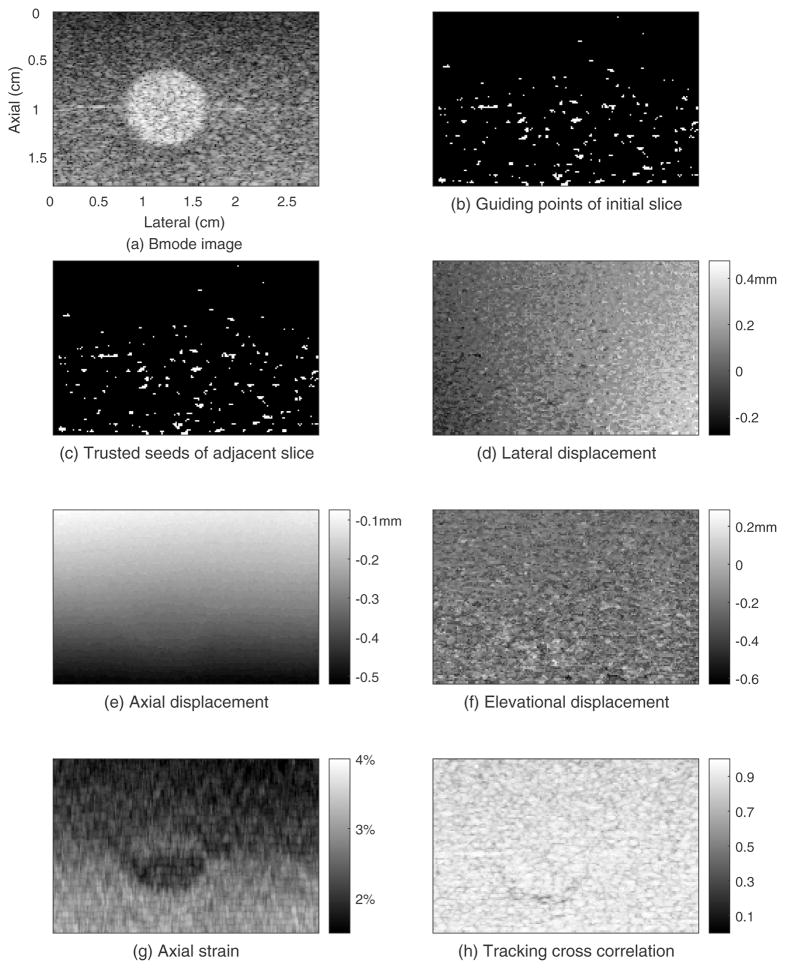
Figure 4 shows the phantom tracking results from using trusted displacement estimates in the initial plane to guide displacement estimation in the adjacent plane. The white points in figure 4(b) represent the locations of elevational guiding points in the initial plane that were used to guide the displacement estimation of corresponding (seed candidate) points in this adjacent plane. The white points in figure 4(c) show the trusted seed locations of this adjacent plane. About 3% of the displacement estimates in this adjacent plane were selected as trusted seeds in this plane. By default, there should have been fewer trusted seeds than the seed candidates in the adjacent plane. However, motion tracking data from the phantom experiment was so good that almost all seed candidates qualified as trusted seeds in this adjacent plane. Figures 7(d–f) show the lateral, axial and elevational displacement fields, respectively. Figure 4(g) shows the axial strain image, and figure 4(h) shows the TCCC image. About 83% of the tracking kernels in this adjacent plane had a TCCC higher than 0.8, and the average TCCC in this adjacent plane was 0.86.
Figure 4.
Guided-search motion tracking results for the plane (whose elevational position is 0.78cm) adjacent to the initial motion-tracking plane in the phantom.
Figure 7.
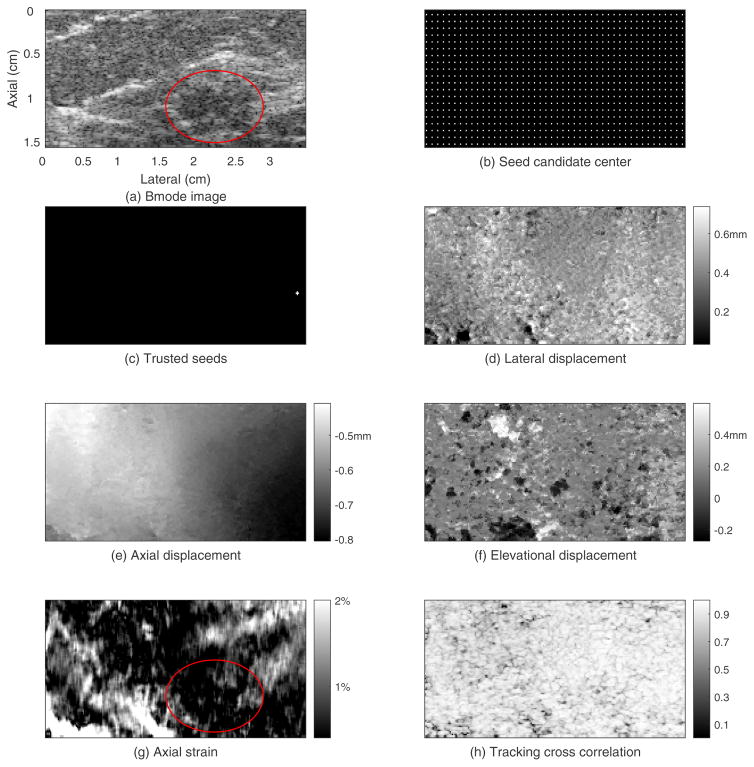
Guided-search motion tracking results for the initial plane whose elevational position is 0.63cm of an in vivo human breast.
Figure 5 shows the three orthogonal images of the 3D axial stain field from the phantom experiment. The axial strain image of the initial plane (axial-lateral plane of the transducer) is shown in figure 5(a). Figure 5(b) shows strain field in the axial-elevational plane going through the vertical line in figure 5(a). The round inclusion, especially the lower half sphere, can be seen in this view. Figure 5(c) shows the elevational-lateral plane of the 3D strain field going through the horizontal line in figure 5(a) where again the stiff inclusion is easily seen. Figure 5(d) shows the 3 composite orthogonal strain images together in 3D space. The average normalized cross-correlation between the pre-deformation and motion-compensated post-deformation field (MCNCC, a robust measure of motion tracking quality37) over the tracking volume is 0.94. The average MCNCC for the exhaustive search method was 0.93 illustrating that most reasonably good motion tracking methods worked equivalently well in simple phantom experiments (typical phantom experiments do not provide a sufficient challenge to study performance of motion tracking algorithms in ultrasound elasticity imaging37).
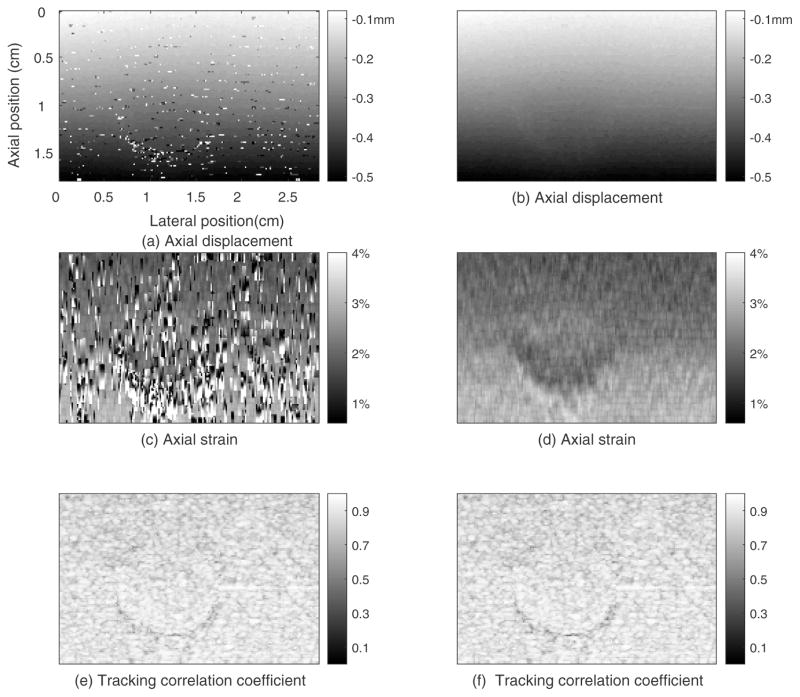
We compared our 2D region-growing 3D motion tracking method with an exhaustive search method36 performed on the same phantom data with the same motion-tracking ROI, motion-tracking kernel size, and search region size. Figure 6 shows the motion tracking results for the phantom using non-guided exhaustive search method (first column) and the 2D region growing method (second column), respectively. Comparing the images in the two columns shows the 2D region-growing motion tracking method provided a smoother displacement field than the exhaustive search. The displacement errors from the exhaustive search method caused consequent errors in the strain images. In figure 6(e), about 83% of the tracking kernels in this plane had a TCCC higher than 0.8. The average TCCC in figure 6(e), was 0.86 which is the same as that of the 2D region growing algorithm (0.86; Figure 6(f)).
Figure 6.
Motion tracking results for the plane whose elevational position is 0.98cm from the phantom obtained by the exhaustive search method (left column) and 2D region-growing method (right column).
The computation time for motion tracking between a pair of volume RF echo data in the phantom experiment for the exhaustive search method and the 2D region-growing method were about 48 mins and 4.7 mins, respectively.
B. Result for the in vivo human breast
Figures 7–9 show the motion tracking results from an in vivo human breast. Figure 7 shows the displacement estimation results for the initial plane. The ROI-average electronic SNR for the echo signals in this plane was about 38dB (about 22dB in the darkest area of the lesion). Figure 7(a) shows the B-mode image. A hypoechoic suspected lesion in the right lower part of the image is marked by an ellipse. Figure 7(b) shows the location of the seed candidate centers, and Figure 7(c) shows the trusted seeds in the initial plane. Only one seed center and its four neighboring points were selected as trusted seeds in this plane. Figure 7(d) shows the lateral displacement field. Lateral displacements of most points ranged from 0.1 to 0.7mm. The average lateral displacement in this plane was 0.45mm suggesting a net lateral translation resulting from the axial load. Figure 7(e) shows the relatively smooth axial displacement field which ranged mostly from −0.8 to −0.4mm. Figure 7(f) shows the elevational displacement field. Elevational displacements of most points ranged from −0.2mm to 0.6 mm. The average elevational displacement in this plane was 0.1mm though there are neighboring displacement estimates that differ by more than 1 RF sample. Figure 7(g) shows the axial strain field where most of the strain values were less 3%. The average strain value was 0.8%. The ellipse shows the projected outline of the lesion from the B-mode image. Figure 7(h) shows the TCCC image. About 79% of the points in this plane had TCCC higher than 0.8 with the average TCCC in this plane was 0.85.
Figure 9.
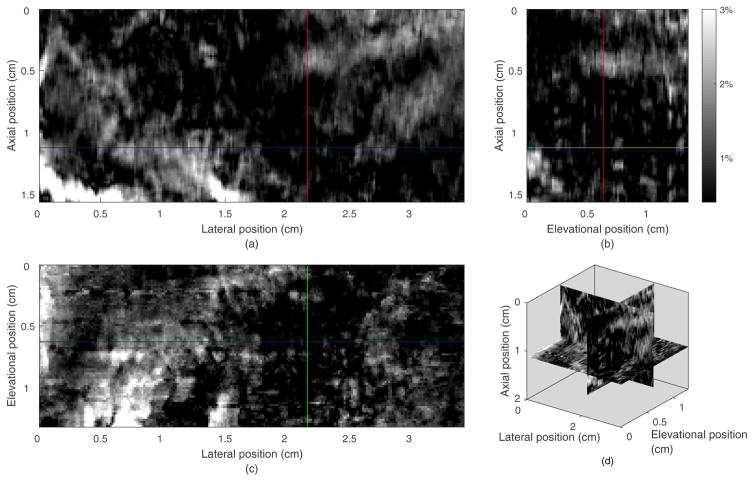
Orthogonal and composite views of the axial stain field from guided-search motion tracking in an in vivo human breast. (a) The strain image of the initial plane whose elevational position is 0.63cm. (b) The strain field in a vertical plane whose lateral position is 2.16cm, orthogonal to the initial plane and crossing the vertical line in subfigure(a). (c) The strain field in the horizontal plane whose axial position is 1.12cm, orthogonal to the initial plane and crossing the horizontal line in subfigure (a). (d) The composite 3D view of the axial strain field.
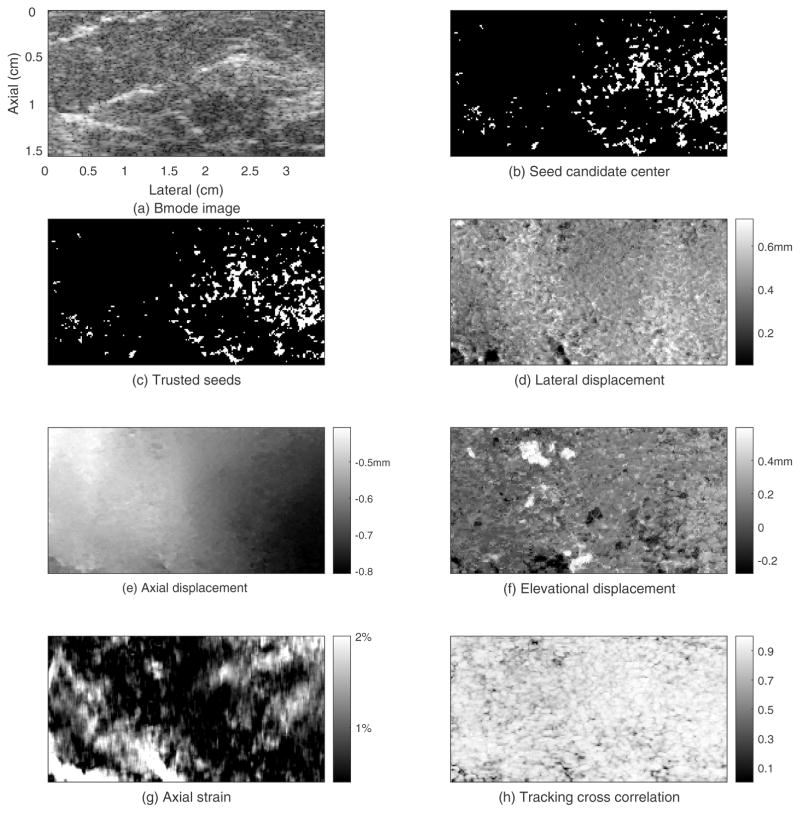
Figure 8 shows the tracking results from using trusted displacement estimates in initial plane to guide displacement estimation in the adjacent plane for in vivo human breast. Figure 8(b) shows the locations of guiding points in the initial plane that were used to guide the displacement estimation of corresponding points in this adjacent plane. Figure 8(c) shows the trusted seed locations in this adjacent plane. About 7% of points in this adjacent plane were selected as trusted seeds. Figure 8(d), (e) and (f) shows the lateral, axial and elevational displacement field in this adjacent plane respectively. Figure 8(g) shows the axial strain field. Figure 8(h) shows the TCCC image. About 79% of the tracking kernels in this adjacent plane had a TCCC higher than 0.8, and the average TCCC in this adjacent plane was 0.86.
Figure 8.
Guided-search motion tracking results for the plane (whose elevational position is 0.65cm) adjacent to the initial plane from an in vivo human breast.
Figure 9 shows the three orthogonal images of the 3D axial stain field from the in vivo human breast experiment. Figure 9(a) shows the axial strain image of the initial plane (axial-lateral plane of the transducer). Figure 9(b) shows the axial-elevational plane of the strain field going through the vertical line in figure 9(a). Figure 9(c) shows the elevational-lateral plane of the 3D strain field going through the horizontal line in figure 9(a). Figure 9(d) shows the 3 composite orthogonal strain images together in 3D space.
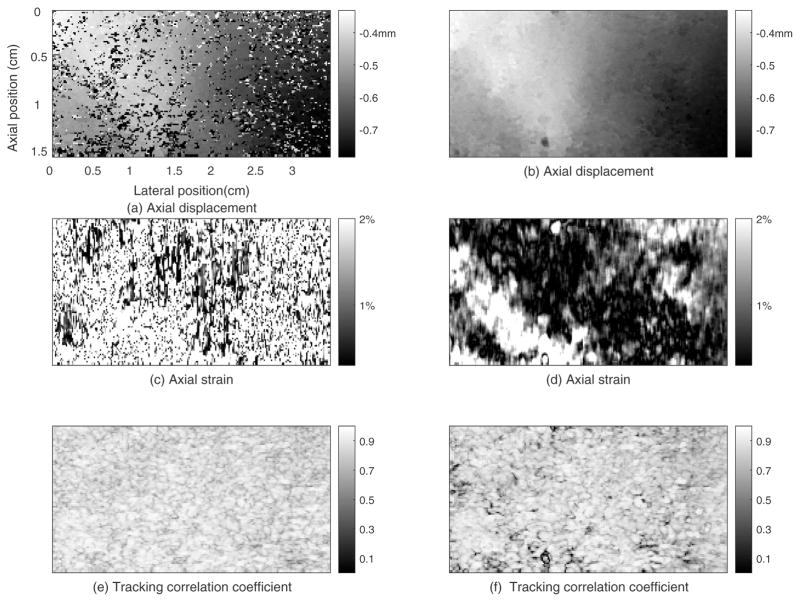
We compared our 2D region-growing 3D motion tracking method with an exhaustive search method30 performed on the same breast data with the same motion-tracking ROI, motion-tracking kernel size, and search region size. Figure 10 shows the motion tracking results for breast using non-guided exhaustive search method (first column) and the 2D region growing method (second column), respectively. The average TCCC in figure 13(e), was 0.84 which is somewhat higher than that of the 2D region growing algorithm (0.80; figure 10(f)). However, significant peak-hopping errors are observed in axial displacement field in figure 10(a) and consequent strain errors in figure 10(c).
Figure 10.
Motion tracking results for the plane whose elevational position is 0.98cm from human breast obtained by the exhaustive search method (left column) and 2D region growing method (right column).
Figure 13.
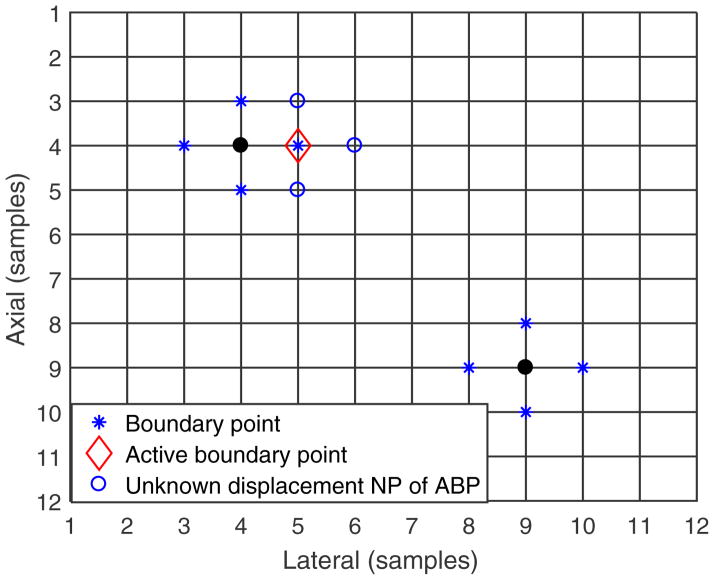
An example of trusted seeds and region growing from them. The solid round markers and the star markers indicate the trusted seeds for which displacements are known. The star markers indicate the boundary points. The diamond marker indicates the active boundary point which is used to guide displacement estimation at its neighboring points (indicated with the open circle markers).
To compare the performance of the two methods, for every volume pair, the MCNCC were calculated. The averages and standard deviations of MCNCC of the entire volume for the 5 volume pairs are shown in Table 2. For all 5 volume pairs, the 2D region growing tracking method generated almost the same average MCNCC as the exhaustive search method. The computation time for a pair of volume data for the exhaustive search method and 2D region-growing 3D motion tracking method, however, were about 100 min and 5.3 min, respectively.
Table 2.
Average and standard deviation of the normalized cross-correlation between the pre-deformation and motion-compensated post-deformation RF echo fields (entire ROI) from 5 consecutive volume pairs of breast data obtained with the 2D region-growing motion tracking method and exhaustive search motion tracking method.
| Vol pair 1 | Vol pair 2 | Vol pair 3 | Vol pair 4 | Vol pair 5 | |
|---|---|---|---|---|---|
| RGMT | 0.86 ±0.10 | 0.85±0.12 | 0.86 ±0.11 | 0.87 ± 0.10 | 0.88±0.10 |
| ESMT | 0.86 ±0.08 | 0.85± 0.09 | 0.87 ± 0.08 | 0.87± 0.08 | 0.88±0.08 |
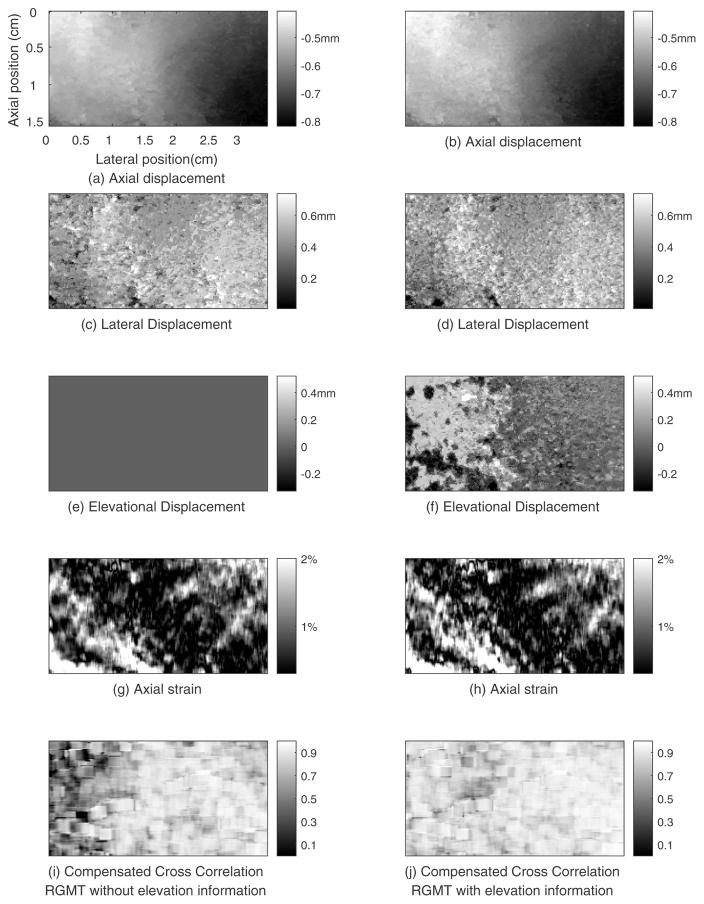
Figure 11 shows the motion tracking results for the breast using the region growing motion tracking methods without elevational information (first column) and with elevational information (second column). In figure 11(e), the elevational displacement of this plane is zero. In figure 11(f), the left part of this plane have elevational displacement of approximate 2 planes (0.34mm) and the right part about zero. Comparing figure 11(i) and (j), more low correlation area is seen at the left part of the MCNCC image shown in figure 11(i). Lacking elevational displacement information may account for this low correlation area. The average MCNCC value of this plane obtained by RGMT without and with elevational information are 0.74 (figure 11(i)) and 0.86 (figure 11(j)), respectively.
Figure 11.
Motion tracking results for the plane whose elevational position is 0.70cm from human breast obtained by the region growing method without (left column) and with (right column) elevational information.
Discussion
Volume ultrasound image data, instead of data from only a single plane, can be obtained by 3D ultrasound scanning systems. After acquisition, data can be analyzed in different ways,38 such as displaying the data in planes that are not accessible with typical 2D scanning methods. Viewing data in different ways may help physicians discover pathology which is otherwise difficult to detect.39 3D ultrasound data also enables the visualization of 3D complex tissue structure that might not be seen in typical 2D scanning planes.40 This is particularly important for elasticity imaging.3D ultrasound RF echo data enables tracking of the displacement in the elevational direction (in addition to the axial and lateral tracking available with typical 2D systems). Elevational displacement fields in figure 11(f) demonstrate that points which were in the same plane before compression might move to different planes after compression. Such elevational motion can cause echo signal decorrelation, as shown in figure 11(i), thus impeding 2D tracking algorithms, whereas a 3D motion tracking algorithm has the potential to track this heterogeneous elevation displacement, as shown in figure 11(j). Further, 2D data acquisition and tracking can limit elasticity imaging of breast lesions to the plane where deformation can be performed with limited elevation motion. This ‘best plane’ for elasticity imaging might not be the best plane for lesion characterization.
In the estimated 3D displacement fields, there may be neighboring points with displacement differences greater than one RF sample, though the search region is only one RF sample. This is a result of their displacement estimation occurring from different active boundary points, and those nearby displacement estimates could differ by more than one RF sample. This provides clear evidence of the merit of a regularized motion tracking algorithm.26
Peak hopping errors are displacement estimate errors exceeding one (ultrasound) wavelength, and they most often occur in the lateral and elevational directions where the displacement estimate guidance is poorer than in the axial direction. The sampling intervals in the lateral and elevational directions are much less than that in the axial direction, and there is no phase information to track. Peak hopping errors are typically caused by echo signal decorrelation. Any approach to significantly reduce decorrelation error can reduce the frequency of peak hopping errors. The major decorrelation source in the in vivo experiment is the subject motion. Therefore, keeping the subject motionless during the scan (by increasing the volume acquisition rate) would be an effective approach to prevent peak hopping errors.
Handheld 3D ultrasound data acquisition systems (2D arrays, or mechanically swept 1D arrays) only acquire relatively small fields of view. As a result, numerous small sets of volume data must be combined, in some manner, to comprehensively study the whole breast, and this makes the approach operator-dependent, reducing reproducibility of results.41 This approach also increases the time required to scan the entire breast and might miss some areas.42 Alternatively, whole breast scanning systems are more operator-independent and acquire ultrasound data relatively quickly. Further, computer aided detection systems could be used to assist in locating possible regions of concern.43
The ABVS can scan a region large enough to view the entire breast in a single sweep in many women. The precisely controlled elevational motion of the transducer enables uniform spatial sampling. The motor-controlled vertical movement of the transducer not only facilitates the deformation but also makes the generation of strain images less operator-dependent. However, the volume scanning speed (about 13 planes per second in our study) is relatively slow for 3D elasticity imaging. The volume acquisition scan time on the ABVS is determined, in part, by the total number of planes of RF echo data acquired. For the human breast scan in this study, the elevational span and distance between scan planes were set to 40mm and 0.2mm, respectively, resulting in 200 planes of RF data per scan volume. Single volume acquisitions required about 16 seconds. Although subjects were instructed to hold their breath during each volume acquisition, subject breathing motion appeared during some scans causing substantial decorrelation of the RF echo signals and errors in motion tracking.
A compliant coupling attachment, filled with liquid, replaced the commercial open mesh scanning screen on our research system. Exerting force on the breast via the liquid-filled bag, rather than the mesh screen, likely provided a more uniform surface stress distribution (consistent with greater comfort for the subject). However, since the liquid in the bag occupied some depth along the acoustic scan line, the potential scan depth into the breast was reduced.
We previously reported 3D elasticity imaging based on data from a 2D array.17 The motion tracking methods implemented in that study were based on a lateral guidance tracking algorithm.17 That algorithm first estimates displacements along a central set of A-lines and then uses those displacement estimates to guide displacement estimation along the adjacent A-lines in the axial-elevational plane. Once displacement estimation is complete in that plane, those displacement estimates are used to guide displacement estimation in adjacent planes. Subsequent work demonstrated the superiority of the region-growing strategy for 2D elasticity imaging,26 and the work reported here extends that region-growing approach to 3D motion tracking.
In the exhaustive search method, the search for maximum correlation was performed within a large search region. Since the search range was larger than a wavelength, the likelihood of large displacement estimate errors was introduced, compared to the guided search strategy, and strong evidence showing the existence of those errors is visible in figures 6 and 10. The reduction in these errors, and the significantly decreased computation time for guided-search motion tracking are the main advantages of the guided-search motion tracking approach.
The motion tracking performance in the phantom was considerably better, as assessed by the motion-compensated cross-correlation estimates between the pre- and post-deformation RF echo fields, than motion tracking in the breast example. In fact, little difference in performance in phantoms was found between the region-growing algorithm and the exhaustive search algorithm, even though the latter produced several obvious motion tracking errors of more than a wavelength (see figure 6). This suggests, as observed in 2D motion tracking studies,37 the displacement fields created with typical experiments involving simple phantoms are not sufficiently challenging to test the performance of sophisticated motion tracking algorithms. Although ‘ground truth’ is not known in elasticity imaging studies in tissues, the heterogeneity of tissue combined with the more complicated boundary conditions for motion are essential for creating sufficiently complicated displacement fields to test performance of sophisticated motion tracking algorithms.
The tracking algorithm performance may be influenced by the seed selection. A high density of candidate seed centers was selected in this study to improve the chances of finding “trusted seeds”. Despite this, it is possible in some data sets that no trusted seeds would be found in the initial plane, resulting in the failure of the initial step of the algorithm. In such a case, candidate seeds can be tested in more RF echo planes in an attempt to find trusted seeds, and, for example, the plane with the highest concentration of trusted seeds can be used to initiate the region-growing algorithm. If still no seed can be found in all planes under current threshold criteria, seed acceptance criteria can become increasingly less strict until some seeds found. This region-growing displacement estimation algorithm can also fail if no displacement estimates in a plane qualify as “elevational guiding points” for displacement estimation in the adjacent plane. In this situation, the elevational guiding point acceptance criteria can become increasingly less strict until guiding points are found (with a likely compromise in the quality of motion tracking).
In the step of finding trusted seeds, one trusted seed is sufficient for the displacement estimation of the whole plane if the displacement in a plane is continuous. However, if the displacement field of a plane is composed of two or more discontinuous parts, there must be at least one trusted seed in each of these parts to guarantee correct motion tacking result. In the in vivo experiment, if the subject didn’t move during a scan, and if there is no slipping along a boundary between tissue types, the displacement field should be continuous and one seed is enough.
Conclusion
The modified commercial automated breast volume scanning system reported in this study provided 3D ultrasound RF echo data suitable for elasticity imaging. The 2D region-growing displacement estimation algorithm reported here provided high quality 3D displacement estimates in a simple phantom and consecutive volumes in an in vivo breast study (high cross-correlation between the pre- and motion-compensated post-deformation echo fields) with computation times that are about one-tenth that of block-matching with an exhaustive 3D search. These results demonstrate that motion tracking with a region-growing guided-search strategy is an attractive approach for 3D quasi-static elasticity imaging.
Acknowledgments
The authors would like to thank Siemens Healthcare for their technical and in-kind support. Research reported in this publication was supported by National Institutes of Health Grant R01CA140271. The content is solely the responsibility of the authors and does not necessarily represent the official views of the National Institutes of Health.
Appendix A. 2D region growing motion tracking method
A.1. Selection of trusted seeds
Several sparse points on the 3D grid in the tracking ROI are selected as candidates for the seed centers. For all the experiments reported here, the spacing between candidate seeds is 5 grid points in both the axial and lateral directions. At each seed candidate location, its center point (CP) and its 4 neighboring (4-connected) points (NPi, i=1–4) are considered together and their displacements are estimated first. The displacements of the 5 points are determined by the following “maximum correlation sum” method. Suppose that, after deformation, the center point and its neighboring points (CP and NPi) move to CP′ and NPi′ respectively. The cross-correlation between the tracking kernel centered at point (P) in pre-deformation volume and a candidate location (P′) in the post-deformation volume is denoted as CC(P,P′). In the neighborhood of CP, the 3D cross-correlation coefficients between pre- and post-deformation volume for all 5 points (CP and NPi) are calculated and the 5 correlation coefficients are used to compute the cross-correlation sum (CCS), as shown in Eqn. (1). Then, the maximum cross-correlation sum (MCCS) is found within a search region (SR), as shown in Eqn. (2). The center of the search range is the center point (CP) and a relatively large 3D search region is used to perform an exhaustive search. The individual displacement estimates (P′-P) where the maximum correlation sum is obtained are used as the displacements of these 5 points.
| (1) |
| (2) |
The displacement difference among the center point (the seed candidate center) and each of its neighboring points is also calculated. The maximum absolute displacement difference (MADD) is computed for each seed candidate center.
High correlation and continuity are the acceptance criteria for trusted seeds. Correlation is represented by the MCCS and the continuity by MADD. A threshold value is set to select those seed points with sufficiently high MCCS. Another threshold is set to determine those seeds with sufficiently high displacement estimate continuity (low MADD). Seeds with MCCS above its threshold and MADD below its threshold are considered trusted seeds.
The threshold for seed acceptance were determined empirically. We expected the threshold to be strict, high MCCS and low MADD, so that the displacement of seeds are more trustworthy. However, if the criteria are too strict, no seed might be found. Therefore, the threshold is a case-dependent parameter. The threshold was set to a value that resulted in obtaining several seeds in the data field. Criteria for these thresholds are described for the specific experiments.
A.2. Selection of the initial plane
The initial plane whose displacements will be first estimated can be arbitrarily selected. The middle plane of the tracking ROI is often selected as this initial plane. Or, the above strategy of trusted seed selection can be extended to a distribution of candidate seeds throughout the volume of interest. Then a strategy for initial plane selection, such as the plane with the highest number of trusted seeds, can be used as the initial plane to begin region-growing. In this study, the central plane of RF echo data ROI was arbitrarily selected as the initial plane for motion tracking.
A.3. 2D Region growing displacement estimation
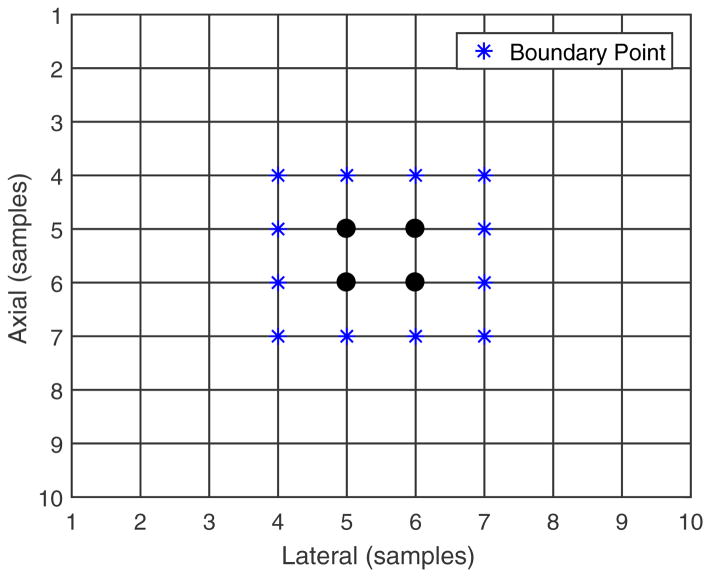
Several “set” definitions help describe the 2D region-growing method. We define the “known displacement” point set as the grid points in the pre-deformation image for which displacement has been estimated. We also define the neighboring point set (NPi) of a center point (CP) as the 4 closest (4-connected) points surrounding the center grid point. We also define the boundary point set as a subset of the known displacement point set for which at least one neighboring point has unknown displacement, as shown in figure 12. Given this grid of points in the ROI and the known displacement point set, its boundary point set can be determined.
Figure 12.
An example boundary point set. Displacement has been estimated at both the round and star markers (known displacement points), but the star markers indicate the boundary points.
After the determination of the 3D displacements of the trusted seeds in the initial plane, a 3D displacement estimate and a tracking cross-correlation value are associated with each seed point. All trusted seeds compose the initial known displacement point set. The details of the region-growing algorithm are described below.
First, the boundary point set is determined. Figure 13 shows an example of the trusted seeds. The solid round and star points are the center points and boundary points, respectively, of the trusted seeds. The boundary point that has the highest tracking cross-correlation value is considered the ‘most trusted’ among the boundary point set and named the “active boundary point” (ABP), whose displacement will be used to guide the displacement estimation at its neighboring points. In figure 13, the diamond point represents the active boundary point. The 3D grid spacing is small enough that known displacement at one location provides a good initial estimate of displacement at its nearest neighboring points.23, 24
For the neighboring points around the ABP whose displacements are currently unknown (open circles), displacement will be estimated by computing the cross-correlation between the tracking kernel centered at this neighboring point and the kernels within only 1 grid point in each direction around the predicted displacement (from the known ABP displacement). The post-deformation location with the highest cross-correlation value is selected as the integer (RF sample-level) displacement estimate. Interpolation is used to estimate subsample displacement.
The neighboring points whose displacements were just estimated will be added to the known displacement point set (the 3 open circle points in figure 13). Then, the new boundary point set is determined, and the above process is repeated until the displacement is estimated for all points in this plane.
A.4. Adjacent plane displacement estimation
After the displacements in one plane are estimated, the points in this plane whose displacement estimates have high MCCS and low MADD are selected and named “elevational guiding points”. These elevational guiding points are then used to guide the displacements of the corresponding points in its adjacent plane with unknown displacements. These corresponding points become seed candidates for region growing in the now current plane. For example, if the known displacement plane number is z and a point (x, y) is a guiding point in plane z, this elevational guiding point (x, y, z) is used to guide the displacement estimation of the point (x, y, z+1) (or, equivalently, (x, y, z−1)) in its adjacent plane. A small (±1 sample in each direction) search region is used. The displacement is determined by the maximum 3D cross-correlation method. Seed candidates with CCS above a set threshold become trusted seeds for region growing in the now current plane (plane z+1 or z−1).
The above process describes how to estimate the in-plane displacements in an RF echo signal plane with unknown displacements from a known displacement field in an adjacent RF echo signal plane. We refer to this as the between-plane displacement estimation. This between-plane displacement estimation is performed plane-by-plane in one elevation direction from the initial plane, and the process is repeated in the opposite elevation direction (from the initial plane) until the displacements in all planes of ROI are estimated and a 3D displacement field on the whole ROI is obtained.
References
- 1.Balleyguier C, Ciolovan L, Ammari S, Canale S, Sethom S, Al Rouhbane R, Vielh P, Dromain C. Breast elastography: the technical process and its applications. Diagnostic and interventional imaging. 2013 May 31;94(5):503–13. doi: 10.1016/j.diii.2013.02.006. [DOI] [PubMed] [Google Scholar]
- 2.Goddi A, Bonardi M, Alessi S. Breast elastography: a literature review. Journal of ultrasound. 2012 Sep 30;15(3):192–8. doi: 10.1016/j.jus.2012.06.009. [DOI] [PMC free article] [PubMed] [Google Scholar]
- 3.Saarenmaa I, Salminen T, Geiger U, Heikkinen P, Hyvärinen S, Isola J, Kataja V, Kokko ML, Kokko R, Kumpulainen E, Kärkkäinen A. The effect of age and density of the breast on the sensitivity of breast cancer diagnostic by mammography and ultasonography. Breast cancer research and treatment. 2001 May 1;67(2):117–23. doi: 10.1023/a:1010627527026. [DOI] [PubMed] [Google Scholar]
- 4.Duncan JL, III, Cederbom GJ, Champaign JL, Smetherman DH. Benign diagnosis by image-guided core-needle breast biopsy. The American surgeon. 2000 Jan 1;66(1):5. [PubMed] [Google Scholar]
- 5.Chiou SY, Chou YH, Chiou HJ, Wang HK, Tiu CM, Tseng LM, Chang CY. Sonographic features of nonpalpable breast cancer: a study based on ultrasound-guided wire-localized surgical biopsies. Ultrasound in medicine & biology. 2006 Sep 30;32(9):1299–306. doi: 10.1016/j.ultrasmedbio.2006.05.018. [DOI] [PubMed] [Google Scholar]
- 6.Barr RG, Nakashima K, Amy D, Cosgrove D, Farrokh A, Schafer F, Bamber JC, Castera L, Choi BI, Chou YH, Dietrich CF. WFUMB guidelines and recommendations for clinical use of ultrasound elastography: Part 2: breast. Ultrasound in medicine & biology. 2015 May 31;41(5):1148–60. doi: 10.1016/j.ultrasmedbio.2015.03.008. [DOI] [PubMed] [Google Scholar]
- 7.Garra BS, Cespedes EI, Ophir J, Spratt SR, Zuurbier RA, Magnant CM, Pennanen MF. Elastography of breast lesions: initial clinical results. Radiology. 1997 Jan;202(1):79–86. doi: 10.1148/radiology.202.1.8988195. [DOI] [PubMed] [Google Scholar]
- 8.Ophir J, Cespedes I, Ponnekanti H, Yazdi Y, Li X. Elastography: a quantitative method for imaging the elasticity of biological tissues. Ultrasonic imaging. 1991 Apr 1;13(2):111–34. doi: 10.1177/016173469101300201. [DOI] [PubMed] [Google Scholar]
- 9.Oberai AA, Gokhale NH, Goenezen S, Barbone PE, Hall TJ, Sommer AM, Jiang J. Linear and nonlinear elasticity imaging of soft tissue in vivo: demonstration of feasibility. Physics in medicine and biology. 2009 Jan 30;54(5):1191. doi: 10.1088/0031-9155/54/5/006. [DOI] [PMC free article] [PubMed] [Google Scholar]
- 10.Liu T, Babaniyi OA, Hall TJ, Barbone PE, Oberai AA. Noninvasive in-vivo quantification of mechanical heterogeneity of invasive breast carcinomas. PloS one. 2015 Jul 8;10(7): e0130258. doi: 10.1371/journal.pone.0130258. [DOI] [PMC free article] [PubMed] [Google Scholar]
- 11.Nightingale KR, Palmeri ML, Nightingale RW, Trahey GE. On the feasibility of remote palpation using acoustic radiation force. The Journal of the Acoustical Society of America. 2001 Jul 1;110(1):625–34. doi: 10.1121/1.1378344. [DOI] [PubMed] [Google Scholar]
- 12.Bercoff J, Tanter M, Fink M. Supersonic shear imaging: a new technique for soft tissue elasticity mapping. IEEE transactions on ultrasonics, ferroelectrics, and frequency control. 2004 Apr;51(4):396–409. doi: 10.1109/tuffc.2004.1295425. [DOI] [PubMed] [Google Scholar]
- 13.Sarvazyan AP, Rudenko OV, Swanson SD, Fowlkes JB, Emelianov SY. Shear wave elasticity imaging: a new ultrasonic technology of medical diagnostics. Ultrasound in medicine & biology. 1998 Dec 31;24(9):1419–35. doi: 10.1016/s0301-5629(98)00110-0. [DOI] [PubMed] [Google Scholar]
- 14.Bai M, Du L, Gu J, Li F, Jia X. Virtual touch tissue quantification using acoustic radiation force impulse technology initial clinical experience with solid breast masses. Journal of Ultrasound in Medicine. 2012 Feb 1;31(2):289–94. doi: 10.7863/jum.2012.31.2.289. [DOI] [PubMed] [Google Scholar]
- 15.Evans A, Whelehan P, Thomson K, McLean D, Brauer K, Purdie C, Jordan L, Baker L, Thompson A. Quantitative shear wave ultrasound elastography: initial experience in solid breast masses. Breast cancer research. 2010 Dec 1;12(6):1. doi: 10.1186/bcr2787. [DOI] [PMC free article] [PubMed] [Google Scholar]
- 16.Deprez JF, Brusseau E, Schmitt C, Cloutier G, Basset O. 3D estimation of soft biological tissue deformation from radio-frequency ultrasound volume acquisitions. Medical image analysis. 2009 Feb 28;13(1):116–27. doi: 10.1016/j.media.2008.07.003. [DOI] [PubMed] [Google Scholar]
- 17.Fisher TG, Hall TJ, Panda S, Richards MS, Barbone PE, Jiang J, Resnick J, Barnes S. Volumetric elasticity imaging with a 2-D CMUT array. Ultrasound in medicine & biology. 2010 Jun 30;36(6):978–90. doi: 10.1016/j.ultrasmedbio.2010.03.019. [DOI] [PMC free article] [PubMed] [Google Scholar]
- 18.Bharat S, Fisher TG, Varghese T, Hall TJ, Jiang J, Madsen EL, Zagzebski JA, Lee FT. Three-dimensional electrode displacement elastography using the Siemens C7F2 fourSight four-dimensional ultrasound transducer. Ultrasound in medicine & biology. 2008 Aug 31;34(8):1307–16. doi: 10.1016/j.ultrasmedbio.2008.01.007. [DOI] [PMC free article] [PubMed] [Google Scholar]
- 19.Treece GM, Lindop JE, Gee AH, Prager RW. Freehand ultrasound elastography with a 3-D probe. Ultrasound in medicine & biology. 2008 Mar 31;34(3):463–74. doi: 10.1016/j.ultrasmedbio.2007.08.014. [DOI] [PubMed] [Google Scholar]
- 20.Lindop JE, Treece GM, Gee AH, Prager RW. 3D elastography using freehand ultrasound. Ultrasound in medicine & biology. 2006 Apr 30;32(4):529–45. doi: 10.1016/j.ultrasmedbio.2005.11.018. [DOI] [PubMed] [Google Scholar]
- 21.Insana MF, Chaturvedi P, Hall TJ. 3-D companding using linear arrays for improved strain imaging. Ultrasonics Symposium, 1997. Proceedings., 1997 IEEE; 1997 Oct 5; IEEE; pp. 1435–1438. [Google Scholar]
- 22.Huang Q, Xie B, Ye P, Chen Z. Correspondence-3-D ultrasonic strain imaging based on a linear scanning system. IEEE transactions on ultrasonics, ferroelectrics, and frequency control. 2015 Feb;62(2):392–400. doi: 10.1109/TUFFC.2014.006665. [DOI] [PubMed] [Google Scholar]
- 23.Zhu Y, Hall TJ. A modified block matching method for real-time freehand strain imaging. Ultrasonic imaging. 2002 Jul 1;24(3):161–76. doi: 10.1177/016173460202400303. [DOI] [PubMed] [Google Scholar]
- 24.Jiang J, Hall TJ. A parallelizable real-time motion tracking algorithm with applications to ultrasonic strain imaging. Physics in medicine and biology. 2007 May 29;52(13):3773. doi: 10.1088/0031-9155/52/13/008. [DOI] [PubMed] [Google Scholar]
- 25.Chen L, Treece GM, Lindop JE, Gee AH, Prager RW. A quality-guided displacement tracking algorithm for ultrasonic elasticity imaging. Medical image analysis. 2009 Apr 30;13(2):286–96. doi: 10.1016/j.media.2008.10.007. [DOI] [PMC free article] [PubMed] [Google Scholar]
- 26.Jiang J, Hall TJ. A fast hybrid algorithm combining regularized motion tracking and predictive search for reducing the occurrence of large displacement errors. IEEE transactions on ultrasonics, ferroelectrics, and frequency control. 2011 Apr;58(4):730–6. doi: 10.1109/TUFFC.2011.1865. [DOI] [PMC free article] [PubMed] [Google Scholar]
- 27.Ashfaq M, Brunke SS, Dahl JJ, Ermert H, Hansen C, Insana MF. An ultrasound research interface for a clinical system. IEEE transactions on ultrasonics, ferroelectrics, and frequency control. 2006 Oct;53(10):1759–71. doi: 10.1109/tuffc.2006.109. [DOI] [PubMed] [Google Scholar]
- 28.Percival DB, Walden AT. Spectral analysis for physical applications. Cambridge University Press; 1993. Jun 3, [Google Scholar]
- 29.Walker WF, Trahey GE. A fundamental limit on delay estimation using partially correlated speckle signals. IEEE Transactions on Ultrasonics, Ferroelectrics, and Frequency Control. 1995 Mar;42(2):301–8. [Google Scholar]
- 30.Madsen EL, Frank GR, Carson PL, Edmonds PD, Frizzell LA, Herman BA, et al. Interlaboratory comparison of ultrasonic attenuation and speed measurements. J Ultrasound Med. 1986;5:569–576. doi: 10.7863/jum.1986.5.10.569. [DOI] [PubMed] [Google Scholar]
- 31.Madsen EL, Hobson MA, Shi H, Varghese T, Frank GR. Stability of heterogeneous elastography phantoms made from dispersions in aqueous gels. Ultrasound Med Biol. 2006;32(2):261–270. doi: 10.1016/j.ultrasmedbio.2005.10.009. [DOI] [PMC free article] [PubMed] [Google Scholar]
- 32.Curry RA, Tempkin BB. Sonography: introduction to normal structure and function. Elsevier Health Sciences; 2015. Oct 7, pp. 519–529. [Google Scholar]
- 33.Cho Nariya, Moon Woo Kyung, Kim Ha Young, Chang Jung Min, Park Sang Hee, Lyou Chae Yeon. Sonoelastographic strain index for differentiation of benign and malignant nonpalpable breast masses. Journal of Ultrasound in Medicine. 2010;29(1):1–7. doi: 10.7863/jum.2010.29.1.1. [DOI] [PubMed] [Google Scholar]
- 34.Li X, Davis SK, Hagness SC, Van der Weide DW, Van Veen BD. Microwave imaging via space-time beamforming: Experimental investigation of tumor detection in multilayer breast phantoms. IEEE Transactions on Microwave Theory and techniques. 2004 Aug;52(8):1856–65. [Google Scholar]
- 35.Bayer M, Hall TJ. Variance and covariance of accumulated displacement estimates. Ultrasonic imaging. 2013 Apr;35(2):90–108. doi: 10.1177/0161734613479246. [DOI] [PMC free article] [PubMed] [Google Scholar]
- 36.Chen X, Xie H, Erkamp R, Kim K, Jia C, Rubin JM, O’Donnell M. 3-D correlation-based speckle tracking. Ultrasonic Imaging. 2005;27(1):21–36. doi: 10.1177/016173460502700102. [DOI] [PubMed] [Google Scholar]
- 37.Jiang J, Hall TJ, Sommer AM. A novel performance descriptor for ultrasonic strain imaging: a preliminary study. IEEE transactions on ultrasonics, ferroelectrics, and frequency control. 2006 Jun;53(6):1088–102. doi: 10.1109/tuffc.2006.1642508. [DOI] [PMC free article] [PubMed] [Google Scholar]
- 38.Gee A, Prager R, Treece G, Berman L. Engineering a freehand 3D ultrasound system. Pattern Recognition Letters. 2003 Feb 28;24(4):757–77. [Google Scholar]
- 39.Downey DB, Fenster A, Williams JC. Clinical Utility of Three-dimensional US 1. Radiographics. 2000 Mar;20(2):559–71. doi: 10.1148/radiographics.20.2.g00mc19559. [DOI] [PubMed] [Google Scholar]
- 40.Fenster A, Downey DB. 3-D ultrasound imaging: A review. IEEE Engineering in Medicine and Biology magazine. 1996 Nov;15(6):41–51. [Google Scholar]
- 41.Rankin RN, Fenster A, Downey DB, Munk PL, Levin MF, Vellet AD. Three-dimensional sonographic reconstruction: techniques and diagnostic applications. AJR. American journal of roentgenology. 1993 Oct;161(4):695–702. doi: 10.2214/ajr.161.4.8372741. [DOI] [PubMed] [Google Scholar]
- 42.Ikedo Y, Fukuoka D, Hara T, Fujita H, Takada E, Endo T, Morita T. Development of a fully automatic scheme for detection of masses in whole breast ultrasound images. Medical physics. 2007 Nov 1;34(11):4378–88. doi: 10.1118/1.2795825. [DOI] [PubMed] [Google Scholar]
- 43.Lo C, Shen YW, Huang CS, Chang RF. Computer-aided multi-view tumor detection for automated whole breast ultrasound. Ultrasonic imaging. 2014;36(1):3–17. doi: 10.1177/0161734613507240. [DOI] [PubMed] [Google Scholar]
- 44.Hall TJ, Bilgen M, Insana MF, Krouskop TA. Phantom materials for elastography. ieee transactions on ultrasonics, ferroelectrics, and frequency control. 1997 Nov;44(6):1355–65. [Google Scholar]
- 45.Pavan TZ, Madsen EL, Frank GR, Carneiro AA, Hall TJ. Nonlinear elastic behavior of phantom materials for elastography. Physics in medicine and biology. 2010 Apr 19;55(9):2679. doi: 10.1088/0031-9155/55/9/017. [DOI] [PMC free article] [PubMed] [Google Scholar]


