Abstract
Objective
Multiphoton autofluorescence microscopy (MPAM) has shown potential in identifying features that are directly related to tissue microstructural and biochemical changes throughout epithelial neoplasia. In this study, we evaluate the autofluorescence spectral characteristics of neoplastic epithelium in dysplasia and oral squamous cell carcinoma (OSCC) using multiphoton autofluorescence spectroscopy (MPAS) in an in vivo hamster model of oral neoplasia in order to identify unique signatures that could be used to delineate normal oral mucosa from neoplasia.
Materials/Methods
A 9,10-dimethyl-1,2-benzanthracene (DMBA) hamster model of oral precancer and OSCC was used for in vivo MPAM and MPAS. Multiphoton Imaging and spectroscopy were performed with 780 nm excitation while a bandpass emission 450–650 nm was used for MPAM. Autofluorescence spectra was collected through spectral window of 400–650 nm.
Results
MPAS with fluorescence excitation at 780 nm revealed an overall red shift of a primary blue-green peak (480–520 nm) that is attributed to NADH and FAD. In the case of oral squamous cell carcinoma (OSCC) and some high-grade dysplasia an additional prominent peak at 635 nm, attributed to PpIX was observed. The fluorescence intensity at 635 nm and an intensity ratio of the primary blue-green peak vs 635 nm peak, showed statistically significant difference between control and neoplastic tissue.
Discussion
Neoplastic transformation in the epithelium is known to alter the intracellular homeostasis of important tissue metabolites such as NADH, FAD and PpIX, which was observed by MPAS in their native environment. A combination of deep tissue microscopy owing to higher penetration depth of multiphoton excitation and depth resolved spectroscopy could prove to be invaluable in identification of cytologic as well as bio-molecular spectral characteristic of oral epithelial neoplasia.
1. Introduction
The current clinical approach to detect and diagnose oral epithelial dysplasia (OED) and oral squamous cell carcinoma (OSCC) uses conventional oral examination (COE) based on white light visualization followed by biopsy and histopathologic diagnosis of suspicious lesions (1, 2). Accurate histopathologic diagnoses rely on several critical steps such as clinical information provided by COE, appropriate identification of biopsy sites and a pathologist’s interpretation of biopsy results (2). A recent meta-analysis of COE reported specificity of 31% with >90% sensitivity for high risk precancerous lesions, noting the difficulties in detecting subsurface abnormalities by COE (3, 4). Additionally, histopathology, the current gold standard for diagnosis, is often limited by intra-observer and inter-observer variations especially in cases of OED (5). There remains need for methods that can augment the current clinical approach to identify OED and OSCC, potentially confirming subsurface features indicative of neoplasia for improved biopsy guidance or detection.
In recent years, multiphoton autofluorescence microscopy (MPAM) has emerged as a promising approach for detection of epithelial microstructural and biochemical alterations, imaging made possible by the inherent contrast from native biomolecules such as NADH, FAD and collagen which show altered homeostasis during neoplasia. MPAM reveals depth-resolved cytologic and architectural features in multilayered tissues with similarities to conventional histopathology (6–9). MPAM also shows the potential for 3-dimensional visualization and analyses with the ability to uniquely visualize and quantify structures not easily seen in standard histology such as the 3D shape of the epithelial-connective tissue interface which is altered in early neoplasia (10). Additionally, biochemical assessment in the form of redox potential can be performed using MPAM with isolation of fluorescence from the metabolic cofactors NADH and FAD (11, 12). The ability to evaluate microstructural and biochemical features has made MPAM a valuable tool in cancer research and a promising method for translation, potentially providing noninvasive detection of neoplasia, as explored in skin (13, 14) and oral mucosa (15, 16).
While further developments in instrumentation are needed to realize potential translation, there is also a need to further understand the spectral signatures arising from MPAM in neoplasia. For example, as indicated, previous MPAM studies examining the epithelium of oral and skin neoplasia have relied on emission from NADH and FAD (maximum emission ~550 nm) but have not closely examined those at longer emission ranges, though traditional fluorescence spectroscopy indicate other potential fluorophores that may be altered with neoplasia including porphyrins having characteristic red emission (17–20). While traditional one-photon fluorescence spectroscopy based on autofluorescence has been widely studied in the context of neoplasia, there are few studies describing spectroscopic assessments with multiphoton excitation, and none previously reported in OSCC. An enhanced understanding of the spectral properties of the epithelium in oral neoplasia in multiphoton autofluorescence microscopy would be valuable to help maximize the potential benefits offered by the technology for both cancer imaging and translational uses.
An advantage of assessing the spectral features of epithelium with multiphoton autofluorescence spectroscopy (MPAS) over traditional one-photon fluorescence spectroscopy is the ability to obtain depth-resolved fluorescence to spatially localize spectroscopic signatures to the sub-cellular scale (femtoliter volume), as opposed to a tissue volume. However, progress in depth-resolved one-photon fluorescence spectroscopy has been made but do not reach the level of ~1 μm axial resolution as nonlinear optical spectroscopy does (20). High axial and lateral resolution of MPAS helps to better delineate the spatial origin of spectral contributors at the sub-cellular level. One recent study in mouse skin reported the basic multiphoton spectral properties in hyperplasia and skin tumors, showing an increase in ratio of NADH/FAD, but also identifying a spectral peak at 570 nm attributed to lipofuscin associated with skin neoplasia (21). No studies describing MPAS have been performed in the case of OSCC, however one multiphoton spectroscopic study of normal oral mucosa reported (7) a characteristic primary ‘blue-green’ emission peak centered at 485–495 nm from the epithelium with 810 nm excitation. Another study examined characteristics of OED without inclusion of OSCC and limited only to blue-green emission under illumination with wavelengths ranging from 780–890 nm (22). The latter study showed spectral peak shifts in OED relative to normal and a decrease in autofluorescence intensity and demonstrated spatially dependent measurement of redox parameters.
It would be of interest to determine the spectral characteristics of OSCC epithelium and determine if new features can be identified to delineate both OED and OSCC from normal oral mucosa. In doing so emission signatures beyond the spectral region expected for NADH and FAD (the primary focus of previous MPAM and MPAS studies) should be assessed. For example, an important metabolite that has not been detected in epithelial neoplasia using MPAS is protoporphyrin IX (PpIX). PpIX is a highly autofluorescent metabolic intermediate of the heme biosynthetic pathway, which is altered due to deregulation of mitochondrial metabolic pathway during development of neoplasia. Increased PpIX biosynthesis in neoplasia is characterized by a sharp peak centered at 635 nm (23, 24) when excited by blue light. PpIX has been reported to contribute to changes in autofluorescence with neoplasia, increasing in clinical OED and OSCC tissue as observed by traditional one-photon fluorescence (25, 26). However, one-photon fluorescence spectroscopy did not allow for high resolution spatial (lateral or depth) localization of the fluorescence and origin of the increased PpIX fluorescence in oral neoplasia remains poorly understood. Depth-resolved spectroscopy and sub-cellular localization of autofluorescence provided by MPAS could provide important information on the epithelial intracellular contributions of PpIX in addition to the traditionally studied metabolites of NADH and FAD. With cancer becoming increasingly recognized as a metabolic disease, the ability to extract information from epithelial metabolites could be useful in the development of strategies for detection of neoplasia using multiphoton methods.
The purpose of this proof-of-principle study was to evaluate the intracellular multiphoton spectroscopic characteristics of oral epithelium in OED and OSCC using MPAS in order to identify unique signatures that could be used to delineate normal oral mucosa from neoplasia. Studies were performed in the in vivo buccal epithelium of a hamster model for OED and OSCC. Characteristic features of the broad autofluorescence peak around 480–520 nm attributed to the metabolic cofactors NADH, FAD and an additional peak at 635 nm attributed to PpIX (visible only in neoplastic tissue) were evaluated and discussed here.
2. Materials and Methods
2.1 Animal Model
All studies were approved by the Institutional Animal Care and Use Committee at the University of Texas Medical branch. A previously described (27, 28) hamster model of OED and OSCC was used in this study. This animal model shows biochemical and histopathologic features similar to human OED and OSCC (29, 30). Neoplasia was induced by topical treatment of DMBA (0.5% in mineral oil) on the left cheek pouch of four weeks old male Golden Syrian Hamsters (Harlan Laboratories; n=17) three times a week for 8–12 weeks. Control hamsters (n=5) were treated with mineral oil following the same method for the same period of time. The DMBA model at these time points demonstrated multiple lesions comprising varying stages of lesions having a keratinizing top layer and ranging from mild OED to OSCC as described previously (27, 31). Animals were anesthetized with intraperitoneal injection of a mixture of 100-mg/kg ketamine and 2.5-mg/kg xylazine prior to spectroscopy and imaging. The left cheek pouch was stretched out, rinsed with PBS and attached on a flat surface using pins. Areas for microscopy and spectroscopy were selected based on visual inspection. Multiphoton imaging and spectroscopy from 21 control, 11 OED and 10 OSCC sites were performed. Imaged sites were biopsied, fixed in 10% neutral buffered formalin and H&E stained for histopathological grading.
2.2 Microscopy/Spectroscopy
A previously described custom-built MPAM system with an incorporated spectrometer was used for this study (22). The system utilizes a Ti:Sapphire femtosecond pulsed (~100fs, 82MHz) laser (Tsunami, Spectra Physics) that is tunable within 700–1000 nm wavelength. MPAM was performed using a 10X, 0.3NA air objective (Plan-Neofluar) with a long working distance, while a 40X 1.2NA C-Apochromat water immersion objective was used for both multiphoton microscopy and spectroscopy. The average laser power for excitation was fixed at 24 mW and was controlled using a variable attenuator that utilizes a half wave plate and Glan-Thompson polarizer (Thorlabs, Newton). For microscopy, a cooled photomultiplier tube (PMT) (R6060, Hamamatsu, Japan) was used to capture 8-bit gray scale images with pixel dimension of 0.625μm/pixel. The spectrometer contained a spectrograph (Acton Research Corporation, Spectra Pro 150) and a calibrated EM CCD (Newton, Andor, Ireland) for detection and recording of spectra. For each site, multiphoton fluorescence image was taken from the epithelium (30 μm depths). Multiphoton spectroscopy was performed on ROIs selected from cytoplasm in epithelial cells using 780 nm excitation and autofluorescence spectra were collected with a spectral resolution of 0.1 nm per pixel in the spectral window of 400–650 nm and an integration time of 10 seconds. The entrance slit separation was 0.25 mm for all measurements and a 300 g/mm grating was used. The system was calibrated using a Mercury-argon light source before experiments were performed. Spectral properties of all optical parts of the system were determined and used for correction of all emission spectra. Recorded spectra were background corrected and processed for removal of sharp spikes due to cosmic rays. A flat field correction was also performed for the wavelength dependence of the CCD camera using standard fluorophores. A translation mirror was used to direct fluorescence emission from sample to either the PMT for microscopy or the spectrometer.
2.3 Hisopathology
For histopathological grading, H&E stained sections were imaged using an Olympus IX71 inverted brightfield microscope with a 20X, 0.75 NA air objective. Grading was performed according to WHO criteria for oral premalignant and malignant lesions (32). Mild, moderate and severe OED were categorized into one OED group.
2.4 Data Analysis
Data was processed using codes written in Matlab. Single factor ANOVA followed by Tukey’s post hoc test for p<0.05 (*) and p<0.01 (**) was performed to assess statistical significance of intensity differences between groups.
3. Results
Representative images from in vivo multiphoton autofluorescence microscopy (MPAM) of hamster oral epithelium are shown in Fig. 1 for 780 nm excitation. Epithelial cells are visualized as dark ellipsoidal nuclei surrounded by bright cytoplasm (Fig. 1a “*” and “→” respectively). Moderate OED (Fig. 1b) and OSCC (Fig. 1c) epithelium showed an overall nuclear enlargement (‘*’ in Fig. 1b), nuclear and cellular pleomorphism with progression of neoplasia when compared with control epithelium (Fig. 1a). Uniform organization of epithelial cells was seen in control epithelium while OED and OSCC was indicated by loss of cellular arrangement and atypical distribution of large and small nuclei in single image planes. The OSCC epithelium shows scattered bright signal (Fig. 1c “→”) which is expected to originate from premature keratinization in undifferentiated epithelial cells. Images from MPAM were utilized to direct spectroscopic assessment and ROIs for MPAS were selected from clearly visible cytoplasm in the epithelium.
Figure 1.
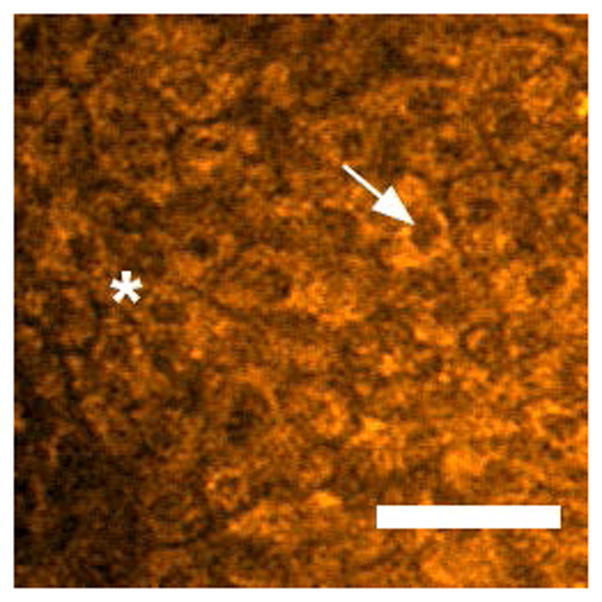
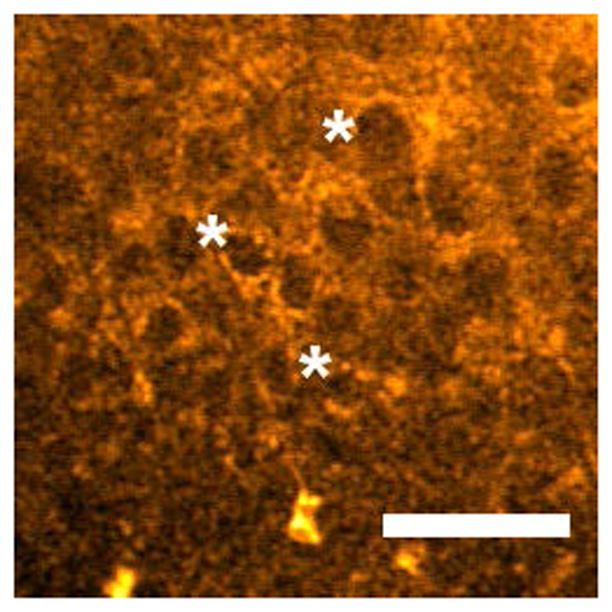
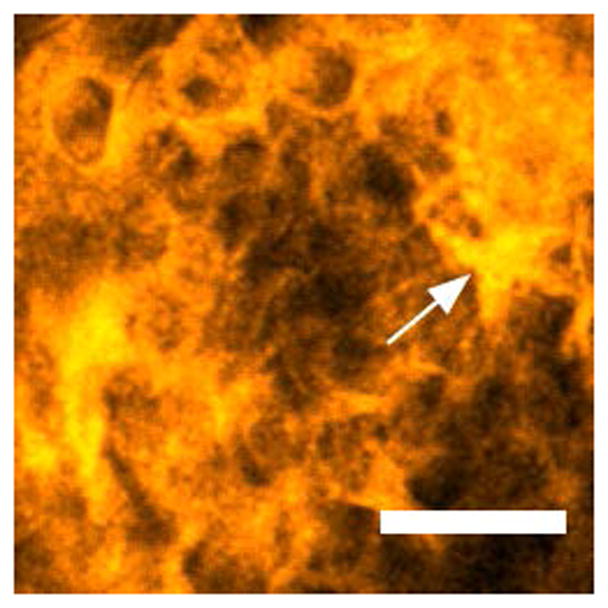
Two-photon autofluorescence images of control (a), moderate OED (b), and OSCC (c) epithelium at 780 nm excitation. “*” and “→” in (a) indicates cytoplasm and nucleus respectively, and “*” in (b) indicates pleomorphic nuclei. “→” in (c) indicates premature keratinization. Scale bar: 50 μm.
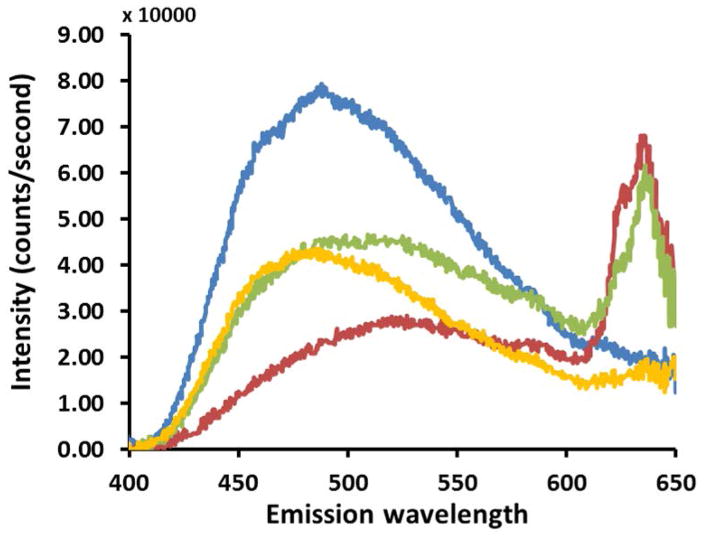
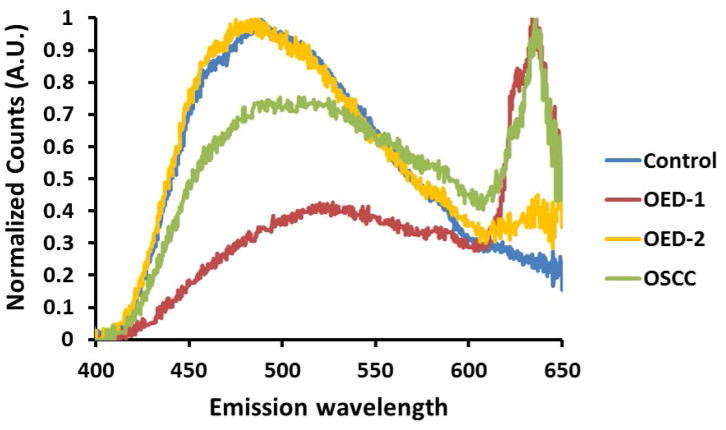
Spectroscopic features of autofluorescence emission from the epithelium of control (blue), OED (red and yellow) and OSCC (green) are shown in Figure 2. Comparing these autofluorescence spectra it is evident that there are differences in spectral peak locations and intensities between control, OED and OSCC. Representative emission spectra recorded in the 400–650 nm spectral range indicates a broad peak centered around 480–520 nm for all three groups (Fig. 2a) of tissues. This blue-green peak is characteristic of cytoplasmic NADH and FAD autofluorescence and is typical for all epithelial tissues. Control epithelium showed one major peak in the blue-green spectral range and no further peak was seen at longer wavelengths. OED and OSCC showed less autofluorescence in the same spectral range compared to control spectra. To compare spectral shape characteristic, spectra from Fig. 2a were normalized to their peak intensities and shown in Fig. 2b. Normalized spectra showed an overall red shift of the main blue-green peak in OED and OSCC. In OED blue shifted spectra were also present, but the majority of samples were red shifted although the overall spectral line shape in the blue-green region stayed same for all three groups.
Figure 2.
In vivo multiphoton autofluorescence spectra obtained from control, OED and OSCC from epithelium of hamster oral mucosa using 780 nm excitation; (a) raw intensity profile showing comparison between control (blue), two representative OED (red and yellow) and OSCC (green) epithelium; (b) same spectra as in (a) normalized to their peak intensities.
Apart from the peak shift in blue-green spectral range a new peak at 635 nm at the wavelength expected for Protoporphyrin IX (PpIX) was evident in OSCC and in some cases of OED. It is clear from Fig. 2 that OSCC produces more autofluorescence than control at 635 nm (red peak), which is expected to arise from PpIX fluorescence. Although, there was a large variation in absolute intensity, it was the dominant peak in most OSCC epithelium. Two representative spectra of OED are shown in Fig. 2 where one is highly fluorescent (red) in the PpIX region while the other one (yellow) showed marginally increased fluorescence than control in the same region. 9 out of 10 OSCC and 6 out of 11 OED tissues evaluated in this study showed this distinct secondary peak.
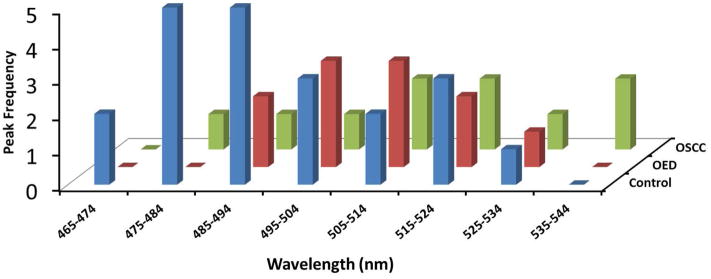
A histogram distribution of blue-green autofluorescence peak for all three pathological groups is shown in Figure 3. As our data suggest there was a larger variation in peak distribution in OED and OSCC than in control (Fig. 3). Also, for most OED and OSCC, blue-green peaks were shifted to longer central wavelengths than control. Median blue-green peak for OED and OSCC were 513 nm and 514.5 nm respectively while for control tissue the blue-green peak was centered at 488 nm. Median peak location was used instead of average, since average peak was less reliable due to high within-group variance in OED and OSCC.
Figure 3.
Distribution of autofluorescence peaks in the 456 nm to 545 nm ranges is shown for control, OED and OSCC. Histograms indicate most samples in the control (blue) group showed a blue-green peak in lower wavelengths while in OED (red) and OSCC (green) showed a wider distribution of the blue-green peak, which was often in the longer wavelengths than control.
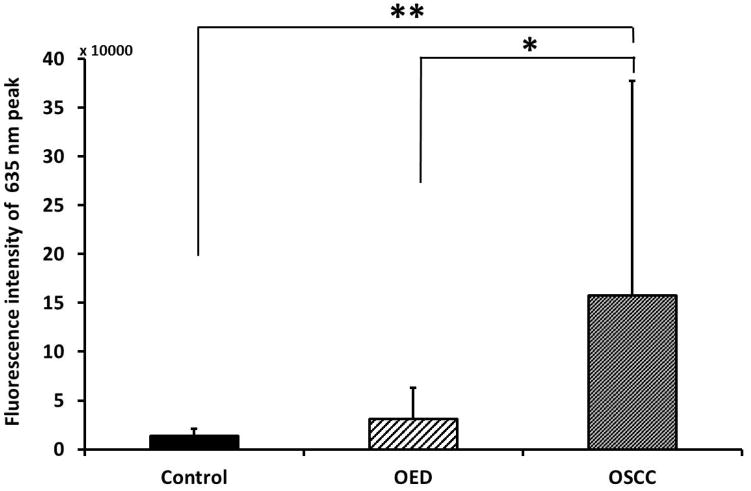
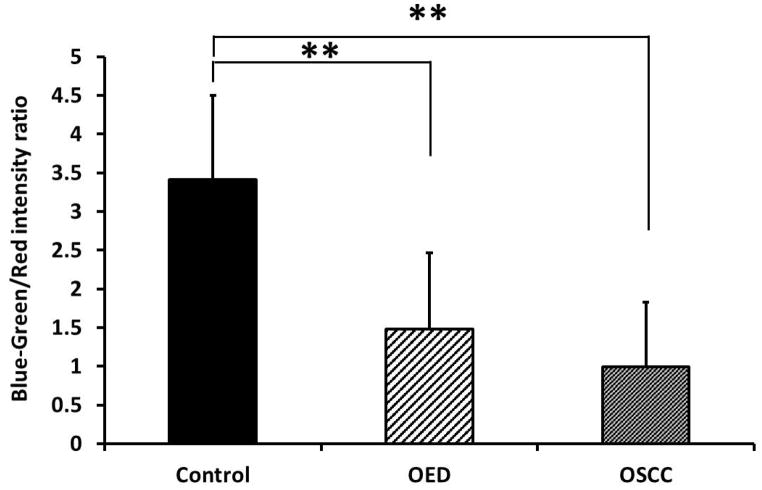
Peak intensity of all samples at 635 nm emission wavelength was calculated and compared as shown in Figure 4a. OSCC showed statistically significant increase in peak intensity from control and OED. The standard deviation of 635 nm peak intensity in OSCC was also very high presumably because of heterogeneity in the tumor microenvironment. In order to quantify relative change in fluorescence between blue-green (480–520 nm) and red (635 nm) fluorescence a ratio parameter was introduced which is shown in Fig. 4b. Since control tissue did not show the distinct secondary peak for PpIX, the blue-green/red intensity ratio in control was significantly higher than OED and OSCC. The 635 nm peak intensity alone (Fig. 4a) was sufficient to allow for differentiation between OSCC and control tissue, but it was not sufficient to separate OED and control. However, when used in conjunction with the blue-green peak intensity (Blue-green/Red intensity ratio) (Fig. 4b) discrimination between OED and control became greater and statistically significant.
Figure 4.
(a) Difference in peak fluorescence intensity at 635 nm emission between control, OED and OSCC; (b) Difference in blue-green/red intensity ratio between control, OED and OSCC. * p < 0.05 and ** p < 0.01.
4. Discussion
This study used the optical sectioning ability of multiphoton fluorescence to reveal the spectroscopic characteristics of oral neoplastic epithelial cells within the native in vivo oral mucosa, with comparisons made to epithelium in normal oral mucosa. The origin of signals investigated were in the cytosol of epithelial cells and results indicated contributions arise from not only the metabolic cofactors NADH and FAD, but also (in the case of OED and OSCC) from PpIX. PpIX is a metabolite formerly studied in the context of one-photon fluorescence methods in which the intracellular origin was not isolated (33, 34) in vivo since contributors to the detected signal included volumes comprising many cells and in traditional spectroscopy cases, multiple epithelial cell layers. NADH and FAD have been the primary fluorophores targeted in previous multiphoton autofluorescence imaging and spectroscopy studies, but PpIX has not previously been evaluated by multiphoton fluorescence methods (7, 11, 21, 22). Thus, the finding of an in vivo intracellular contribution from PpIX shown by multiphoton spectroscopy is new. Further, analysis of MPAS based autofluorescence spectra revealed the potential to delineate normal oral mucosa from OED and OSCC, indicating MPAS could be useful in revealing spectroscopic anomalies in a detection approach for treatable OEDs and OSCC.
Observed spectroscopic changes included differences in intensities of fluorescence from the three metabolites identified as well as spectral shifts in the NADH/FAD band in which the wavelength of the main emission peak changed between control, OED and OSCC epithelium. The blue-green spectral region spanning emission ~450–575 nm is relevant in cancer, increasingly recognized as a metabolic disorder, since the major contributors for autofluorescence in this window are the endogenous metabolic cofactors NADH and FAD (22, 35). Changes in this region can serve as an indication of altered metabolic status in OED and OSCC. As shown, excitation at 780 nm the overall autofluorescence intensity of epithelial cells in the blue-green spectral region was less in neoplastic tissue than control. This particular finding is not surprising as multiphoton spectroscopy in skin SCC and oral OED indicated decreased fluorescence intensity in a similar blue-green spectral window (21, 22). Further this is consistent with the literature involving traditional one-photon fluorescence spectroscopy and imaging of oral cancer (18, 25, 34, 36, 37). What the methods used in this study contribute, is that multiphoton spectroscopy ensures collection of spectral information isolated to a thin optical plane, thus allowing spectral contributions to be isolated to single epithelial cells within the in vivo intact oral mucosa. The ability to induce excitation of fluorophores using near-infrared light at a ~1 μm thick optical section, helps eliminate decreases in detected signals arising from factors such as remodeling of the extracellular matrix which occurs below the plane of focus in the stroma and do not contribute to detected signals as they do in one-photon fluorescence spectroscopy (20). Similarly, effects of blood vessels found below the plane of focus are not expected. A thickened keratinizing layer found in OED could affect intensity since it overlies the epithelium and lead to scattering of remitted emission photons. A recent MPAS study on mouse skin SCC reported difficulties in obtaining high resolution spectral information from depths beyond 48 μm (21). However, high numerical aperture (NA) objectives such as the one used in our study (NA = 1.2) is expected to collect autofluorescence signal more efficiently from deeper layers of the oral mucosa. In this study, epithelial cells were examined close to the surface and did not include highly thickened keratinized lesions, reducing scattering effect and isolating signals to those of the epithelial cells. Future studies should examine lesions with more highly keratinized layers.
Another feature observed in autofluorescence spectra in this study is a shift of the blue-green peak to longer wavelengths in OED and OSCC. Similar red shift in OSCC was also reported in one-photon autofluorescence spectroscopy for multiple excitation wavelengths ranging from 330 nm to 470 nm (20, 33). However, these studies did not evaluate peak shifts in OED. Although in our study median peaks in OED and OSCC were red shifted with respect to control, average peak for OED did not show significant red shift from control. In a previous study, our group reported a blue shift of the primary blue-green peak in moderate and severe OED (22), rather than the red shift seen in OSCC and in some cases of OED. The varying direction of spectral shift may be a consequence of metabolic deregulation in neoplasia such as shifts to higher or lower redox potential (higher NADH relative to FAD in higher redox potential) in various microenvironments (e.g. hypoxia, nutrient availability). Another scenario that may result in shifts to longer wavelengths could be a thickened keratinizing layer with increased scattering from keratin (38). Additional studies examining the factors noted above including degree of hyperkeratinization, degree and direction of spectral shifts and contribution of NADH and FAD in epithelial autofluorescence spectra is required to further understand the noted shifts.
A significant finding in this MPAS study was a sharp peak at 635 nm which was present in all OSCC while only a subpopulation of OED revealed such a peak. We attribute the peak at 635 nm to be from PpIX – and more specifically being the intracellular contribution of PpIX. This peak matches the expected wavelength and shape of PpIX fluorescence, reported extensively in the literature for one-photon autofluorescence spectroscopic detection of oral neoplasia (25, 33, 39). A secondary peak at 705 nm was not detected in the optical setup with optical components in this system blocking detection of fluorescecnce above 650 nm. PpIX fluorescence has not previously been reported by the method of multiphoton imaging or spectroscopy. In the past, increased fluorescence in red spectral region typically within 630–640 nm has been observed in OSCC (18, 20, 25) with one-photon excitation at 405 nm or 410 nm. De Veld et al. showed the presence of a peak at 638 nm in the center of tumors but not in the periphery where tissues were dysplastic or benign (25, 40). In some studies, PpIX fluorescence in tumors from animals and humans has been attributed to be of bacterial origin, while in others it has been suggested to be an endogenous origin (18, 41). Further, PpIX attributed to an endogenous contribution, has been shown to change in oral cancer (23, 42, 43).
Since PpIX is a critical metabolite involved in the heme biosynthetic pathway, and produced in mitochondria of epithelial cells (44), it is expected that alterations in this fluorophore should occur with neoplasia. PpIX is produced during heme biosynthesis, a process negatively correlated with mitochondrial metabolism such as tricarboxylic acid (TCA) cycle and oxidative phosphorylation (45). As mitochondrial metabolism is affected by the oxygen tension (hypoxia) across a tumor microenvironment, PpIX biosynthesis is also affected during neoplastic development (46). The method employed in this study ensured signals obtained from the 635 nm peak attributed to PpIX arise specifically from the cytosol of neoplastic epithelial cells, providing a way to show that changes in this peak arise from endogenous alterations in metabolic functions. As discussed below, a further implication is that since PpIX plays a role in tissue metabolism, this opens up studies for examining metabolic alterations based on an additional metabolite to NADH and FAD. The intracellular origin of PpIX fluorescence can be further investigated employing methods of cell and molecular biology to isolate neoplastic cells from OED and OSCC sites and PpIX detected by flow cytometry.
The contributors to spectra in this study are attributed to NADH, FAD, and PpIX. These are important metabolites that can be altered in the neoplastic microenvironment. In tumors energy production primarily relies on glycolysis (Warburg effect) which is facilitated by a hypoxic microenvironment (47). In mild/moderate hypoxic tumor microenvironment with upregulated glycolysis, more energy efficient mitochondrial metabolic processes are downregulated (48). Thus, neoplastic cells show increased levels of NADH leading to a loss of the tight regulation of NADH/FAD balance altering the autofluorescence spectra. Hypoxia induced downregulation of mitochondrial energy production leads to activation of heme biosynthesis and hence elevated levels of PpIX to avoid accumulation of metabolic intermediates (45). The complex architecture of tumor microenvironment however does not allow for a uniform oxygen tension across the tumor mass (49). The dynamic nature of angiogenic blood vessels creates areas of mild, severe or acute hypoxia as well as areas of high oxygen availability (50). Depending on the degree of hypoxia neoplastic tissues might be severely deprived of nutrients leading to downregulation of glycolysis and activation of mitochondrial metabolism through glutamine metabolic pathway (51). Activation of mitochondrial metabolism also leads to reduced heme and thus PpIX biosynthesis because of the limited oxygen availability in a severe hypoxic or anoxic condition (46). Therefore, the regulation of PpIX biosynthesis is altered in neoplasia and the relative amount of intracellular NADH, FAD and PpIX could indicate the hypoxic nature, and a heterogeneous tumor microenvironment. Understanding the variations in autofluorescence spectral contributions from NADH, FAD and PpIX using MPAS could be helpful to in vivo layer resolved studies of tumor microenvironment and should be explored in context of full mucosal assessment.
MPAS based autofluorescence spectroscopy enabled delineation of normal from neoplastic oral mucosa and could be assessed together with additional detection methods. Fiber based MPAM systems are currently being developed and tested for deep tissue in vivo imaging with the goal of potential translation in to clinic (52, 53). These imaging systems have shown potential for imaging and detecting cytologic and architectural features in vivo in human skin (54) but there is no known fiber based MPAS systems that can be readily applied in human subjects. Spectroscopic features identified by multiphoton excitation could provide additional metabolic information to previously established MPAM based cytologic and microstructural assessment of neoplasia. Development of multiphoton fluorescence based endoscopic probes for use in human oral cavity would ensure further testing of these optical signatures in a clinical setting. While no systems exist yet for the oral cavity, continuing efforts have opened new avenues for development of fiber based MPAM-MPAS systems suitable for oral cavity imaging for noninvasive detection of neoplasia.
In conclusion, this study describes assessment of MPAS characteristic features for characterization of intracellular spectroscopic signatures that could be used in the detection oral epithelial neoplasia. PpIX-like fluorescence at 635 nm and the blue-green vs red intensity ratio were identified as spectroscopic signatures of neoplasia from MPAS. Additionally, the PpIX-like fluorescence was identified in the cytoplasm of neoplastic epithelial cells indicating an endogenous origin of this fluorophore. Further assessment of the balance of NADH, FAD and PpIX under different tumor microenvironment may inform as to the alterations in metabolic processes that aid in the progression of neoplasia. Characterization of spectral properties for OED and OSCC epithelium using multiphoton excitation may serve as a platform for future studies combining MPAM and MPAS for multimodal detection of epithelial neoplasia.
Acknowledgments
Financial support for all authors:
Cancer Prevention and Research Institute of Texas (RP150449) and National Cancer Institute (R01 CA127429-01, R01 CA127429-01A2S1)
Footnotes
The authors have no potential conflicts of interest to disclose.
References
- 1.Scully C, Bagan JV, Hopper C, Epstein JB. Oral cancer: current and future diagnostic techniques. American journal of dentistry. 2008;21(4):199–209. Epub 2008/09/18. [PubMed] [Google Scholar]
- 2.Poh CF, Ng S, Berean KW, Williams PM, Rosin MP, Zhang L. Biopsy and histopathologic diagnosis of oral premalignant and malignant lesions. J Can Dent Assoc. 2008;74(3):283–8. Epub 2008/04/05. [PubMed] [Google Scholar]
- 3.Ye X, Zhang J, Tan Y, Chen G, Zhou G. Meta-analysis of two computer-assisted screening methods for diagnosing oral precancer and cancer. Oral oncology. 2015;51(11):966–75. doi: 10.1016/j.oraloncology.2015.09.002. Epub 2015/09/20. [DOI] [PubMed] [Google Scholar]
- 4.Luo X, Xu H, He M, Han Q, Wang H, Sun C, Li J, Jiang L, Zhou Y, Dan H, Feng X, Zeng X, Chen Q. Accuracy of autofluorescence in diagnosing oral squamous cell carcinoma and oral potentially malignant disorders: a comparative study with aero-digestive lesions. Scientific reports. 2016;6:29943. doi: 10.1038/srep29943. Epub 2016/07/16. [DOI] [PMC free article] [PubMed] [Google Scholar]
- 5.Mehrotra R, Gupta DK. Exciting new advances in oral cancer diagnosis: avenues to early detection. Head & neck oncology. 2011;3:33. doi: 10.1186/1758-3284-3-33. Epub 2011/07/30. [DOI] [PMC free article] [PubMed] [Google Scholar]
- 6.Sun J, Shilagard T, Bell B, Motamedi M, Vargas G. In vivo multimodal nonlinear optical imaging of mucosal tissue. Optics express. 2004;12(11):2478–86. doi: 10.1364/opex.12.002478. [DOI] [PubMed] [Google Scholar]
- 7.Zhuo S, Chen J, Jiang X, Xie S, Chen R, Cao N, Zou Q, Xiong S. The layered-resolved microstructure and spectroscopy of mouse oral mucosa using multiphoton microscopy. Physics in medicine and biology. 2007;52(16):4967–80. doi: 10.1088/0031-9155/52/16/017. [DOI] [PubMed] [Google Scholar]
- 8.Wilder-Smith P, Osann K, Hanna N, El Abbadi N, Brenner M, Messadi D, Krasieva T. In vivo multiphoton fluorescence imaging: a novel approach to oral malignancy. Lasers in surgery and medicine. 2004;35(2):96–103. doi: 10.1002/lsm.20079. [DOI] [PubMed] [Google Scholar]
- 9.Skala MC, Squirrell JM, Vrotsos KM, Eickhoff JC, Gendron-Fitzpatrick A, Eliceiri KW, Ramanujam N. Multiphoton microscopy of endogenous fluorescence differentiates normal, precancerous, and cancerous squamous epithelial tissues. Cancer Res. 2005;65(4):1180–6. doi: 10.1158/0008-5472.can-04-3031. Epub 2005/03/01. [DOI] [PMC free article] [PubMed] [Google Scholar]
- 10.Pal R, Shilagard T, Yang J, Villarreal P, Brown T, Qiu S, McCammon S, Resto V, Vargas G. Remodeling of the Epithelial-Connective Tissue Interface in Oral Epithelial Dysplasia as Visualized by Noninvasive 3D Imaging. Cancer Res. 2016;76(16):4637–47. doi: 10.1158/0008-5472.CAN-16-0252. [DOI] [PMC free article] [PubMed] [Google Scholar]
- 11.Skala MC, Riching KM, Gendron-Fitzpatrick A, Eickhoff J, Eliceiri KW, White JG, Ramanujam N. In vivo multiphoton microscopy of NADH and FAD redox states, fluorescence lifetimes, and cellular morphology in precancerous epithelia. Proceedings of the National Academy of Sciences of the United States of America. 2007;104(49):19494–9. doi: 10.1073/pnas.0708425104. Epub 2007/11/29. [DOI] [PMC free article] [PubMed] [Google Scholar]
- 12.Rice WL, Kaplan DL, Georgakoudi I. Two-photon microscopy for non-invasive, quantitative monitoring of stem cell differentiation. PloS one. 2010;5(4):e10075. doi: 10.1371/journal.pone.0010075. [DOI] [PMC free article] [PubMed] [Google Scholar]
- 13.Balu M, Zachary CB, Harris RM, Krasieva TB, Konig K, Tromberg BJ, Kelly KM. In Vivo Multiphoton Microscopy of Basal Cell Carcinoma. JAMA dermatology. 2015;151(10):1068–74. doi: 10.1001/jamadermatol.2015.0453. Epub 2015/04/25. [DOI] [PMC free article] [PubMed] [Google Scholar]
- 14.Tsai TH, Jee SH, Dong CY, Lin SJ. Multiphoton microscopy in dermatological imaging. Journal of dermatological science. 2009;56(1):1–8. doi: 10.1016/j.jdermsci.2009.06.008. Epub 2009/08/25. [DOI] [PubMed] [Google Scholar]
- 15.Wilder-Smith P, Krasieva T, Jung WG, Zhang J, Chen Z, Osann K, Tromberg B. Noninvasive imaging of oral premalignancy and malignancy. J Biomed Opt. 2005;10(5):051601. doi: 10.1117/1.2098930. Epub 2005/11/19. [DOI] [PubMed] [Google Scholar]
- 16.Vargas G, Shilagard T, Ho KH, McCammon S. Multiphoton autofluorescence microscopy and second harmonic generation microscopy of oral epithelial neoplasms. Conf Proc IEEE Eng Med Biol Soc. 2009;2009:6311–3. doi: 10.1109/iembs.2009.5332783. Epub 2009/12/08. [DOI] [PMC free article] [PubMed] [Google Scholar]
- 17.Palero JA, de Bruijn HS, van der Ploeg van den Heuvel A, Sterenborg HJ, Gerritsen HC. Spectrally resolved multiphoton imaging of in vivo and excised mouse skin tissues. Biophysical journal. 2007;93(3):992–1007. doi: 10.1529/biophysj.106.099457. [DOI] [PMC free article] [PubMed] [Google Scholar]
- 18.Gillenwater A, Jacob R, Ganeshappa R, Kemp B, El-Naggar AK, Palmer JL, Clayman G, Mitchell MF, Richards-Kortum R. Noninvasive diagnosis of oral neoplasia based on fluorescence spectroscopy and native tissue autofluorescence. Archives of otolaryngology--head & neck surgery. 1998;124(11):1251–8. doi: 10.1001/archotol.124.11.1251. [DOI] [PubMed] [Google Scholar]
- 19.Skala MC, Palmer GM, Zhu C, Liu Q, Vrotsos KM, Marshek-Stone CL, Gendron-Fitzpatrick A, Ramanujam N. Investigation of fiber-optic probe designs for optical spectroscopic diagnosis of epithelial pre-cancers. Lasers in surgery and medicine. 2004;34(1):25–38. doi: 10.1002/lsm.10239. [DOI] [PMC free article] [PubMed] [Google Scholar]
- 20.Schwarz RA, Gao W, Daye D, Williams MD, Richards-Kortum R, Gillenwater AM. Autofluorescence and diffuse reflectance spectroscopy of oral epithelial tissue using a depth-sensitive fiber-optic probe. Applied optics. 2008;47(6):825–34. doi: 10.1364/ao.47.000825. [DOI] [PMC free article] [PubMed] [Google Scholar]
- 21.Thomas G, van Voskuilen J, Truong H, Song JY, Gerritsen HC, Sterenborg HJ. In vivo nonlinear spectral imaging as a tool to monitor early spectroscopic and metabolic changes in a murine cutaneous squamous cell carcinoma model. Biomedical optics express. 2014;5(12):4281–99. doi: 10.1364/BOE.5.004281. Epub 2015/01/13. [DOI] [PMC free article] [PubMed] [Google Scholar]
- 22.Edward K, Qiu S, Resto V, McCammon S, Vargas G. In vivo layer-resolved characterization of oral dysplasia via nonlinear optical micro-spectroscopy. Biomedical optics express. 2012;3(7):1579–93. doi: 10.1364/BOE.3.001579. [DOI] [PMC free article] [PubMed] [Google Scholar]
- 23.Inaguma M, Hashimoto K. Porphyrin-like fluorescence in oral cancer: In vivo fluorescence spectral characterization of lesions by use of a near-ultraviolet excited autofluorescence diagnosis system and separation of fluorescent extracts by capillary electrophoresis. Cancer. 1999;86(11):2201–11. doi: 10.1002/(sici)1097-0142(19991201)86:11<2201::aid-cncr5>3.0.co;2-9. [DOI] [PubMed] [Google Scholar]
- 24.Ghadially FN. Red fluoescence of experimentally induced and human tumours. The Journal of pathology and bacteriology. 1960;80:345–51. doi: 10.1002/path.1700800218. Epub 1960/10/01. [DOI] [PubMed] [Google Scholar]
- 25.de Veld DC, Skurichina M, Witjes MJ, Duin RP, Sterenborg HJ, Roodenburg JL. Clinical study for classification of benign, dysplastic, and malignant oral lesions using autofluorescence spectroscopy. J Biomed Opt. 2004;9(5):940–50. doi: 10.1117/1.1782611. [DOI] [PubMed] [Google Scholar]
- 26.Onizawa K, Okamura N, Saginoya H, Yoshida H. Characterization of autofluorescence in oral squamous cell carcinoma. Oral oncology. 2003;39(2):150–6. doi: 10.1016/s1368-8375(02)00036-2. Epub 2003/01/03. [DOI] [PubMed] [Google Scholar]
- 27.Gimenez-Conti I. The hamster cheek pouch carcinogenesis model. Acta odontologica latinoamericana : AOL. 1993;7(1):3–12. Epub 1993/01/01. [PubMed] [Google Scholar]
- 28.White FH, Gohari K, Smith CJ. Histological and ultrastructural morphology of 7,12 dimethylbenz(alpha)-anthracene carcinogenesis in hamster cheek pouch epithelium. Diagnostic histopathology. 1981;4(4):307–33. Epub 1981/10/01. [PubMed] [Google Scholar]
- 29.Derka S, Vairaktaris E, Papakosta V, Vassiliou S, Acil Y, Vylliotis A, Spyridonidou S, Lazaris AC, Mourouzis C, Kokkori A, Moulavasili P, Perrea D, Donta I, Yapijakis C, Patsouris E. Cell proliferation and apoptosis culminate in early stages of oral oncogenesis. Oral oncology. 2006;42(5):540–50. doi: 10.1016/j.oraloncology.2005.10.008. Epub 2006/02/09. [DOI] [PubMed] [Google Scholar]
- 30.Papakosta V, Vairaktaris E, Vylliotis A, Derka S, Nkenke E, Vassiliou S, Lazaris A, Mourouzis C, Rallis G, Spyridonidou S, Anagnostopoulou S, Perrea D, Donta I, Yapijakis C, Patsouris E. The co-expression of c-myc and p53 increases and reaches a plateau early in oral oncogenesis. Anticancer research. 2006;26(4B):2957–62. Epub 2006/08/05. [PubMed] [Google Scholar]
- 31.Vairaktaris E, Spyridonidou S, Papakosta V, Vylliotis A, Lazaris A, Perrea D, Yapijakis C, Patsouris E. The hamster model of sequential oral oncogenesis. Oral oncology. 2008;44(4):315–24. doi: 10.1016/j.oraloncology.2007.08.015. Epub 2007/12/07. [DOI] [PubMed] [Google Scholar]
- 32.Poh CF, Ng S, Berean KW, Williams PM, Rosin MP, Zhang L. Biopsy and histopathologic diagnosis of oral premalignant and malignant lesions. J Can Dent Assoc. 2008;74(3):283–8. Epub 2008/04/05. [PubMed] [Google Scholar]
- 33.Vengadesan N, Aruna P, Ganesan S. Characterization of native fluorescence from DMBA-treated hamster cheek pouch buccal mucosa for measuring tissue transformation. British journal of cancer. 1998;77(3):391–5. doi: 10.1038/bjc.1998.62. [DOI] [PMC free article] [PubMed] [Google Scholar]
- 34.De Veld DC, Witjes MJ, Sterenborg HJ, Roodenburg JL. The status of in vivo autofluorescence spectroscopy and imaging for oral oncology. Oral oncology. 2005;41(2):117–31. doi: 10.1016/j.oraloncology.2004.07.007. [DOI] [PubMed] [Google Scholar]
- 35.Drezek R, Brookner C, Pavlova I, Boiko I, Malpica A, Lotan R, Follen M, Richards-Kortum R. Autofluorescence microscopy of fresh cervical-tissue sections reveals alterations in tissue biochemistry with dysplasia. Photochem Photobiol. 2001;73(6):636–41. doi: 10.1562/0031-8655(2001)073<0636:AMOFCT>2.0.CO;2. Epub 2001/06/26. [DOI] [PubMed] [Google Scholar]
- 36.Venugopal C, Nazeer SS, Balan A, Jayasree RS. Autofluorescence spectroscopy augmented by multivariate analysis as a potential noninvasive tool for early diagnosis of oral cavity disorders. Photomedicine and laser surgery. 2013;31(12):605–12. doi: 10.1089/pho.2013.3547. [DOI] [PubMed] [Google Scholar]
- 37.Pavlova I, Weber CR, Schwarz RA, Williams MD, Gillenwater AM, Richards-Kortum R. Fluorescence spectroscopy of oral tissue: Monte Carlo modeling with site-specific tissue properties. J Biomed Opt. 2009;14(1):014009. doi: 10.1117/1.3065544. [DOI] [PMC free article] [PubMed] [Google Scholar]
- 38.Wu Y, Qu JY. Autofluorescence spectroscopy of epithelial tissues. J Biomed Opt. 2006;11(5):054023. doi: 10.1117/1.2362741. Epub 2006/11/10. [DOI] [PubMed] [Google Scholar]
- 39.Yuvaraj M, Udayakumar K, Jayanth V, Prakasa Rao A, Bharanidharan G, Koteeswaran D, Munusamy BD, Murali Krishna C, Ganesan S. Fluorescence spectroscopic characterization of salivary metabolites of oral cancer patients. J Photochem Photobiol B. 2014;130:153–60. doi: 10.1016/j.jphotobiol.2013.11.006. [DOI] [PubMed] [Google Scholar]
- 40.de Veld DC, Bakker Schut TC, Skurichina M, Witjes MJ, Van der Wal JE, Roodenburg JL, Sterenborg HJ. Autofluorescence and Raman microspectroscopy of tissue sections of oral lesions. Lasers Med Sci. 2005;19(4):203–9. doi: 10.1007/s10103-004-0325-7. [DOI] [PubMed] [Google Scholar]
- 41.Ingrams DR, Dhingra JK, Roy K, Perrault DF, Jr, Bottrill ID, Kabani S, Rebeiz EE, Pankratov MM, Shapshay SM, Manoharan R, Itzkan I, Feld MS. Autofluorescence characteristics of oral mucosa. Head & neck. 1997;19(1):27–32. doi: 10.1002/(sici)1097-0347(199701)19:1<27::aid-hed5>3.0.co;2-x. Epub 1997/01/01. [DOI] [PubMed] [Google Scholar]
- 42.Silveira L, Jr, Paleckis LG, Nicolau RA, Nogueira GV, Busanello RZ, Mardegan DA, Fonseca SM, Zangaro RA, Pacheco MT. Detection of induced neoplastic lesions in the oral mucosa of hamsters using fluorescence spectroscopy. Revista da Associacao Medica Brasileira. 2004;50(3):297–301. doi: 10.1590/s0104-42302004000300038. S0104-42302004000300038. [DOI] [PubMed] [Google Scholar]
- 43.Wang CY, Tsai T, Chiang CP, Chen HM, Chen CT. Improved diagnosis of oral premalignant lesions in submucous fibrosis patients with 5-aminolevulinic acid induced PpIX fluorescence. J Biomed Opt. 2009;14(4):044026. doi: 10.1117/1.3200934. [DOI] [PubMed] [Google Scholar]
- 44.Olivo M, Bhuvaneswari R, Keogh I. Advances in bio-optical imaging for the diagnosis of early oral cancer. Pharmaceutics. 2011;3(3):354–78. doi: 10.3390/pharmaceutics3030354. Epub 2011/01/01. [DOI] [PMC free article] [PubMed] [Google Scholar]
- 45.Yang X, Palasuberniam P, Kraus D, Chen B. Aminolevulinic Acid-Based Tumor Detection and Therapy: Molecular Mechanisms and Strategies for Enhancement. International journal of molecular sciences. 2015;16(10):25865–80. doi: 10.3390/ijms161025865. Epub 2015/10/31. [DOI] [PMC free article] [PubMed] [Google Scholar]
- 46.Otsuka S, Matsumoto K, Nakajima M, Tanaka T, Ogura S. Oxygen Availability for Porphyrin Biosynthesis Enzymes Determines the Production of Protoporphyrin IX (PpIX) during Hypoxia. PloS one. 2015;10(12):e0146026. doi: 10.1371/journal.pone.0146026. [DOI] [PMC free article] [PubMed] [Google Scholar]
- 47.Courtnay R, Ngo DC, Malik N, Ververis K, Tortorella SM, Karagiannis TC. Cancer metabolism and the Warburg effect: the role of HIF-1 and PI3K. Molecular biology reports. 2015;42(4):841–51. doi: 10.1007/s11033-015-3858-x. Epub 2015/02/19. [DOI] [PubMed] [Google Scholar]
- 48.Eales KL, Hollinshead KE, Tennant DA. Hypoxia and metabolic adaptation of cancer cells. Oncogenesis. 2016;5:e190. doi: 10.1038/oncsis.2015.50. Epub 2016/01/26. [DOI] [PMC free article] [PubMed] [Google Scholar]
- 49.Eales KL, Hollinshead KER, Tennant DA. Hypoxia and metabolic adaptation of cancer cells. Oncogenesis. 2016;5 doi: 10.1038/oncsis.2015.50. ARTN e190. [DOI] [PMC free article] [PubMed] [Google Scholar]
- 50.Dewhirst MW. Relationships between Cycling Hypoxia, HIF-1, Angiogenesis and Oxidative Stress. Radiat Res. 2009;172(6):653–65. doi: 10.1667/RR1926.1. [DOI] [PMC free article] [PubMed] [Google Scholar]
- 51.Michalak KP, Mackowska-Kedziora A, Sobolewski B, Wozniak P. Key Roles of Glutamine Pathways in Reprogramming the Cancer Metabolism. Oxidative medicine and cellular longevity. 2015;2015:964321. doi: 10.1155/2015/964321. Epub 2015/11/20. [DOI] [PMC free article] [PubMed] [Google Scholar]
- 52.Rivera DR, Brown CM, Ouzounov DG, Pavlova I, Kobat D, Webb WW, Xu C. Compact and flexible raster scanning multiphoton endoscope capable of imaging unstained tissue. Proceedings of the National Academy of Sciences of the United States of America. 2011;108(43):17598–603. doi: 10.1073/pnas.1114746108. Epub 2011/10/19. [DOI] [PMC free article] [PubMed] [Google Scholar]
- 53.Rivera DR, Brown CM, Ouzounov DG, Webb WW, Xu C. Use of a lensed fiber for a large-field-of-view, high-resolution, fiber-scanning microendoscope. Optics letters. 2012;37(5):881–3. doi: 10.1364/ol.37.000881. Epub 2012/03/02. [DOI] [PubMed] [Google Scholar]
- 54.Balu M, Lentsch G, Korta DZ, Konig K, Kelly KM, Tromberg BJ, Zachary CB. In vivo multiphoton-microscopy of picosecond-laser-induced optical breakdown in human skin. Lasers in surgery and medicine. 2017 doi: 10.1002/lsm.22655. Epub 2017/03/24. [DOI] [PMC free article] [PubMed] [Google Scholar]


