

Abstract
Tea tree oil (TTO) is a volatile essential oil obtained from the leaves of the Australian tree Melaleuca alternifolia by vapor distillation. Previously, we demonstrated that TTO has a strong inhibitory effect on Botrytis cinerea. This study investigates the underlying antifungal mechanisms at the molecular level. A proteomics approach using isobaric tags for relative and absolute quantification (iTRAQ) was adopted to investigate the effects of TTO on B. cinerea. A total of 718 differentially expression proteins (DEPs) were identified in TTO-treated samples, 17 were markedly up-regulated and 701 were significantly down-regulated. Among the 718 DEPs, 562 were annotated and classified into 30 functional groups by GO (gene ontology) analysis. KEGG (Kyoto Encyclopedia of Genes and Genomes) enrichment analysis linked 562 DEPs to 133 different biochemical pathways, involving glycolysis, the tricarboxylic acid cycle (TCA cycle), and purine metabolism. Additional experiments indicated that TTO destroys cell membranes and decreases the activities of three enzymes related to the TCA cycle. Our results suggest that TTO treatment inhibits glycolysis, disrupts the TCA cycle, and induces mitochondrial dysfunction, thereby disrupting energy metabolism. This study provides new insights into the mechanisms underlying the antifungal activity of essential oils.
Keywords: iTRAQ, proteomics, essential oil, Botrytis cinerea, antifungal
Introduction
Botrytis cinerea, one of the most destructive fungal pathogens, causing gray mold rot in a wide range of fresh fruits and vegetables. The resulting reduction in shelf life is responsible for enormous economic losses in the produce industry. Although chemical fungicides are widely used to control the incidence of the disease, this practice potentially introduces harmful substances into the food chain, and also selects for B. cinerea strains with increased drug resistance (Brul and Coote, 1999; Leroux et al., 2002). These limitations provide a strong stimulus to explore safer and more effective antifungal agents. Essential oils are promising natural substitutes that offer disease control by inhibiting pathogen growth (Prakash et al., 2012). For example, the essential oils of Angelica archangelica L. (Apiaceae) roots and Solidago canadensis L. have been characterized and tested in vitro as antifungal agents against B. cinerea (Fraternale et al., 2014; Liu et al., 2016). Lemongrass essential oil significantly reduces the incidence of B. cinerea and prolongs the shelf-life and sensory properties of frozen mussels and vegetables (Abdulazeez et al., 2016). Essential oils of aromatic plants, which belong to the Lamiacea family such as origanum (Origanum syriacum L. var. bevanii), lavender (Lavandula stoechas L. var. stoechas) and rosemary (Rosmarinus officinalis L.), have been reported to cause considerable morphological degenerations of the fungal hyphae of B. cinerea and suppress in vivo disease development on tomato against B. cinerea (Soylu et al., 2010).
Tea tree oil (TTO) is a volatile natural plant essential oil obtained from the leaves of the Australian tree Melaleuca alternifolia by vapor distillation (Homer et al., 2000). The oil exhibits a broad spectrum of antimicrobial activities against a variety of bacteria, fungi, and virus (Carson et al., 2006; Miao et al., 2016). Growth and metabolic activity of Escherichia coli and Candida albicans are inhibited after treatment with TTO (Gustafson et al., 1998; Bona et al., 2016). Our previous studies showed that TTO treatment effectively inhibits spore germination and mycelial growth of B. cinerea, modifies its morphology and cellular ultrastructure, and controls gray mold on strawberry and cherry fruits (Shao et al., 2013a; Li et al., 2017a). TTO's antifungal mechanism in B. cinerea involves the loss of membrane integrity and the subsequent release of intracellular compounds, probably due in part to changes in membrane fatty acid and ergosterol composition (Shao et al., 2013b; Li et al., 2017a). TTO also causes mitochondrial damage in B. cinerea, disrupting the tricarboxylic acid (TCA) cycle and leading to the accumulation of reactive oxygen species (ROS) (Li et al., 2017b). Metabolomic analysis by quadrupole time-of-flight mass spectrometer was consistent with these results (Xu et al., 2017). However, the molecular mechanisms underlying the effects of TTO against B. cinerea have not yet been associated with specific proteins.
Proteomics can be used to study the changes in protein levels under stress conditions in great detail (Franco et al., 2013), and has been applied to investigate the mode of action of the antimicrobial agent apidaecin IB against membrane proteins in E. coli cells (Zhou and Chen, 2011). Other studies have revealed that proteins related to energy and DNA metabolism, and amino acid biosynthesis are down-regulated in E. coli JK-17 in the presence of rose flower extract (Cho and Oh, 2011). Syzygium aromaticum essential oil perturbs the expression of virulence-related genes involved in the synthesis of serine protease, flagella, and lipopolysaccharide in Campylobacter jejuni (Kovács et al., 2016). In this study, we conducted a proteomics analysis using isobaric tags for relative and absolute quantification (iTRAQ) to study B. cinerea to identify proteins and potential mechanisms underlying the antifungal activity of TTO.
Materials and methods
B. cinerea growth and exposure to TTO
Highly virulent B. cinerea (ACCC 36028) was purchased from the Agricultural Culture Collection of China and grown at 25°C on potato dextrose agar (PDA, containing 1 L potato liquid, 20 g/L glucose, and 15 g/L agar) before use. TTO was purchased from Fuzhou Merlot Lotus Biological Technology Company (Fujian Province, China). The primary components of TTO are terpinen-4-ol (37.11%), γ-terpinene (20.65%), α-terpinene (10.05%), 1, 8-cineole (4.97%), terpinolene (3.55%), ρ-cymene (2.14%), and α-terpineol (3.82%), as specified by the supplier. B. cinerea cultures were maintained on PDA at 25°C for 3 days. Spore suspensions were harvested by adding 10 mL sterile 0.9% NaCl solution to each petri dish and then gently scraping the mycelial surface three times with a sterile L-shaped spreader to free the spores. The spore suspension was adjusted using a hemocytometer to 5 × 10⁶ spores/mL. One milliliter suspension was inoculated into 250 mL flasks containing 150 mL sterile potato dextrose broth medium and cultured at 25°C on a rotary shaker at 150 revolutions per minute for 3 days. Before mycelia were harvested, TTO was added to the medium to a final concentration of 5 mL/L, and cultures incubated for another 2 h (Xu et al., 2017). Mycelia were collected and rinsed three times with 0.1 M phosphate buffered saline (PBS) (pH 7.4). Samples were stored at −80°C. Cultures without TTO were used as a control. Three samples were prepared in parallel for each condition.
Protein extraction
Approximately 200 mg of frozen mixed mycelium from control or TTO treated cultures was ground into powder in liquid nitrogen and suspended in 25 mL 10% (v/v) trichloroacetic acid in acetone containing 65 mM dithiothreitol (DTT). The suspension was vortexed and incubated at −20°C for 2 h, centrifuged at 12,000 × g for 45 min at 4°C, and the supernatant discarded. The precipitate was rinsed three times with chilled acetone. The pellet was vacuum dried and dissolved in lysis buffer (4% SDS, 100 mM Tris-HCl, 100 mM DTT, pH 8.0). After incubation for 5 min in boiling water, the suspension was sonicated on ice at 50 W for 5 min. The crude extract was incubated in boiling water again for 5 min, and clarified by centrifugation at 14,000 × g for 40 min at 20°C. To digest protein in the supernatant, 200 μL UA buffer (8 M urea, 150 mM Tris-HCl, pH 8.5) was added and the mixture was centrifuged at 14,000 × g for 30 min at room temperature. This step was repeated three times. Subsequently, 100 μL 50 mM iodoacetamide (IAM) was added, the samples were incubated for 30 min in darkness, and then centrifuged at 14,000 × g for 30 min at room temperature. The precipitate was resuspended in 100 μL UA buffer and samples were centrifuged at 14,000 × g for 30 min at room temperature. 100 μL dissolution buffer was added, followed by centrifugation at 14,000 × g for 30 min at room temperature. This step was repeated three times. The supernatant was removed, the pellet was dissolved in 40 μL trypsin buffer, incubated at 37°C for 18 h, and clarified by centrifugation at 14,000 × g for 30 min at room temperature. Finally, 40 μL 25 mM dissolution buffer was added and samples were centrifuged at 14,000 × g for 30 min at room temperature. The supernatant was transferred to a new tube and quantified with the Bradford assay using BSA as the standard, and SDS-PAGE was performed to verify protein quality.
iTRAQ labeling and strong cation exchange (SCX) fractionation
iTRAQ labeling was performed according to the manufacturer's instructions. Peptides were prepared using the 8-plex iTRAQ labeling kit (AB Sciex, CA, USA). Control replicates were labeled with reagents 113, 114, and 115, and the TTO treatment replicates were labeled with reagents 116, 117, and 118. The labeled peptide mixtures were pooled and dried by vacuum centrifugation.
The labeled peptide mixtures were dissolved in 3 mL buffer A (10 mM KH2PO4 in 25% acetonitrile, pH 3.0) and loaded onto a polysulfoethyl 4.6 × 100 mm column (5 μm, 200 Å, PolyLC, Inc., Maryland, USA). The peptides were eluted at a flow rate of 1 mL/min with a gradient of buffer A for 30 min, 5–70% buffer B (10 mM KH2PO4, 500 mM KCl in 25% acetonitrile, pH 3.0) for 65 min, and 70–100% buffer B for 80 min. The eluted peptides were pooled into 10 fractions, desalted on C18 cartridges (Sigma), and vacuum-dried.
LC-MS/MS analysis
For nano LC–MS/MS analysis, 10 μL of supernatant from each fraction was injected into an Obitrap-Elite (ThermoFinnigan) equipped with an Easy nLC (Proxeon Biosystems, now Thermo Fisher Scientific). The mobile phase was a mixture of water containing 0.1% formic acid and acetonitrile with 0.1% formic acid isocratically delivered by a pump at a flowrate of 250 nL/min. The elution gradient was: 0–105 min, 0–50% B; 105–110 min, 50–100% B; 110–120 min, 100% B. The MS scanning range was 300–1,800 m/z, MS resolution was 70,000, the number of scans range was 1, and the dynamic exclusion time was 40 s. The MS/MS activation type was HCD, the isolation window was 2 m/z, the MS/MS resolution was 17,500, the normalized collision energy was 30 eV, and the underfill ratio was 0.1%.
Analysis of differentially expression proteins
For protein quantitation, one protein was required to contain at least two unique peptides. The quantitative protein ratios were weighted and normalized by the median ratio in Mascot (http://www.matrixscience.com). When differences in protein expression between TTO-treated and control groups were >1.5-fold or <0.67-fold, with p < 0.05, the protein was considered to be differentially expressed.
Bioinformatic analysis
Gene Ontology (GO) is a standardized gene function classification system that describes the properties of proteins using three attributes: biological process, molecular function, and cellular components (Ashburner et al., 2000). A GO analysis (http://www.geneontology.org) was conducted to assign functional annotations for differentially expression proteins (DEPs), and the Kyoto Encyclopedia of Genes and Genomes (KEGG) (http://www.genome.jp/kegg) was used to predict the primary metabolic and signal transduction pathways in which the identified DEPs are involved.
Confocal laser scanning microscopy
To assess the effects of TTO on the cytoplasmic membranes of B. cinerea, confocal laser scanning microscopy (LSM 880, Carl Zeiss, Germany) was performed, using the fluorescent indicator propidium iodide (PI) (Sigma-Aldrich, USA) and a modified protocol (Lee and Kim, 2017). B. cinerea cells containing 4 × 10⁶ spores/ml were added to each glass tube and incubated with TTO (final concentration 5 mL/L) with shaking at 200 rpm at 25°C for 2 h. The cells were washed and resuspended in 0.5 mL PBS (pH 7.4), stained with PI (10 μM final concentration) for 30 min at room temperature in the dark, and then washed twice with PBS. Images were acquired using confocal laser scanning microscopy. The experiment was repeated three times.
Measurement of enzyme activities related to TCA cycle
Using the protocol described above (see Protein Extraction), ground mycelium was suspended in PBS (pH 7.4) and centrifuged at 10,000 × g for 10 min at 4°C. Enzyme activities were measured in the supernatant for malate dehydrogenase (MDH), citrate synthase (CS), and oxoglutarate dehydrogenase (OGDH), using kits purchased from Nanjing Jiancheng Bioengineering Institute (Nanjing, Jiangsu, China), following the manufacturer's instructions. Protein concentration was determined using a method based on the (Bradford, 1976) assay. MDH activity was calculated as μmol of NAD reduced per minute per mg of protein (U/mg protein). One unit of CS activity was defined as the amount of enzyme that produces 1 μmol of citric acid per minute (U/mg protein). OGDH activity was defined as the amount of enzyme that produces 1 nmol of NADH per minute (U/mg protein). Measurements were performed at 595 nm using three replicates for each sample.
Statistical analysis
All experiments were repeated three times. Mean values and standard deviations were calculated using Excel 2010 (Microsoft Inc., Seattle, WA, USA). Statistical analyses were performed using one-way ANOVA with SPSS Statistics 17.0 (SPSS Inc., Chicago, USA).
Results
Identification of B. cinerea proteins by iTRAQ
A total of 204,639 spectra were generated by iTRAQ proteomic analysis using control and TTO-treated B. cinerea and were analyzed using the Mascot search engine. As shown in Figure 1A, 17,337 spectra matched known spectra, comprising 10,001 peptides, 9,720 unique peptides, and 2,397 proteins from control and TTO-treated samples. The distribution of the number of peptides, predicted molecular weights, and isoelectric points, and peptide sequence coverage are shown in Figures 1B–D, respectively. Over 87% of the proteins were represented by at least two peptides. Molecular weights ranged from 20 to 200 kDa, and isoelectric points ranged from 5.0 and 7.0. Approximately 51% of identified proteins had more than 10% peptide sequence coverage.
Figure 1.

Summary of iTRAQ results. (A), total spectra, matched spectra, matched peptides, unique peptides, and identified proteins. (B), number of peptides associated with identified proteins. (C), molecular weights vs. isoelectric points, as calculated from protein sequences. (D), sequence coverage for identified proteins.
Identification of differentially expressed proteins using iTRAQ
The threshold for differential expression (TTO-treated vs. control) was a protein level difference >1.5 or < 0.67, with a p < 0.05. 718 differentially expressed proteins were identified in the TTO sample, of which 17 were up-regulated and 701 were down-regulated. Details for each protein are provided in Table 1.
Table 1.
The main differentially expressed proteins in B. cinerea after treatment with TTO.
| Accession | Protein name | Score | Sequence coverage (%) | Folda | p-value |
|---|---|---|---|---|---|
| gi|154691848 | cytochrome c | 96.3 | 37.9 | 0.328 | 0.007 |
| gi|347441783 | citrate synthase | 133.1 | 8.0 | 1.819 | 0.028 |
| gi|472236008 | malate dehydrogenase protein | 957.7 | 55.4 | 2.120 | 0.017 |
| gi|472241505 | oxoglutarate dehydrogenase protein | 698.3 | 27.2 | 1.611 | 0.037 |
| gi|347827327 | pyruvate carboxylase | 2, 263.6 | 38.7 | 1.751 | 0.027 |
| gi|347833674 | phosphoenolpyruvate carboxykinase | 548.7 | 30.2 | 1.625 | 0.044 |
| gi|347839725 | succinyl-CoA ligase subunit alpha | 420.3 | 24.3 | 1.612 | 0.040 |
| gi|347826865 | fructose-1,6-bisphosphatase | 308.1 | 39.1 | 1.640 | 0.031 |
| gi|154323902 | enolase | 2, 009.9 | 46.6 | 1.621 | 0.008 |
| gi|472238209 | glucose-6-phosphate isomerase protein | 574.2 | 29.9 | 1.980 | 0.032 |
| gi|472246374 | phosphoglycerate mutase protein | 54.3 | 2.6 | 1.576 | 0.021 |
| gi|472240435 | 6-phosphofructokinase protein | 539.9 | 28.1 | 1.775 | 0.022 |
| gi|472237248 | bisphosphoglycerate-independent phosphoglycerate mutase protein | 823.0 | 44.1 | 2.164 | 0.018 |
| gi|347841748 | fructose-bisphosphate aldolase | 1, 045.2 | 42.2 | 1.725 | 0.027 |
| gi|536718572 | phosphoglycerate kinase 1 | 587.5 | 40.2 | 1.723 | 0.040 |
| gi|347833674 | phospho-2-dehydro-3-deoxyheptonate aldolase | 548.7 | 30.2 | 1.870 | 0.029 |
| gi|347835540 | phosphoglycerate mutase family protein | 36.0 | 4.7 | 1.792 | 0.015 |
| gi|472240974 | 6-phosphofructo-2-kinase fructose bisphosphatase protein | 98.8 | 9.4 | 1.851 | 0.037 |
| gi|347441437 | inosine 5-monophosphate dehydrogenase | 581.8 | 19.9 | 1.606 | 0.020 |
| gi|347841600 | adenine phosphoribosyltransferase | 182.4 | 37.8 | 1.777 | 0.022 |
| gi|347829189 | adenosine kinase | 465.9 | 31.3 | 1.956 | 0.016 |
| gi|347441679 | adenosylhomocysteinase | 1, 287.4 | 61.7 | 1.881 | 0.027 |
| gi|347837737 | S-adenosylmethionine synthetase | 423.1 | 30.1 | 2.004 | 0.008 |
| gi|347831618 | AMP deaminase 3 | 111.1 | 4.5 | 1.673 | 0.029 |
| gi|347828730 | adenylosuccinate synthetase | 333.0 | 30.9 | 1.602 | 0.036 |
| gi|347837737 | S-adenosylmethionine synthetase | 423.1 | 30.1 | 2.004 | 0.008 |
| gi|347837845 | adenylyl cyclase-associated protein | 417.9 | 20.7 | 1.810 | 0.022 |
| gi|472242224 | guanyl-nucleotide exchange factor protein | 65.4 | 1.5 | 1.674 | 0.004 |
| gi|154691052 | uracil phosphoribosyltransferase | 90.6 | 9.4 | 1.796 | 0.046 |
| gi|154697015 | nucleoside diphosphate kinase | 522.4 | 42.8 | 1.935 | 0.010 |
| gi|347840376 | UTP-glucose-1-phosphate uridylyltransferase | 1, 333.6 | 45.7 | 1.623 | 0.038 |
| gi|347832865 | ribulose-phosphate 3-epimerase | 38.6 | 7.9 | 2.204 | 0.031 |
| gi|154300519 | alcohol dehydrogenase protein | 167.7 | 16.5 | 1.960 | 0.026 |
| gi|347836330 | alcohol dehydrogenase (NADP dependent) | 281.1 | 24.4 | 2.019 | 0.020 |
| gi|347441899 | zinc-containing alcohol dehydrogenase | 636.5 | 44.8 | 1.656 | 0.032 |
| gi|347440923 | aldehyde dehydrogenase | 1, 070.9 | 48.0 | 1.865 | 0.021 |
| gi|154703069 | ATP synthase D chain, mitochondrial | 252.1 | 26.4 | 1.924 | 0.050 |
| gi|563298521 | ATP synthase subunit e, mitochondrial | 60.2 | 9.9 | 1.757 | 0.033 |
| gi|347839842 | ATP citrate lyase subunit | 549.0 | 37.5 | 1.589 | 0.023 |
| gi|154703371 | vacuolar ATP synthase subunit E | 93.3 | 12.7 | 2.382 | 0.013 |
| gi|154692979 | vacuolar ATP synthase subunit D | 74.8 | 19.5 | 1.715 | 0.024 |
| gi|347441643 | vacuolar ATP synthase subunit H | 307.6 | 22.3 | 1.761 | 0.028 |
| gi|472245494 | vacuolar ATP synthase catalytic subunit a protein | 577.7 | 27.8 | 1.580 | 0.012 |
| gi|347835157 | v-type proton ATPase subunit B | 274.1 | 17.6 | 2.041 | 0.019 |
| gi|507414597 | mitochondrial import protein 1 | 31.1 | 8.6 | 1.872 | 0.043 |
| gi|472243251 | mitochondrial pyruvate dehydrogenase kinase protein | 61.4 | 3.4 | 2.632 | 0.009 |
| gi|229891130 | amino-acid acetyltransferase, mitochondrial | 44.2 | 2.1 | 2.115 | 0.022 |
| gi|3282211 | isocitrate lyase 1, partial | 27.8 | 2.5 | 1.874 | 0.029 |
| gi|347832197 | malate synthase | 46.4 | 5.7 | 1.875 | 0.048 |
| gi|347840647 | acetyl-CoA carboxylase | 2, 370.7 | 33.8 | 1.622 | 0.039 |
| gi|347842358 | acetyl-CoA acetyltransferase | 449.4 | 46.3 | 1.982 | 0.018 |
| gi|347841050 | fatty acid synthase | 1, 414.5 | 25.2 | 1.693 | 0.042 |
| gi|472245418 | fatty acid synthase beta subunit dehydratase protein | 1, 668.6 | 24.8 | 1.567 | 0.045 |
| gi|347841364 | NADP-specific glutamate dehydrogenase | 1, 138.8 | 46.9 | 1.840 | 0.021 |
| gi|347827914 | homocitrate synthase | 454.5 | 39.0 | 1.501 | 0.031 |
| gi|347837008 | homoserine kinase | 190.1 | 28.7 | 1.920 | 0.042 |
| gi|347836521 | GABA transaminase | 483.9 | 27.7 | 1.544 | 0.018 |
| gi|472242205 | aspartate aminotransferase protein | 385.8 | 26.1 | 1.837 | 0.048 |
| gi|347841990 | tryptophan synthase | 611.0 | 28.3 | 1.542 | 0.024 |
| gi|347832506 | threonine synthase | 348.4 | 16.4 | 1.560 | 0.047 |
| gi|154692095 | cysteine synthase | 292.8 | 25.0 | 1.589 | 0.028 |
| gi|347833148 | glutamine synthetase | 484.0 | 26.9 | 1.778 | 0.015 |
| gi|347839014 | histidine biosynthesis protein | 184.6 | 9.3 | 1.840 | 0.027 |
| gi|347828253 | dihydrodipicolinate synthetase family protein | 518.7 | 28.0 | 1.869 | 0.013 |
| gi|347836881 | D-3-phosphoglycerate dehydrogenase | 656.4 | 25.5 | 1.758 | 0.018 |
| gi|472242394 | saccharopine dehydrogenase protein | 338.7 | 36.2 | 1.743 | 0.039 |
| gi|347441047 | glycine dehydrogenase | 286.9 | 12.3 | 1.708 | 0.029 |
| gi|507414630 | C-1-tetrahydrofolate synthase | 905.4 | 31.2 | 1.737 | 0.031 |
| gi|347831191 | glutamate carboxypeptidase protein | 298.0 | 23.2 | 1.977 | 0.020 |
| gi|347841903 | methionine aminopeptidase 1 | 221.2 | 20.3 | 2.040 | 0.021 |
| gi|332313356 | methionine aminopeptidase 2 | 73.1 | 10.3 | 2.044 | 0.027 |
| gi|347829817 | serine/threonine protein kinase | 32.6 | 4.4 | 1.693 | 0.037 |
| gi|472244536 | glutamate-cysteine ligase protein | 61.6 | 3.6 | 1.698 | 0.037 |
| gi|347829487 | 5-methyltetrahydropteroyltriglutamate-homocysteine methyltransferase | 2, 013.2 | 41.1 | 2.505 | 0.004 |
| gi|347836712 | glycine cleavage system H protein | 116.0 | 22.0 | 1.982 | 0.025 |
| gi|472236211 | amino acid permease protein | 39.7 | 4.0 | 1.999 | 0.031 |
| gi|347830997 | peptide methionine sulfoxide reductase | 82.8 | 20.5 | 1.919 | 0.029 |
| gi|472243795 | aromatic-l-amino-acid decarboxylase protein | 287.6 | 12.1 | 1.936 | 0.015 |
| gi|347833024 | lysine decarboxylase-like protein | 79.7 | 8.6 | 1.585 | 0.033 |
| gi|472246546 | glutathione-dependent formaldehyde dehydrogenase | 587.5 | 48.7 | 1.666 | 0.043 |
| gi|347840830 | NADH-cytochrome b5 reductase | 305.5 | 23.0 | 1.545 | 0.029 |
| gi|347827019 | cytochrome P450 monooxygenase | 31.4 | 2.4 | 1.722 | 0.042 |
| gi|125949746 | calcineurin | 194.3 | 12.4 | 1.777 | 0.023 |
| gi|154289817 | chitin synthase | 129.2 | 4.7 | 1.555 | 0.023 |
| gi|347840218 | sorbitol dehydrogenase | 28.3 | 2.9 | 1.706 | 0.028 |
| gi|347440923 | aldehyde dehydrogenase | 1, 070.9 | 48.0 | 1.865 | 0.021 |
| gi|347833737 | mitochondrial peroxiredoxin Prx1 | 42.8 | 7.6 | 1.856 | 0.044 |
| gi|347828993 | antioxidant | 129.5 | 33.1 | 2.127 | 0.028 |
| gi|347839043 | superoxide dismutase | 163.1 | 17.0 | 1.717 | 0.012 |
| gi|166408944 | flavohemoglobin | 294.7 | 35.7 | 1.994 | 0.009 |
| gi|347828340 | oxidoreductase | 305.1 | 14.93 | 2.119 | 0.045 |
| gi|347841065 | nuclear control of ATPase protein | 84.7 | 4.7 | 0.219 | 0.001 |
| gi|347836808 | heat shock protein 70 | 3, 060.8 | 53.2 | 1.750 | 0.014 |
| gi|472242753 | 30 kda heat shock protein | 296.7 | 47.5 | 1.959 | 0.019 |
| gi|347827157 | heat shock protein 90 | 1, 603.7 | 37.7 | 1.650 | 0.032 |
| gi|347830903 | heat shock protein STI1 | 689.1 | 35.8 | 2.451 | 0.011 |
| gi|347830415 | heat shock protein Hsp88 | 1, 199.5 | 34.3 | 1.817 | 0.020 |
| gi|347833633 | heat shock protein | 748.3 | 34.3 | 1.999 | 0.020 |
| gi|154288804 | short chain dehydrogenase | 105.9 | 20.7 | 2.142 | 0.005 |
| gi|347840162 | translation initiation factor 3 | 284.6 | 46.8 | 1.905 | 0.031 |
| gi|472245156 | eukaryotic translation initiation factor 3 subunit | 749.4 | 18.9 | 1.890 | 0.015 |
| gi|229463757 | eukaryotic translation initiation factor 3 subunit H | 195.8 | 20.7 | 1.851 | 0.013 |
| gi|229501208 | eukaryotic translation initiation factor 3 subunit K | 232.7 | 33.5 | 1.751 | 0.044 |
| gi|347841080 | eukaryotic translation initiation factor 2 subunit alpha | 193.5 | 17.1 | 1.574 | 0.030 |
| gi|347830243 | eukaryotic translation initiation factor 4e | 151.7 | 12.0 | 1.798 | 0.044 |
| gi|347840917 | actin-depolymerizing factor 1 | 519.9 | 53.6 | 1.959 | 0.018 |
| gi|3182891 | actin | 1, 055.4 | 52.8 | 1.555 | 0.035 |
| gi|347831507 | actin binding protein | 276.9 | 16.6 | 1.942 | 0.003 |
| gi|347840551 | actin related protein 2/3 complex | 217.4 | 21.9 | 1.835 | 0.013 |
| gi|347838304 | F-actin capping protein beta subunit isoforms 1 and 2 | 156.0 | 27.7 | 1.595 | 0.044 |
| gi|205716451 | actin cytoskeleton-regulatory complex protein end 3 | 109.4 | 10.4 | 1.827 | 0.022 |
| gi|347827283 | actin lateral binding protein | 691.2 | 50.3 | 2.621 | 0.002 |
| gi|347441258 | myosin regulatory light chain cdc4 | 327.6 | 43.9 | 1.775 | 0.049 |
| gi|347838471 | survival factor 1 | 321.9 | 28.4 | 1.608 | 0.038 |
| gi|347441690 | transcription factor HMG | 78.8 | 21.8 | 3.565 | 0.004 |
| gi|347838526 | transcription factor CCAAT | 39.1 | 3.5 | 4.970 | 0.001 |
| gi|374093884 | transcription regulator PAC1, partial | 42.1 | 3.2 | 2.501 | 0.023 |
| gi|472235708 | cp2 transcription factor protein | 92.2 | 6.2 | 1.748 | 0.040 |
| gi|347826783 | transcription initiation factor subunit | 28.9 | 7.4 | 2.083 | 0.024 |
| gi|347837746 | transcription factor CBF/NF-Y | 46.1 | 6.1 | 1.869 | 0.021 |
| gi|347840266 | transcription factor Zn, C2H2 | 50.5 | 1.7 | 3.407 | 0.003 |
| gi|347837101 | EF-hand calcium-binding domain protein | 42.8 | 3.7 | 0.031 | 0.001 |
| gi|472246130 | cell division control protein cdc48 protein | 1, 298.4 | 40.7 | 1.654 | 0.021 |
| gi|472235945 | cell lysis protein | 103.7 | 20.5 | 1.930 | 0.025 |
| gi|206558271 | cell division cycle protein 123 | 38.6 | 3.9 | 1.809 | 0.050 |
| gi|347828695 | apoptosis-inducing factor 3 | 267.7 | 17.2 | 2.290 | 0.003 |
| gi|472242094 | thioredoxin protein | 388.6 | 51.4 | 2.634 | 0.003 |
| gi|472244889 | sulfate adenylyltransferase protein | 328.9 | 25.8 | 1.858 | 0.011 |
| gi|347839319 | protein disulfide-isomerase | 542.3 | 39.1 | 1.862 | 0.031 |
| gi|347442007 | transaldolase | 1, 216.6 | 50.2 | 1.984 | 0.022 |
| gi|154703303 | elongation factor 1-alpha | 2, 637.4 | 50.0 | 1.831 | 0.034 |
| gi|347830450 | elongation factor 2 | 1, 896.6 | 44.6 | 1.688 | 0.020 |
| gi|472244387 | elongation factor 1-beta protein | 597.2 | 40.0 | 2.006 | 0.024 |
| gi|347841449 | NAD-dependent formate dehydrogenase | 1, 663.0 | 50.1 | 1.931 | 0.042 |
| gi|347835785 | 26S protease regulatory subunit 6A | 355.1 | 27.6 | 1.848 | 0.017 |
| gi|472242788 | proteasome component pre3 protein | 101.7 | 23.9 | 1.942 | 0.023 |
| gi|347841691 | arp2/3 complex subunit Arc16 | 249.2 | 41.7 | 1.729 | 0.020 |
| gi|154319207 | 26S protease regulatory subunit 7 | 221.9 | 19.4 | 2.009 | 0.026 |
| gi|347833025 | proteasome subunit alpha type 1 | 133.2 | 16.9 | 1.706 | 0.025 |
| gi|347441407 | protein kinase C substrate | 282.5 | 18.1 | 1.703 | 0.028 |
| gi|347827686 | sec14 cytosolic factor | 240.1 | 41.4 | 1.711 | 0.030 |
| gi|347840528 | peptidyl-prolyl cis-trans isomerase D | 431.3 | 39.9 | 2.070 | 0.019 |
| gi|563298153 | inorganic pyrophosphatase | 317.8 | 29.7 | 1.714 | 0.015 |
| gi|347830035 | aldose 1-epimerase | 338.4 | 29.6 | 2.114 | 0.040 |
| gi|347831189 | carbohydrate-Binding Module family 48 protein | 330.4 | 27.1 | 3.744 | 0.014 |
| gi|347839149 | carbohydrate-Binding Module family 50 protein | 196.5 | 25.3 | 2.276 | 0.047 |
| gi|347841295 | cystathionine beta-synthase | 416.0 | 26.0 | 1.790 | 0.031 |
| gi|347842143 | diphosphomevalonate decarboxylase | 303.6 | 25.9 | 1.788 | 0.022 |
| gi|347836348 | protein phosphatase PP2A regulatory subunit A | 414.1 | 21.1 | 1.576 | 0.045 |
| gi|347838932 | class I/II aminotransferase | 340.3 | 23.9 | 1.844 | 0.015 |
| gi|347831623 | amidophosphoribosyltransferase | 1, 467.6 | 20.8 | 1.573 | 0.025 |
| gi|472236449 | enoyl- hydratase isomerase protein | 101.1 | 19.1 | 1.849 | 0.026 |
| gi|472237246 | tubulin-specific chaperone c protein | 222.7 | 20.7 | 1.621 | 0.044 |
| gi|347826898 | trans-2-enoyl-CoA reductase | 31.9 | 1.9 | 0.031 | 0.001 |
| gi|347837864 | 1,3,8-naphthalenetriol reductase | 89.0 | 19.6 | 2.213 | 0.029 |
| gi|472243905 | casein kinase i protein | 148.3 | 19.8 | 1.591 | 0.043 |
| gi|347831955 | acetate kinase | 193.1 | 18.9 | 1.726 | 0.015 |
| gi|347839614 | aspartyl aminopeptidase | 293.3 | 18.8 | 1.564 | 0.036 |
| gi|472238538 | 3-hydroxybutyryl-dehydrogenase protein | 133.3 | 17.2 | 1.645 | 0.025 |
| gi|347441025 | arf gtpase-activating protein | 249.9 | 17.2 | 2.074 | 0.008 |
| gi|347828551 | phosphatidyl synthase | 72.6 | 9.4 | 1.967 | 0.029 |
| gi|154294387 | mitogen-activated protein kinase | 101.9 | 17.1 | 1.664 | 0.039 |
| gi|472240101 | alpha beta hydrolase fold-3 domain protein | 45.3 | 9.0 | 1.812 | 0.020 |
| gi|347827703 | BAR domain protein | 271.6 | 43.4 | 1.751 | 0.037 |
| gi|347830570 | ThiJ/PfpI family protein | 645.5 | 37.0 | 1.703 | 0.016 |
| gi|347832713 | DUF1688 domain-containing protein | 437.7 | 27.6 | 1.726 | 0.034 |
| gi|472245392 | DUF718 domain-containing protein | 75.6 | 27.3 | 1.803 | 0.019 |
| gi|347836108 | C2 domain-containing protein | 286.0 | 23.6 | 1.947 | 0.021 |
| gi|347833490 | DUF757 domain-containing protein | 74.8 | 22.4 | 1.840 | 0.045 |
| gi|472245612 | c6 finger domain protein | 248.4 | 22.4 | 1.782 | 0.029 |
| gi|347838618 | UBX domain-containing protein | 101.1 | 16.2 | 2.252 | 0.036 |
| gi|472236354 | yip1 domain-containing protein | 66.0 | 11.1 | 2.052 | 0.033 |
| gi|347836200 | FAD binding domain-containing protein | 117.4 | 10.7 | 2.072 | 0.015 |
| gi|347836441 | DUF89 domain-containing protein | 69.4 | 6.0 | 1.638 | 0.027 |
| gi|472240877 | bar domain-containing protein | 69.2 | 5.9 | 1.784 | 0.040 |
| gi|347832303 | acyl-CoA dehydrogenase domain protein | 202.2 | 19.9 | 2.010 | 0.042 |
| gi|472237107 | saff domain-containing protein | 94.8 | 8.5 | 1.933 | 0.015 |
| gi|347828586 | CUE domain-containing protein | 53.8 | 3.1 | 3.833 | 0.008 |
| gi|472244807 | calponin domain protein | 79.3 | 2.9 | 2.067 | 0.033 |
| gi|563296966 | KH domain protein | 31.2 | 1.7 | 1.900 | 0.011 |
| gi|347829378 | R3H domain-containing protein | 32.3 | 1.6 | 1.938 | 0.001 |
| gi|347836748 | pumilio domain-containing protein | 37.9 | 1.4 | 2.313 | 0.007 |
| gi|347836261 | methyltransferase domain-containing protein | 27.9 | 2.9 | 0.031 | 0.001 |
| gi|154691472 | eukaryotic peptide chain release factor subunit 1 | 426.9 | 30.8 | 1.912 | 0.036 |
| gi|347837479 | glia maturation factor gamma | 102.7 | 30.6 | 1.703 | 0.028 |
| gi|347837628 | CORD and CS domain-containing protein | 134.3 | 29.8 | 1.787 | 0.013 |
| gi|347828828 | ruvB-like helicase 1 | 417.5 | 30.4 | 1.502 | 0.035 |
| gi|347442085 | CND8 | 99.4 | 6.3 | 0.405 | 0.001 |
| gi|156051430 | 40S ribosomal protein S3 | 1, 591.3 | 60.8 | 1.638 | 0.040 |
| gi|347827805 | 40S ribosomal protein S5 | 418.3 | 38.5 | 1.531 | 0.044 |
| gi|347835120 | 40S ribosomal protein S6 | 332.8 | 34.3 | 1.763 | 0.046 |
| gi|347836429 | 40S ribosomal protein S7 | 276.1 | 30.4 | 1.857 | 0.007 |
| gi|156043471 | 40S ribosomal protein S8 | 688.8 | 40.2 | 1.584 | 0.026 |
| gi|154291145 | 40S ribosomal protein S10 | 106.2 | 25.4 | 1.891 | 0.016 |
| gi|156061679 | 40S ribosomal protein S13 | 404.4 | 33.8 | 1.867 | 0.035 |
| gi|472237384 | 40S ribosomal protein S18 | 546.8 | 42.3 | 1.902 | 0.018 |
| gi|347837250 | 40S ribosomal protein S19 | 363.8 | 51.0 | 2.715 | 0.025 |
| gi|347441467 | 40S ribosomal protein S21 | 157.1 | 63.6 | 2.762 | 0.018 |
| gi|347829326 | 40S ribosomal protein S23 | 190.6 | 20.0 | 1.898 | 0.048 |
| gi|156065881 | 40S ribosomal protein S24 | 348.1 | 32.6 | 1.861 | 0.040 |
| gi|156065633 | 40S ribosomal protein S25 | 174.3 | 26.8 | 2.073 | 0.037 |
| gi|347832333 | 40S ribosomal protein S27 | 322.4 | 37.8 | 1.823 | 0.028 |
| gi|347828118 | 40S ribosomal protein S29 | 126.9 | 42.9 | 2.508 | 0.013 |
| gi|347827513 | 40S ribosomal protein S30 | 63.1 | 16.1 | 0.199 | 0.002 |
| gi|347828771 | 60S ribosomal protein L44 | 97.8 | 13.2 | 2.919 | 0.014 |
| gi|156062084 | 60S ribosomal protein L9 | 1, 053.6 | 63.4 | 1.571 | 0.031 |
| gi|229891536 | 54S ribosomal protein L4, mitochondrial | 54.3 | 6.8 | 0.375 | 0.024 |
| gi|156037530 | 60S ribosomal protein L12 | 608.9 | 40.0 | 1.562 | 0.010 |
| gi|347832401 | 60S ribosomal protein L13 | 444.7 | 33.0 | 1.662 | 0.032 |
| gi|347835805 | 60S ribosomal protein L6 | 611.8 | 33.0 | 1.670 | 0.023 |
| gi|347836248 | 60S ribosomal protein L10 | 126.5 | 11.3 | 2.336 | 0.030 |
| gi|347839766 | 60S ribosomal protein L16 | 271.7 | 29.7 | 2.055 | 0.039 |
| gi|154316257 | 60S ribosomal protein L17 | 563.9 | 30.5 | 2.136 | 0.011 |
| gi|154310248 | 60S ribosomal protein L19 | 409.8 | 29.4 | 2.652 | 0.009 |
| gi|347840178 | 60S ribosomal protein L21 | 247.9 | 35.6 | 1.977 | 0.029 |
| gi|347830985 | 60S ribosomal protein L23 | 425.6 | 48.9 | 1.936 | 0.030 |
| gi|347835534 | 60S ribosomal protein L24 | 274.0 | 29.0 | 2.291 | 0.015 |
| gi|347831348 | 60S ribosomal protein L26 | 236.5 | 36.8 | 2.174 | 0.030 |
| gi|347441549 | 60S ribosomal protein L27a | 708.8 | 48.3 | 1.603 | 0.018 |
| gi|347841474 | 60S ribosomal protein L28 | 236.9 | 52.7 | 3.593 | 0.010 |
| gi|472245831 | 60S ribosomal protein L31 | 295.4 | 48.0 | 2.230 | 0.019 |
| gi|347826648 | 60S ribosomal protein L33 | 274.2 | 37.6 | 1.909 | 0.034 |
| gi|154315039 | 60S ribosomal protein L35 | 140.2 | 18.9 | 2.744 | 0.024 |
| gi|156036474 | 60S ribosomal protein L36 | 166.0 | 35.9 | 1.648 | 0.038 |
| gi|154297648 | 60S acidic ribosomal protein P0 | 1, 277.7 | 41.7 | 1.896 | 0.029 |
| gi|347835237 | 60S acidic ribosomal protein P1 | 553.2 | 41.2 | 2.379 | 0.011 |
| gi|347838558 | 60S acidic ribosomal protein P2 | 500.4 | 55.9 | 2.178 | 0.012 |
| gi|347441053 | ribosome associated DnaJ chaperone Zuotin | 635.2 | 25.3 | 1.863 | 0.029 |
| gi|156044830 | ribosome biogenesis protein Nhp2 | 106.9 | 9.8 | 1.594 | 0.024 |
| gi|229485392 | ribosome biogenesis protein erb1 | 56.1 | 4.2 | 1.636 | 0.045 |
| gi|347837666 | nuclear transport factor 2 | 236.2 | 28.2 | 2.249 | 0.020 |
| gi|472246396 | nuclear segregation protein | 466.5 | 27.0 | 3.04 | 0.013 |
| gi|347835094 | leucyl-tRNA synthetase | 722.1 | 25.9 | 1.809 | 0.016 |
| gi|347835240 | methionyl-tRNA synthetase | 183.7 | 18.9 | 1.931 | 0.029 |
| gi|347828755 | tryptophanyl-tRNA synthetase | 283.9 | 23.4 | 1.864 | 0.037 |
| gi|563295297 | histidyl-tRNA synthetase | 286.9 | 21.9 | 1.691 | 0.027 |
| gi|347835339 | glutamyl-tRNA synthetase | 353.0 | 21.5 | 1.783 | 0.032 |
| gi|347841257 | threonyl-tRNA synthetase | 522.0 | 18.2 | 1.918 | 0.013 |
| gi|347840344 | valyl-trna synthetase | 535.3 | 13.7 | 1.681 | 0.046 |
| gi|347833265 | aspartyl-tRNA synthetase | 271.9 | 15.1 | 1.861 | 0.017 |
| gi|347836347 | phenylalanyl-tRNA synthetase beta chain | 159.9 | 13.5 | 2.148 | 0.003 |
| gi|347842507 | tRNA methyltransferase | 31.7 | 2.9 | 1.735 | 0.006 |
| gi|347837080 | polyadenylate-binding protein | 621.1 | 19.8 | 1.755 | 0.039 |
| gi|563292520 | histone H1-binding protein | 84.1 | 7.0 | 1.894 | 0.025 |
| gi|472237673 | oxysterol-binding protein | 154.5 | 6.5 | 3.378 | 0.014 |
| gi|154692219 | glycogen synthase | 204.9 | 11.1 | 1.884 | 0.038 |
| gi|154308576 | glucose-6-phosphate 1-dehydrogenase | 365.5 | 25.1 | 1.986 | 0.023 |
| gi|347833053 | 1,3-beta-glucan biosynthesis protein | 131.7 | 10.6 | 2.131 | 0.033 |
| gi|347841047 | plasma membrane stress response protein | 34.6 | 2.0 | 3.195 | 0.009 |
| gi|347830640 | methylenetetrahydrofolate reductase | 196.2 | 13.4 | 1.552 | 0.019 |
| gi|154309515 | ca/CaM-dependent kinase-1 | 141.7 | 18.4 | 1.566 | 0.036 |
| gi|347829911 | GTP-binding nuclear protein Ran | 301.8 | 38.1 | 1.732 | 0.025 |
| gi|472236275 | tRNA splicing endonuclease subunit protein | 96.8 | 14.5 | 2.013 | 0.007 |
| gi|347831289 | RNA binding effector protein Scp160 | 853.4 | 22.1 | 1.568 | 0.050 |
| gi|347839263 | DNA-directed RNA polymerase I subunit | 49.6 | 14.1 | 2.662 | 0.041 |
| gi|347441996 | HAD superfamily hydrolase | 203.1 | 32.5 | 1.599 | 0.041 |
| gi|347840552 | ubiquitin carboxyl-terminal hydrolase | 362.9 | 27.1 | 1.976 | 0.026 |
| gi|347837756 | ubiquitin-like protein SMT3 | 34.9 | 18.8 | 2.301 | 0.030 |
| gi|472238757 | ubiquitin-activating enzyme e1 1 protein | 489.3 | 17.3 | 1.665 | 0.016 |
| gi|154695558 | ubiquitin-conjugating enzyme E2 | 36.3 | 7.5 | 1.579 | 0.042 |
| gi|472241717 | ubiquitin thioesterase protein | 56.4 | 8.3 | 1.749 | 0.027 |
| gi|347440894 | translocon beta subunit Sbh1 | 225.3 | 44.6 | 1.753 | 0.042 |
| gi|472236180 | minor allergen alt a 7 protein | 282.3 | 47.8 | 2.844 | 0.005 |
| gi|472235513 | anthranilate synthase component 2 protein | 392.7 | 20.7 | 1.590 | 0.029 |
| gi|347833273 | nipsnap family protein | 154.3 | 19.9 | 1.633 | 0.026 |
| gi|347832071 | phosphoglucomutase | 1, 936.2 | 53.1 | 1.896 | 0.017 |
| gi|347829895 | phosphomannomutase | 182.7 | 21.5 | 1.854 | 0.028 |
| gi|347832016 | N-acetylglucosamine-phosphate mutase | 436.9 | 26.4 | 1.853 | 0.011 |
| gi|347841616 | UDP-galactopyranose mutase | 549.0 | 33.1 | 2.149 | 0.020 |
| gi|347841593 | UDP-N-acetylglucosamine pyrophosphorylase | 519.9 | 35.0 | 1.922 | 0.008 |
| gi|472237006 | UDP-glucose 4-epimerase gal10 protein | 191.1 | 20.5 | 1.867 | 0.009 |
| gi|347441001 | mannose-1-phosphate guanyltransferase alpha-a | 584.1 | 36.3 | 1.631 | 0.033 |
| gi|472241485 | nad h-dependent d-xylose reductase xyl1 protein | 247.9 | 28.6 | 1.541 | 0.046 |
| gi|347828612 | transketolase | 1, 284.8 | 41.2 | 2.020 | 0.013 |
| gi|154321267 | phosphoketolase | 883.5 | 24.4 | 1.836 | 0.042 |
| gi|347842358 | acetyl-CoA acetyltransferase | 449.4 | 46.3 | 1.982 | 0.018 |
| gi|347830285 | phospho-2-dehydro-3-deoxyheptonate aldolase | 460.2 | 36.1 | 1.950 | 0.027 |
| gi|347840715 | 3-isopropylmalate dehydratase | 593.0 | 29.8 | 1.519 | 0.019 |
| gi|347440697 | cyanide hydratase/nitrilase | 353.7 | 17.0 | 2.551 | 0.012 |
| gi|347832595 | aldo/keto reductase family oxidoreductase | 497.6 | 42.5 | 1.999 | 0.018 |
| gi|154322845 | aldo/keto reductase | 327.8 | 28.9 | 1.724 | 0.044 |
| gi|347838695 | nitroreductase family protein | 228.3 | 32.7 | 1.893 | 0.018 |
| gi|154293270 | glucose 1-dehydrogenase | 263.4 | 27.8 | 1.636 | 0.043 |
Fold: the average ratio (control/TTO-treated) of protein levels from three biological replicates as determined by iTRAQ approach. A protein was considered a differential expression protein as it exhibited a >1.5-fold or < 0.67-fold change and P < 0.05.
GO analysis of DEPs
GO analysis was conducted to identify significantly enriched GO functional groups. DEPs were categorized by biological process, cellular component, and molecular function. Of the 718 DEPs, 562 were annotated and classified into 30 functional groups (Figure 2). Biological processes accounted for 12 GO terms (with “metabolic process” accounting for 44.11% of these, and “cellular process” 34.32%). Cellular components accounted for 7 GO terms, dominated by “cell” (31.60%) and “cell part” (31.60%). Molecular functions accounted for 11 GO terms, the most abundant being “catalytic” (44.72%) and “binding” (43.61%).
Figure 2.

Gene Ontology (GO) analysis of differentially expressed proteins (DEPs) identified in B. cinerea cells treated with TTO.
The agriGO analysis tool was used to detect and visualize significantly enriched GO terms associated with the 562 annotated proteins, with an adjusted p-value cutoff of 0.05. Significant functions included “regulation of biological quality” (GO:0065008, p = 0.033) and “primary metabolic process” (GO:0044238, p = 0.016). There are 5 DEPs, accounting for about 45.45% of the total protein in regulation of biological quality. And 189 DEPs, accounting for about 73.82% of the total protein in primary metabolic process.
KEGG analysis of DEPs
Proteins typically do not exercise their functions independently, but coordinate with each other to complete a series of biochemical reactions. Pathway analysis can help reveal cellular processes involved in disease mechanisms or drug action. Using the KEGG database as a reference, 562 DEPs were linked to 133 different pathways. Glycolysis, the TCA cycle, and purine metabolism were among the pathways most significantly altered by exposure to TTO.
Confocal microscopy
Confocal laser scanning microscopy was used to investigate B. cinerea cell membrane integrity after TTO treatment. PI easily penetrates a membrane-damaged cell and binds to DNA, resulting in red fluorescence. B. cinerea cells were examined by both bright-field microscopy (Figures 3A,C) and fluorescence microscopy (Figures 3B,D). Control cells have no detectable red fluorescence (Figure 3B), indicating that they have intact cell membranes. In contrast, red fluorescence was observed after cells were treated for 2 h with TTO at 5 mL/L (Figure 3D). These results suggest that TTO compromises the integrity of the B. cinerea cell membrane, potentially causing cell death.
Figure 3.
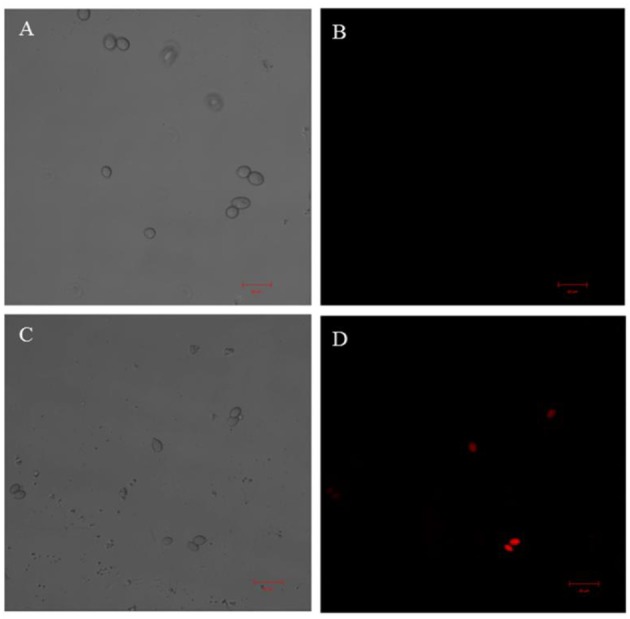
Effect of TTO treatment on cytoplasmic membranes in B. cinerea cells. Images were acquired by confocal microscopy using the fluorescent indicator PI. B. cinerea spores were incubated without TTO (A,B), or with 5 mL/L TTO (C,D). Bright-field (A,C) and fluorescent (B,D) images are shown. Red fluorescence indicates PI staining of nucleic acids. Scale bar: 20 μm.
Enzyme activities related to TCA cycle
Because the iTRAQ analysis clearly implicated the TCA cycle as a possible TTO target, we investigated the activities of MDH, CS, and OGDH, three key enzymes related to the TCA cycle (Figure 4). The results indicate that activities for these enzymes decreased significantly in TTO-treated cells (87.4, 53.3, and 40.3%, respectively), consistent with our observation that the MDH, CS, and OGDH proteins are significantly down-regulated in TTO-treated cells.
Figure 4.

Effect of TTO treatment on MDH, CS, and OGDH activities in B. cinerea. Vertical bars represent the standard deviation of the means. a,b: significant differences at P < 0.05 level based on Duncan's multiple range tests.
Discussion
The antifungal activity of essential oils is probably based on their ability to significantly reduce total lipid and ergosterol content, thereby disrupting membrane permeability and resulting in leakage of cell components such as ATP, DNA, and potassium ions (Tian et al., 2011; Tao et al., 2014; Cui et al., 2015). Our previous study demonstrated that TTO considerably increases membrane permeability, causing extrusion of abundant material (Shao et al., 2013b; Yu et al., 2015) and decreasing intracellular ATP in B. cinerea (Li et al., 2017b). In this study, observations using confocal laser scanning microscopy indicate that TTO damages the B. cinerea cell membrane, potentially causing the release of internal material such as ATP.
Levels for many DEPs related to glycolysis metabolism, such as glucose-6-phosphate isomerase, 6-phosphofructokinase, phosphoenolpyruvate carboxykinase, fructose-1, 6-bisphosphatase, and enolase, are decreased by TTO treatment (Table 1). Glucose-6-phosphate isomerase catalyzes the conversion of glucose-6-phosphate into fructose 6-phosphate in the second step of glycolysis (Achari et al., 1981). 6-phosphofructokinase is a key enzyme in the control of the glycolytic pathway in nearly all cells (Wang et al., 2016). The activity of this enzyme is controlled by several metabolites, most notably its two substrates, fructose 6-phosphate and ATP. Glycolysis is also an important pathway for energy production in the cytosol of plant cells. Our results suggest that TTO inhibits glycolysis and may affect energy supply in B. cinerea.
Mitochondria are the primary sites of aerobic respiration in eukaryotic cells. They generate energy for cellular functions through oxidative phosphorylation and the TCA cycle, and also play a crucial role in regulating the apoptosis (Shaughnessy et al., 2014). In this study, several proteins associated with the mitochondrial respiratory chain and TCA cycle, such as ATP synthase D chain, ATP synthase subunit e, MDH, CS, and OGDH, were significantly down-regulated in cells treated with TTO (Table 1). ATP synthase D chain and ATP synthase subunit e are involved in the biosynthesis of ATP. Dill oil inhibits mitochondrial ATPase activity and dehydrogenase activities, and affects mitochondrial function in Aspergillus flavus (Tian et al., 2012). Mustard essential oils decrease intracellular ATP and increase extracellular ATP in E. coli O157:H7 and Salmonella typhi (Turgis et al., 2009). Citral decreases intracellular ATP content, increases extracellular ATP content, inhibits the TCA pathway, and decreases the activities of CS and α-ketoglutarate dehydrogenase in Penicillium digitatum (Zheng et al., 2015). Our additional study demonstrates that TTO treatment significantly inhibits the activities of MDH, CS, and OGDH (Figure 4). In our previous study, we found that TTO decreases intracellular ATP and the activities of MDH, succinate dehydrogenase, ATPase, CS, isocitrate dehydrogenase, and α-ketoglutarate dehydrogenase, disrupting the TCA cycle in B. cinerea (Li et al., 2017b). The down-regulation of two MDHs suggests that the Krebs cycle is not completely functional in Paracoccidioides lutzii upon exposure to argentilactone (Prado et al., 2014). Together, these results imply that TTO affects proteins in B. cinerea involved in glycolysis, the TCA cycle, and ATP synthesis, thereby disrupting the TCA cycle, interrupting energy metabolism, and inducing mitochondrial dysfunction.
Cytochrome c (cyt c) is a hemoglobin located in the inner mitochondrial membrane, and is responsible for transferring electrons between mitochondrial electron transport chain complexes III and IV (Reed, 1997; Lo et al., 2017). ATP is produced by the aerobic mitochondrial respiratory chain. Abnormal cyt c disrupts the mitochondrial respiratory chain and impacts ATP production (Zhou et al., 2015). Our study shows that cyt c is up-regulated in B. cinerea after TTO treatment at 5 mL/L (Table 1). The increase in cyt c levels may improve the performance of the oxidative respiratory chain, perhaps as a protective response to TTO toxicity.
Purines are one of the building blocks for nucleic acids. Their synthesis pathways generate many kinds of energy molecules (Qian et al., 2014). Inosine 5′-monophosphate dehydrogenase (IMPDH) is a rate-controlling enzyme in the de novo synthesis of the guanine nucleotide, and plays crucial roles in cell growth and proliferation (Fotie, 2016). IMPDH inhibition reduces guanine nucleotide pools and interrupts cellular functions such as DNA replication, RNA synthesis, and signal transduction (Weber, 1983; Weber et al., 1996). These effects are associated with cell cycle disruption, cellular differentiation, and apoptosis (Vitale et al., 1997; Yalowitz and Jayaram, 2000). Nucleoside diphosphate kinases (NDPK) are critical enzymes related to the maintenance of intracellular nucleotide levels, and catalyze the conversion of nucleoside triphosphates to nucleoside diphosphates in all living organisms (Véron et al., 1994). Both NDPK and AK can mediate the conversion of adenosine into ATP by ADP and AMP (Senft and Crabtree, 1983). In our study, TTO treatment decreased IMPDH levels (Table 1). Furthermore, levels of adenosine kinase AK and NDPK were also reduced after TTO treatment (Table 1). From these results, we can conclude that TTO may block the accumulation of energy and disrupt the cell cycle, ultimately inducing apoptosis.
Conclusion
The effect of TTO treatment on proteins in B. cinerea is summarized in Figure 5. We found that important metabolic pathways, including glycolysis, the TCA cycle, and purine metabolism, were compromised by TTO treatment, while cyt c increased. We conclude that the disruption of energy metabolism by TTO contributes to its antifungal activity against B. cinerea.
Figure 5.

Model summarizing antifungal effects of TTO in B. cinerea. Green arrows indicate down-regulation and red arrows indicate up-regulation.
Author contributions
JX and XS designed the experiments. JX and YW performed the experiments. FX and HW analyzed the data. JX, XS, and HW drafted the manuscript. All authors read and approved the final manuscript.
Conflict of interest statement
The authors declare that the research was conducted in the absence of any commercial or financial relationships that could be construed as a potential conflict of interest.
Acknowledgments
This study was funded by the National Science Foundation of China (No. 31371860), the Public Welfare Applied Research Project of Zhejiang Province (No. 2017C32010), the Science and Technology Program of Ningbo City (2017C10065), the School Research Project (XYL17014), and the K.C. Wong Magna Fund in Ningbo University.
References
- Abdulazeez M. A., Abdullahi A. S., James B. D. (2016). Chapter 58 – Lemongrass (Cymbopogon spp.) Oils, in Essential Oils in Food Preservation Flavor and Safet (London, UK: Academic Press Books-Elsevier; ), 509–516. [Google Scholar]
- Achari A., Marshall S. E., Muirhead H., Palmieri R. H., Noltmann E. A. (1981). Glucose-6-phosphate isomerase. Philos. Trans. R. Soc. London. 293, 145–157. 10.1098/rstb.1981.0068 [DOI] [PubMed] [Google Scholar]
- Ashburner M., Ball C. A., Blake J. A., Botstein D., Butler H., Cherry J. M., et al. (2000). Gene Ontology: tool for the unification of biology. Nat. Genet. 25, 25–29. 10.1038/75556 [DOI] [PMC free article] [PubMed] [Google Scholar]
- Bona E., Cantamessa S., Pavan M., Novello G., Massa N., Rocchetti A., et al. (2016). Sensitivity of Candida albicans to essential oils: are they an alternative to antifungal agents? J. Appl. Microbiol. 121, 1530–1545. 10.1111/jam.13282 [DOI] [PubMed] [Google Scholar]
- Bradford M. (1976). A rapid and sensitive method for the quantitation of microgram quantities of protein utilizing the principle of protein–dye binding. Anal. Biochem. 6, 3171–3188. 10.1016/0003-2697(76)90527-3 [DOI] [PubMed] [Google Scholar]
- Brul S., Coote P. (1999). Preservative agents in foods: mode of action and microbial resistance mechanisms. Int. J. Food Microbiol. 50, 1–17. 10.1016/S0168-1605(99)00072-0 [DOI] [PubMed] [Google Scholar]
- Carson C. F., Hammer K. A., Riley T. V. (2006). Melaleuca alternifolia (Tea Tree) oil: a review of antimicrobial and other medicinal properties. Clin. Microbiol. Rev. 19, 50–62. 10.1128/CMR.19.1.50-62.2006 [DOI] [PMC free article] [PubMed] [Google Scholar]
- Cho Y. S., Oh K. H. (2011). Cellular and proteomic responses of Escherichia coli JK-17 exposed to the Rosa hybrida flower extract. Biotechnol. Bioprocess Eng. 16, 885–893. 10.1007/s12257-011-0051-5 [DOI] [Google Scholar]
- Cui H., Zhang X., Zhou H., Zhao C., Lin L. (2015). Antimicrobial activity and mechanisms of Salvia sclarea essential oil. Bot. Stud. 56, 16. 10.1186/s40529-015-0096-4 [DOI] [PMC free article] [PubMed] [Google Scholar]
- Fotie J. (2016). Inosine 5'-Monophosphate Dehydrogenase (IMPDH) as a potential target for the development of a new generation of antiprotozoan agents. Mini Rev. Med. Chem. 10.2174/1389557516666160620065558 [Epub ahead of print]. [DOI] [PubMed] [Google Scholar]
- Franco C., Soares R., Pires E., Koci K., Almeida A. M., Santos R., et al. (2013). Understanding regeneration through proteomics. Proteomics 13, 686–709. 10.1002/pmic.201200397 [DOI] [PubMed] [Google Scholar]
- Fraternale D., Flamini G., Ricci D. (2014). Essential oil composition of Angelica archangelica L. (Apiaceae) roots and its antifungal activity against plant pathogenic fungi. Plant Biosyst. 150, 558–563. 10.1080/11263504.2014.988190 [DOI] [Google Scholar]
- Gustafson J., Liew Y., Chew S., Markham J., Bell H., Wyllie S., et al. (1998). Effects of tea tree oil on Escherichia coli. Lett. Appl. Microbiol. 26, 194–198. 10.1046/j.1472-765X.1998.00317.x [DOI] [PubMed] [Google Scholar]
- Homer L. E., Leach D. N., Lea D., Lee L. S., Henry R. J., Baverstock P. R. (2000). Natural variation in the essential oil content of Melaleuca alternifolia Cheel (Myrtaceae). Biochem. Syst. Ecol. 28, 367–382. 10.1016/S0305-1978(99)00071-X [DOI] [PubMed] [Google Scholar]
- Kovács J. K., Felso P., Makszin L., Pápai Z., Horváth G. Á. H., et al. (2016). Antimicrobial and virulence modulating effect of clove essential oil on the food-borne pathogen Campylobacter jejuni. Appl. Environ. Microbiol. 82, 6158–6166. 10.1128/AEM.01221-16 [DOI] [PMC free article] [PubMed] [Google Scholar]
- Lee H. S., Kim Y. (2017). Paeonia lactiflora inhibits cell wall synthesis and triggers membrane depolarization in Candida albicans. J. Microbiol. Biotechnol. 27, 395–404. 10.4014/jmb.1611.11064 [DOI] [PubMed] [Google Scholar]
- Leroux P., Fritz R., Debieu D., Albertini C., Lanen C., Bach J., et al. (2002). Mechanisms of resistance to fungicides in field strains of Botrytis cinerea. Pest Manag. Sci. 58, 876–888. 10.1002/ps.566 [DOI] [PubMed] [Google Scholar]
- Li Y., Shao X., Xu J., Wei Y., Xu F., Wang H. (2017a). Effects and possible mechanism of tea tree oil against Botrytis cinerea and Penicillium expansum in vitro and in vivo test. Can. J. Microbiol. 63, 219–227. 10.1139/cjm-2016-0553 [DOI] [PubMed] [Google Scholar]
- Li Y., Shao X., Xu J., Wei Y., Xu F., Wang H. (2017b). Tea tree oil exhibits antifungal activity against Botrytis cinerea by affecting mitochondria. Food Chem. 234, 62–67. 10.1016/j.foodchem.2017.04.172 [DOI] [PubMed] [Google Scholar]
- Liu S., Shao X., Wei Y., Li Y., Xu F., Wang H. (2016). Solidago canadensis L. essential oil vapor effectively inhibits Botrytis cinerea growth and preserves postharvest quality of strawberry as a food model system. Front. Microbiol. 7:1179 10.3389/fmicb.2016.01179 [DOI] [PMC free article] [PubMed] [Google Scholar]
- Lo Y. T., Huang H. W., Huang Y. C., Chan J. F., Hsu Y. H. (2017). Elucidation of tRNA-cytochrome c interactions through hydrogen/deuterium exchange mass spectrometry. BBA Proteins Proteom. 1865, 539–546. 10.1016/j.bbapap.2017.02.015 [DOI] [PubMed] [Google Scholar]
- Miao L., Zhu L., Liu B., Du L., Jia X., Li H., et al. (2016). Tea tree oil nanoemulsions for inhalation therapies of bacterial and fungal pneumonia. Colloids. Surface. B. Biointerfaces 141, 408–416. 10.1016/j.colsurfb.2016.02.017 [DOI] [PubMed] [Google Scholar]
- Prado R. S., Bailão A. M., Silva L. C., Oliveira C. M. A. D., Marques M. F., Silva L. P., et al. (2014). Proteomic profile response of Paracoccidioides lutzii to the antifungal argentilactone. Front. Microbiol. 6:616. 10.3389/fmicb.2015.00616 [DOI] [PMC free article] [PubMed] [Google Scholar]
- Prakash B., Singh P., Kedia A., Dubey N. K. (2012). Assessment of some essential oils as food preservatives based on antifungal, antiaflatoxin, antioxidant activities and in vivo efficacy in food system. Food Res. Int. 49, 201–208. 10.1016/j.foodres.2012.08.020 [DOI] [Google Scholar]
- Qian Z., Liu Z. L., Kang N., Wang A., Zeng X., Jian X. (2014). Genomic and transcriptome analyses reveal that MAPK- and phosphatidylinositol-signaling pathways mediate tolerance to 5-hydroxymethyl-2-furaldehyde for industrial yeast Saccharomyces cerevisiae. Sci. Rep. 4:6556 10.1038/srep06556 [DOI] [PMC free article] [PubMed] [Google Scholar]
- Reed J. C. (1997). Cytochrome c: can't live with it–can't live without it. Cell 91, 559–562. 10.1016/S0092-8674(00)80442-0 [DOI] [PubMed] [Google Scholar]
- Senft A. W., Crabtree G. W. (1983). Purine metabolism in the schistosomes: potential targets for chemotherapy. Pharmacol. Ther. 20, 341–356. 10.1016/0163-7258(83)90031-1 [DOI] [PubMed] [Google Scholar]
- Shao X., Cheng S., Wang H., Yu D., Mungai C. (2013b). The possible mechanism of antifungal action of tea tree oil on Botrytis cinerea. J. Appl. Microbiol. 114, 1642–1649. 10.1111/jam.12193 [DOI] [PubMed] [Google Scholar]
- Shao X., Wang H., Xu F., Cheng S. (2013a). Effects and possible mechanisms of tea tree oil vapor treatment on the main disease in postharvest strawberry fruit. Postharvest Biol. Tec. 77, 94–101. 10.1016/j.postharvbio.2012.11.010 [DOI] [Google Scholar]
- Shaughnessy D. T., McAllister K., Worth L., Haugen A. C., Meyer J. N., Domann F. E., et al. (2014). Mitochondria, energetics, epigenetics, and cellular responses to stress. Environ. Health. Perspect. 122, 1271–1278. 10.1289/ehp.1408418 [DOI] [PMC free article] [PubMed] [Google Scholar]
- Soylu E. M., Kurt S., Soylu S. (2010). In vitro and in vivo antifungal activities of the essential oils of various plants against tomato grey mould disease agent Botrytis cinerea. Int. J. Food Microbiol. 143, 183–189. 10.1016/j.ijfoodmicro.2010.08.015 [DOI] [PubMed] [Google Scholar]
- Tao N., OuYang Q., Jia L. (2014). Citral inhibits mycelial growth of Penicillium italicum by a membrane damage mechanism. Food Control 41, 116–121. 10.1016/j.foodcont.2014.01.010 [DOI] [Google Scholar]
- Tian J., Ban X., Zeng H., He J., Chen Y., Wang Y. (2012). The mechanism of antifungal action of essential oil from dill (Anethum graveolens L.) on Aspergillus flavus. PLoS ONE 7:e30147. 10.1371/journal.pone.0030147 [DOI] [PMC free article] [PubMed] [Google Scholar]
- Tian J., Ban X., Zeng H., Huang B., He J., Wang Y. (2011). In vitro and in vivo activity of essential oil from dill (Anethum graveolens L.) against fungal spoilage of cherry tomatoes. Food Control 22, 1992–1999. 10.1016/j.foodcont.2011.05.018 [DOI] [Google Scholar]
- Turgis M., Han J. J., Caillet S., Lacroix M. (2009). Antimicrobial activity of mustard essential oil against Escherichia coli O157:H7 and Salmonella typhi. Food Control 20, 1073–1079. 10.1016/j.foodcont.2009.02.001 [DOI] [Google Scholar]
- Véron M., Tepper A., Hildebrandt M., Lascu I., Lacombe M. L., Janin J., et al. (1994). Nucleoside diphosphate kinase: an old enzyme with new functions? Adv. Exp. Med. Biol. 370, 607–611. 10.1007/978-1-4615-2584-4_126 [DOI] [PubMed] [Google Scholar]
- Vitale M., Zamai L., Falcieri E., Zauli G., Gobbi P., Santi S., et al. (1997). IMP dehydrogenase inhibitor, tiazofurin, induces apoptosis in K562 human erythroleukemia cells. Cytometry 30, 61–66. [DOI] [PubMed] [Google Scholar]
- Wang J., Zhang P., Zhong J., Tan M., Ge J., Tao L., et al. (2016). The platelet isoform of phosphofructokinase contributes to metabolic reprogramming and maintains cell proliferation in clear cell renal cell carcinoma. Oncotarget 7, 27142–27157. 10.18632/oncotarget.8382 [DOI] [PMC free article] [PubMed] [Google Scholar]
- Weber G. (1983). Enzymes of purine metabolism in cancer. Clin. Biochem. 16, 57–63. 10.1016/S0009-9120(83)94432-6 [DOI] [PubMed] [Google Scholar]
- Weber G., Prajda N., Yang H., Yeh Y. A., Shen F., Singhal R. L., et al. (1996). Current issues in the regulation of signal transduction. Adv. Enzyme Regul. 36, 33–55. 10.1016/0065-2571(96)00003-9 [DOI] [PubMed] [Google Scholar]
- Xu J., Shao X., Li Y., Wei Y., Xu F., Wang H. (2017). Metabolomic analysis and mode of action of metabolites of tea tree oil involved in the suppression of Botrytis cinerea. Front. Microbiol. 8:1017. 10.3389/fmicb.2017.01017 [DOI] [PMC free article] [PubMed] [Google Scholar]
- Yalowitz J. A., Jayaram H. N. (2000). Molecular targets of guanine nucleotides in differentiation, proliferation and apoptosis. Anticancer Res. 20, 2329–2338. [PubMed] [Google Scholar]
- Yu D., Wang J., Shao X., Xu F., Wang H. (2015). Antifungal modes of action of tea tree oil and its two characteristic components against Botrytis cinerea. J. Appl. Microbiol. 119, 1253–1262. 10.1111/jam.12939 [DOI] [PubMed] [Google Scholar]
- Zheng S., Jing G., Wang X., Ouyang Q., Jia L., Tao N. (2015). Citral exerts its antifungal activity against Penicillium digitatum by affecting the mitochondrial morphology and function. Food Chem. 178, 76–81. 10.1016/j.foodchem.2015.01.077 [DOI] [PubMed] [Google Scholar]
- Zhou M., Li Y., Hu Q., Bai X. C., Huang W., Yan C., et al. (2015). Atomic structure of the apoptosome: mechanism of cytochrome c- and dATP-mediated activation of Apaf-1. Genes Dev. 29, 2349–2361. 10.1101/gad.272278.115 [DOI] [PMC free article] [PubMed] [Google Scholar]
- Zhou Y., Chen W. N. (2011). iTRAQ-coupled 2-D LC-MS/MS analysis of membrane protein profile in Escherichia coli incubated with apidaecin IB. PLoS ONE 75:e20442. 10.1371/journal.pone.0020442 [DOI] [PMC free article] [PubMed] [Google Scholar]