

Abstract
The current work aimed to formulate smoothie by optimizing varying levels of soy protein isolate (1.5–2.5% w/w), sucralose (150–190 ppm) and pectin (0.3–0.5% w/w) along with milk, legume (chickpea), vegetable (carrot), fruit (mango), honey and trisodium citrate by response surface methodology on the basis of sensory (color and appearance, flavor, consistency, sweetness and overall acceptability) and physical (expressible serum and viscosity) responses. Soy protein isolate and pectin levels influenced color and appearance, flavor, consistency and overall acceptability significantly. Soy protein isolate and pectin showed a positive correlation with viscosity of smoothie with reduced expressible serum. Smoothie was optimized with 1.8% (w/w) soy protein isolate, 166.8 ppm sucralose, and 0.5% (w/w) pectin with acceptable quality. One serving (325 ml) of optimized smoothie provides approximately 23% protein, 27% dietary fiber of the recommended daily values and provides approximately 74 kcal per 100 ml of smoothie, which renders smoothie as a high protein, high fiber, grab-and-go breakfast option.
Keywords: Smoothie, Grab-and-go breakfast, High protein, High fiber
Introduction
Breakfast, usually the first meal of the day, plays a vital role in our diet. It should include the essential nutrients in adequate amount for people of all ages. A healthy breakfast should derive from three major food groups viz., milk, fruits and grains and it should provide the sufficient amount of protein, fiber, vitamins and micronutrients (USDA Food and Nutrition Service 2013) with minimal sugar and fat especially from processed foods (National Institute of Nutrition 2011). On the other hand, skipping breakfast has become a common habit in the recent era, the possible reasons quoted behind it, being not hungry, no time, no one to prepare food, on a diet to lose weight and food not available (Singleton and Rhoads 1982). A previous study (Smith et al. 2010) demonstrated that skipping breakfast during childhood and adulthood cause significant changes in anthropometric measurements viz., higher body mass index, larger weight and circumferences, and also poorer cardiometabolic profiles than those who have breakfast at both stages of life. Skipping breakfast is an indication of a negative sign for health, such as development of disordered eating behavior, which may lead to several health consequences (Neumark-Sztainer et al. 2008).
The concept of a grab-and-go, healthy breakfast option would be the possible remedy of such concerns, but its success comes from its careful formulation. In the preparation of a cost-effective, acceptable, shelf-stable and nutritious formula, the selection of ingredients and their level of addition play an important role in formulation. Soy protein is an excellent source for protein enrichment in product formulations, owing to its low cost and the excellent nutritional profile, but the major drawback is its undesirable flavors and taste. Such undesirable flavors like beany and green flavors possibly result from lipoxygenase activity or auto-oxidation of oils from crushed soybean, which may interact with soy protein (Rackis et al. 1979; Ashraf and Snyder 1981). Use of such soy protein for enriching the formulation may release such off-flavors that adversely affect the consumer acceptability of the final product. Sucralose is used as a sugar replacer in a variety of food products to cut extra perks of calories from carbohydrate. It is exceptionally stable at low pH and high temperature (Knight 1994). However, the main disadvantage of sucralose is its bitter after-taste beyond a certain level of addition (Hanger et al. 1996). The application of pectin in protein-rich acidic beverages is widely popular, as it provides an excellent stability to the product, in addition to its contribution to consistency (Doesburg and de Vos 1959).
The current study was aimed at developing a high protein, high fiber, grab-and-go breakfast option as smoothie by optimizing critical ingredients like soy protein isolate, sucralose and pectin using response surface methodology (RSM) along with milk, legume (chickpea), fruit (mango), vegetable (carrot) and honey, based on their impact on selected sensory and physical attributes of the product.
Materials and methods
Materials
Cow milk (Experimental Dairy, National Dairy Research Institute, Haryana, India) was used as a base material in a formulation of smoothie which contained fat and total solids ranging from 3.5 to 4.5% and 12 to 14%, respectively. Black chickpeas (Cicer arietinum L., local variety, 93.09 ± 0.5% total solids, 63.03 ± 0.79% total carbohydrates, 3.30 ± 0.21% fat, 24.66 ± 0.53% protein and 3.1 ± 0.07% ash), mango pulp (Totapuri variety, Golden Crown Ltd., 13.7% carbohydrate, 0.39% protein and 0.14% fat) and honey (Dabur Pvt., Ltd., 80% total solids) were procured from the local market of Haryana, India. Clean black chickpeas were soaked in water (1:2) for 12 h, germinated for 48 h at 25 °C, dried at 60 °C for 12 h, their rootlets removed, and the chickpeas milled to produce chickpea flour. The flour was sieved through 52 mesh size, packaged, and stored in refrigerator for further use. Carrot juice concentrate (70.8° Brix) and soy protein isolate (SPI, 90% protein, 0.5% fat, 1% crude fiber, 4.5% ash and 7% moisture) were procured from Cargill Inc., Delhi, India and Sonic Biochem, Madhya Pradesh, India, respectively. Sucralose and trisodium citrate were purchased from Hi-Media Chemicals, Maharashtra, India, and pectin (high methoxy), from CP Kelco, Division of M/s JM Huber Pvt. Ltd., Mumbai, India.
Manufacture of smoothie
Smoothie was formulated using a variety of key ingredients such as cow milk (30% w/w), chickpea (3% w/w), mango pulp (15% w/w), carrot juice (3% w/w), honey (3% w/w), and tri-sodium citrate (0.05% w/w) along with SPI, sucralose and pectin (as per suggested levels from RSM design expert) using a hand blender (Rico HBCJ-02 Hand Blender, Mumbai, India) with a mincer blade at a highest speed (2000 rpm) for 15 min. Soy protein and sucralose contributed excellent nutritional profile and enhanced functionality to the product. Preliminary studies demonstrated that ingredients such as SPI, sucralose and pectin have a significant impact on product stability and acceptability. Based on their results, the product was prepared using 1.5–2.5% (w/w), 150–190 ppm and 0.3–0.5% (w/w) of SPI, sucralose and pectin, respectively. Figure 1 illustrates the process flow diagram for the development of smoothie. After homogenization, smoothie was filled into glass bottles, crown corked and heat treated on an LPG stove in a steel kettle (20 L capacity) containing water, followed by immediate cooling.
Fig. 1.

Process flow diagram for the manufacture of smoothie
Design of experiment
Selected ranges of SPI, sucralose, and pectin (1.5–2.5% (w/w), 150–190 ppm and 0.3–0.5% (w/w) respectively) were fitted in RSM with three factors second-order central composite rotatable design (CCRD) using Design Expert- 8.0.7.1 software (Stat-Ease Inc., Minneapolis, USA) for their level optimization in smoothie preparation. The experimental design generated twenty different combinations of selected ingredients shown in Table 1. Smoothie was formulated according to the generated combinations and analysed for sensory and physical responses to optimize the level of selected ingredients. The actual level of three factors (A, B, C) and the axial distance (−α, +α) make the design rotatable. The response function (Y) was assumed to relate sensory responses (color and appearance, flavor, consistency, sweetness, and overall acceptability) and physical responses (expressible serum and viscosity).
Table 1.
Experimental design run and corresponding responses of breakfast smoothie
| Run | Variables* | Sensory responses | Physical responses | |||||||
|---|---|---|---|---|---|---|---|---|---|---|
| SPI (%w/w) A (a) | Sucralose (ppm) B (b) | C:pectin (%w/w) C (c) | Color and appearance | Flavor | Consistency | Sweetness | Overall acceptability | Expressible serum (mL/50 mL) | Viscosity (Pa.s) | |
| 1 | 2 (0) | 170 (0) | 0.4 (0) | 7.90 | 6.60 | 7.20 | 7.15 | 7.34 | 13.15 | 0.544 |
| 2 | 1.5 (−1) | 190 (1) | 0.5 (1) | 8.23 | 6.90 | 6.53 | 7.15 | 7.04 | 15.40 | 0.479 |
| 3 | 2.5 (1) | 150 (−1) | 0.5 (1) | 7.79 | 6.18 | 7.20 | 7.03 | 7.06 | 12.10 | 0.728 |
| 4 | 2 (0) | 170 (0) | 0.4 (0) | 7.98 | 7.03 | 6.80 | 7.50 | 7.59 | 13.30 | 0.498 |
| 5 | 1.5 (−1) | 190 (1) | 0.3 (−1) | 8.50 | 6.50 | 6.40 | 7.13 | 6.96 | 16.55 | 0.398 |
| 6 | 2.5 (1) | 190 (1) | 0.5 (1) | 7.50 | 5.93 | 7.15 | 6.98 | 7.18 | 12.35 | 0.688 |
| 7 | 2 (0) | 203.64 (+α) | 0.4 (0) | 7.95 | 6.50 | 6.90 | 7.00 | 7.11 | 14.20 | 0.528 |
| 8 | 1.5 (−1) | 150 (−1) | 0.5 (1) | 8.18 | 6.95 | 6.80 | 7.00 | 7.12 | 15.00 | 0.466 |
| 9 | 1.5 (−1) | 150 (−1) | 0.3 (−1) | 8.22 | 6.78 | 6.13 | 6.85 | 6.94 | 16.25 | 0.421 |
| 10 | 2 (0) | 170 (0) | 0.57 (+α) | 7.85 | 6.68 | 7.05 | 7.38 | 7.33 | 12.65 | 0.595 |
| 11 | 1.16 (−α) | 170 (0) | 0.4 (0) | 8.20 | 7.00 | 6.33 | 7.00 | 6.89 | 13.50 | 0.357 |
| 12 | 2.84 (+α) | 170 (0) | 0.4 (0) | 7.68 | 5.86 | 6.95 | 6.75 | 6.52 | 14.80 | 0.619 |
| 13 | 2 (0) | 170 (0) | 0.4 (0) | 8.05 | 6.58 | 7.15 | 7.28 | 7.61 | 13.90 | 0.568 |
| 14 | 2.5 (1) | 150 (−1) | 0.3 (−1) | 7.85 | 6.10 | 6.51 | 7.06 | 6.89 | 18.45 | 0.459 |
| 15 | 2 (0) | 170 (0) | 0.23 (−α) | 8.10 | 6.78 | 6.95 | 7.20 | 7.16 | 20.65 | 0.498 |
| 16 | 2 (0) | 170 (0) | 0.4 (0) | 7.95 | 6.38 | 7.05 | 7.43 | 7.45 | 12.95 | 0.536 |
| 17 | 2 (0) | 170 (0) | 0.4 (0) | 8.03 | 6.43 | 7.30 | 7.10 | 7.24 | 13.40 | 0.551 |
| 18 | 2 (0) | 136.36 (−α) | 0.4 (0) | 8.05 | 6.48 | 7.03 | 6.70 | 7.19 | 13.65 | 0.508 |
| 19 | 2 (0) | 170 (0) | 0.4 (0) | 8.10 | 6.50 | 7.20 | 7.43 | 7.29 | 13.80 | 0.538 |
| 20 | 2.5 (1) | 190 (1) | 0.3 (−1) | 7.90 | 7.10 | 6.95 | 7.13 | 7.13 | 18.35 | 0.472 |
* A,B,C: actual values, a,b,c: coded values, α: axial distance from the centre point
The regression coefficients were represented as β0 (constant term), β1, β2 and β3 (linear terms), β11, β22 and β33 (quadratic terms), β12, β13 and β23 (interactive terms) and E (random error).
The significant terms of the model were found by analysis of variance (ANOVA) for each response (Table 2) with 1 and 5% levels of confidence. The accuracy and precision of the model were determined using F-value, coefficient of regression (R2), and coefficient of variation (CV) (Montgomery and Myers 1995). All analyses were performed in triplicate and evaluated for all responses. The predicted values generated by RSM design were then compared with actual values using t test (Table 3).
Table 2.
Regression coefficients and ANOVA of fitted quadratic model for sensory and physical responses
| Factors | Sensory responses | Physical responses | |||||
|---|---|---|---|---|---|---|---|
| Color and appearance | Flavor | Consistency | Sweetness | Overall acceptability | Expressible serum (mL/50 mL) | Viscosity (Pa.s) | |
| Intercept | 8.02 | 6.80 | 7.07 | 7.33 | 7.39 | 13.15 | 0.544 |
| A:SPI | −0.217** | −0.274** | 0.219** | −0.026ns | −0.031ns | 0.017ns | 74.954** |
| B:sucralose | −0.006ns | 0.033ns | 0.013ns | 0.070ns | 0.012ns | 0.130ns | −0.246ns |
| C:pectin | −0.087** | −0.050ns | 0.136* | 0.021ns | 0.056ns | −2.065** | 56.685** |
| AB | −0.071* | 0.135ns | 0.049ns | −0.051ns | 0.053ns | −0.069ns | −2.125ns |
| AC | −0.019ns | −0.208* | 0.011ns | −0.044ns | −0.005ns | −1.244** | 44.875** |
| BC | −0.071* | −0.128ns | −0.129ns | −0.031ns | −0.027ns | 0.056ns | −2.125ns |
| A2 | −0.011ns | −0.054ns | −0.199** | −0.144ns | −0.246** | 0.377* | −18.578ns |
| B2 | 0.010ns | −0.033ns | −0.084ns | −0.153** | −0.089* | 0.297ns | −7.971ns |
| C2 | 0.001ns | 0.052ns | −0.072ns | 0.003ns | −0.056ns | 1.261** | 2.105ns |
| R2 | 0.91 | 0.75 | 0.82 | 0.80 | 0.84 | 0.96 | 0.92 |
| % CV | 3.12 | 4.28 | 2.93 | 2.57 | 3.68 | 4.86 | 6.54 |
| Lack of fit | 2.08ns | 1.20ns | 1.39ns | 0.34ns | 0.63ns | 4.79ns | 3.31ns |
| Model F value | 11.45** | 3.34* | 5.23** | 4.39* | 5.80** | 26.69** | 13.60** |
* Significant at 5% level (P < 0.05); ** Significant at 1% level (P < 0.01); ns non-significant (P > 0.05)
Table 3.
Predicted and actual values of sensory and physical responses of optimized smoothie
| Responses | Predicted valuesa | Actual valuesb,ns |
|---|---|---|
| Color and appearance | 8.02 | 8.00 |
| Flavor | 6.80 | 7.02 |
| Consistency | 7.07 | 7.11 |
| Sweetness | 7.33 | 7.28 |
| Overall acceptability | 7.39 | 7.35 |
| Expressible serum (mL/50 mL) | 13.15 | 14.06 |
| Viscosity (Pa.s) | 0.544 | 0.554 |
ns no significant differences between predicted and actual values (P > 0.05)
aPredicted values suggested by Design Expert 8.0.7.1 software
bActual values of optimized product
Chemical analysis of smoothie
The formulated smoothie was analysed for total solids, total carbohydrate, protein, fat and ash as per AOAC methods (AOAC 2000). The total dietary fiber content was analysed using the Megazyme total dietary fiber assay kit.
Sensory evaluation
Sensory responses of smoothie were evaluated by a trained sensory expert panel of ten members using a 9-point hedonic scale (1-4 - disliked extremely-disliked slightly, 5- neither liked nor disliked and 6-9 - liked slightly-liked extremely) for color and appearance, flavor, consistency, sweetness and overall acceptability of the product (Stone et al. 2008).
Viscosity
Viscosity of smoothie was measured using a rheometer (MCR 52, Anton-Paar Inc., VA, USA) fitted with CP75 probe, a cone and plate type geometry. Approximately one gram of the sample was taken and determined for viscosity (Pa.s) at 15 s−1 for 60 s at 4 °C.
Expressible serum
Expressible serum was measured by centrifugation method adopted by Khurana (2006) after slight modifications. Fifty ml of smoothie was centrifuged (Hermle Labnet Z 382K centrifuge, Labnet International Inc., NJ, USA) in 50 mL graduated tubes at 2000 rpm for 10 min at 4 °C. The obtained volume of serum was measured, and the result expressed as mL/50 mL of smoothie.
Results and discussion
Diagnostic check of mathematical modelling for the optimization of ingredients
A formulation of smoothie was optimized using CCRD with three factors (SPI, sucralose and pectin), as shown in Table 1. The statistical parameters, such as F-value, R2 and lack of fit test helped to validate the RSM model. The model is described as adequate and significant when calculated F-value is more than the tabulated F-value at 5% level of confidence, and when R2 values are more than 0.75 (Henika 1982). It is evident from the results depicted in Table 2 that for all sensory and physical responses, the calculated F-value was higher than the table F-value at 5% level of confidence and the R2 values ranged from 0.75 to 0.96, indicating that the derived models for all dependent responses are satisfactory. The lack of fit test measures the fitness of model, which did not result in a significant F-value indicating that the model is highly accurate for selected physical and sensory responses within the range evaluated for smoothie (Table 2). The sign of partial coefficient explains the effect of variables at linear, quadratic and interaction level (Table 2). CV value (which describes the relative dispersion of experimental values from the predicted values of the described model) of more than 10% indicates a larger variation and inadequacy of the model (Montgomery and Myers 1995). The current result shows an accepted CV value for each response ranging from 2.57 to 6.54% (Table 2), reaffirming the adequacy of the model. The response surfaces of the effect of variables on the selected responses during formulation of smoothie are shown in Fig. 2.
Fig. 2.
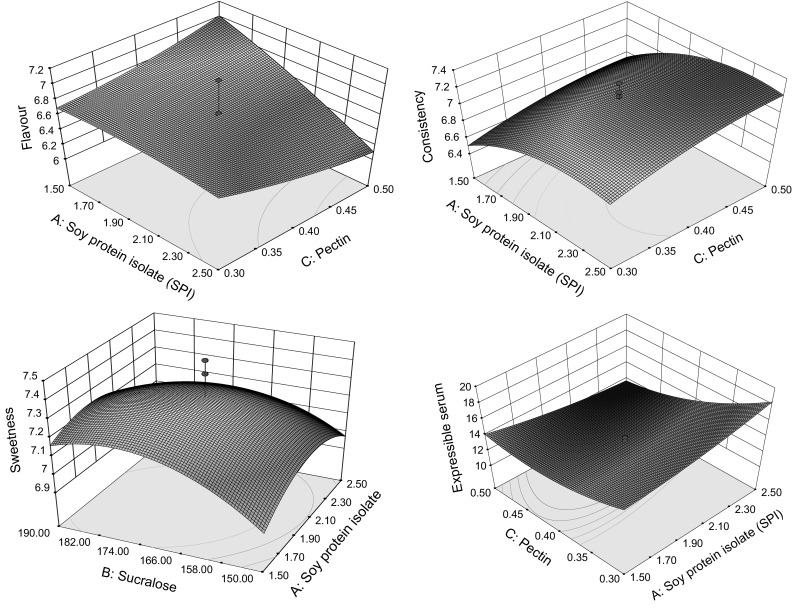
Response surface plots for significant interaction terms for flavor, consistency, sweetness and expressible serum of smoothie
Effect of ingredients on quality of smoothie
Effect on sensory responses
The scores obtained for sensory responses are detailed in Table 1. The color and appearance and flavor scores of smoothie ranged from 7.50 to 8.50 and 5.86 to 7.10 respectively. The score for consistency varied from 6.13 to 7.30, while the sweetness and overall acceptability scores within the ranges from 6.70 to 7.50 and 6.52 to 7.61 respectively.
The color and appearance of smoothie reduced significantly (P < 0.01) with increased level of SPI at linear level. The same significant (P < 0.01) negative trend (Table 2) was observed for pectin too. The light yellow color with greenish tinge of SPI together with the turbidity in the pectin solution contributed to the negative impact on the perception of color. This effect was more prominent at the highest levels of these ingredients. A similar trend was observed in formulation of soy-based dessert by Granato et al. (2010), who mentioned that the addition of soy protein at higher level with pink guava juice had significant negative effect on color attributes during formulation. Kumar and Mishra (2004) also reported the reduction in color score of mango fortified set yogurt with increased levels of pectin.
The flavor score reduced significantly (P < 0.01) with increased level of SPI at linear level (Fig. 2). The interaction effect of SPI and pectin also showed significant (P < 0.05) negative effect (Table 2) on flavor score at linear level. Klein et al. (1995) reported that the potential rejection factor of SPI as a source of cost-effective protein is its offensive off-flavor in food applications. Kinney (2003) attributed the limited growth in demand for soybean and its products solely to its negative flavor image. The negative impact of pectin on flavor perception of the product was supported by Shukla et al. (1986), who observed that pectin is responsible for the reduction in flavor score of yogurt though it helps to develop typical characteristics in the product.
The positive coefficients (Table 2) of estimates for SPI and pectin indicate that the consistency of smoothie increased significantly (P < 0.01 and P < 0.05, respectively) with increased level of SPI and pectin at linear level (Fig. 2). Hettiarachchy and Kalapathy (1998) reported that SPI has a water binding capacity of approximately 35 g/100 g and this functional property of SPI resulted in improving the consistency of smoothie during formulation by enhancing its mouthfeel. The same effect was observed in the preparation of chocolate flavored peanut-soy beverage by Deshpande et al. (2008), who reported that SPI has a tendency to bind water during beverage preparation and hence, the final product had better consistency due to improved viscosity. Pectin can interact and adsorb on casein micelles from milk during acidification and coats them fully at its higher concentration. This phenomenon prevents the dehydration of casein micelles at high heat treatment and lowers their aggregation, thereby leading to the better consistency of product by preventing grittiness (Maroziene and De Kruif 2000). Glahn (1982) reported that pectin helps to improve the consistency of acidic beverages by interaction with milk protein. The same phenomenon could be expected in case of soy protein via electrostatic interactions with pectin (Lam et al. 2008) which resulted in improved consistency of smoothie.
Addition of sucralose showed significant (P < 0.01) negative effect (Table 2) on sweetness of smoothie during formulation at quadratic level. The sweetness score of smoothie increased initially to a maximum value, followed by exponential fall in sweetness score with increased level of sucralose (Fig. 2). After a certain level, the bitter aftertaste of sucralose might have reduced the sweetness score, becoming unacceptable to the experts of sensory panel. Saxena et al. (2015) reported similar results in whey based watermelon beverage, where beyond an optimum level, sucralose led to bitterness in the product.
The coefficient of estimate for overall acceptability model (Table 2) indicates that the overall acceptability of smoothie was significantly (P < 0.01 and P < 0.05; SPI and sucralose respectively) influenced by SPI and sucralose on quadratic terms. Klein et al. (1995) and Kinney (2003) reported that the off-flavor of SPI was the potential reason to limit its use in food applications. A higher level of SPI resulted in intense off-flavor in smoothie and hence, decreased the overall acceptability score in the product. Saxena et al. (2015) observed that use of sucralose beyond its optimum level resulted in bitterness in whey based watermelon beverage. Similarly, a higher level of sucralose resulted in bitter after-taste leading to a reduced overall acceptability score of smoothie.
Effect on physical responses
The scores of smoothie for expressible serum and viscosity ranged from 12.10 to 20.65 mL/50 mL and 0.357 to 0.544 Pa.s (Table 1). Serum separation contributes to an unsightly appearance leading to low customer acceptance of the product. A lower value of expressible serum indicates better stability of smoothie. The coefficient of estimate for the expressible serum model (Table 2) shows that the value of this physical response decreased significantly (P < 0.01) with increased level of pectin at linear level (Fig. 2). The interaction effect of pectin and SPI (Table 2) on expressible serum during formulation of smoothie also exhibited a similar significant (P < 0.01) trend. The basic mechanism of pectin stabilization of acidified beverage involves adsorption of pectin on the surface of acidified casein micelles from milk by electrostatic interactions that result in steric-stabilization of casein micelles. The net negative charge of pectin covered on casein micelles keep them in suspension by electrostatic repulsion and hence, prevent their sedimentation during storage by lowering their aggregation (Glahn 1982; Parker et al. 1994). Pectin also helps to prevent casein from squeezing out during high heat treatment and also, to maintain their integrity after homogenization. According to Syrbe et al. (1998), the aggregation of casein micelles during storage results in whey separation. Lucey et al. (1999) also reported that insufficient amount of pectin in acidic milk gels resulted in failure to adsorb on casein micelles properly and led to large aggregates. These large aggregates then undergo further rearrangement of clumped casein particles, leading to lower water holding capacity during storage. In case of SPI, the electrostatic interactions of 7 and 11 s protein fractions with pectin might have helped to prevent sedimentation and thus, resulted in lower expressible serum separation in smoothie (Hettiarachchy and Kalapathy 1998; Lam et al. 2008). Glahn (1982) also supported that pectin has been widely acceptable as a stabilizer in low pH beverages as a better interaction with protein under acidic condition and hence, prevent the whey separation during storage.
Viscosity imparts better thickening effect, mouthfeel and stability to the product (Rani et al. 2016). The viscosity significantly (P < 0.01) increased (Table 2) with increased level of SPI and pectin at linear level. Their interaction also contributed significant (P < 0.01) positive impact on viscosity of smoothie. The gelling property of pectin and the water binding ability of SPI could have led to higher viscosity of smoothie, becoming more prominent at increased level. However, beyond 0.5% level, pectin had a negative influence on the consistency score (Table 1). Singh and Singh (2012) observed that stabilizer mixtures containing pectin increased viscosity of whey based beverages. Glahn (1982) also reported that the addition of pectin in acid milk beverage increased the viscosity of the product. Addition of soy protein concentrate in cassava starch resulted in increment of viscosity with respect to cassava starch without added with soy protein concentrate (Chinma et al. 2013).
Composition of optimised smoothie
The optimized smoothie contained 16.69 ± 0.25% total solids, 11.54 ± 0.31% total carbohydrates, 3.48 ± 0.06% protein, 1.51 ± 0.17% fat, 0.16 ± 0.01% ash and 2.05 ± 0.11% total dietary fiber. It provides the daily value of 8.16% of total fat and 18.83% protein (Table 4) as per Indian RDA guidelines suggested by ICMR (2010). It also meets the standards prescribed by Food Safety and Standards Authority of India (FSSAI) -2011 under ‘Proprietary Food’ category.
Table 4.
Proximate nutritional content and calories of optimized grab-and-go breakfast smoothie
| Amount per servinga | % Daily valueb | Calories per servingc | Calories per 100 ml | ||
|---|---|---|---|---|---|
| USFDA* | ICMR* | ||||
| Fat | 4.90 ± 0.56 g | 7.54 | 8.16 | 44.10 | 13.6 |
| Total carbohydrate | 37.51 ± 1.01 g | 12.50 | 8.08 | 150.04 | 46.17 |
| Dietary fiber | 6.67 ± 0.37 g | 26.68 | NP | – | – |
| Protein | 11.30 ± 0.20 g | 22.60 | 18.83 | 45.20 | 13.91 |
| Total calories | 239.34 | 73.68 | |||
NP Not prescribed
* % daily values are based on 2000 kilo calories diet for USFDA and 2730 kilo calories for Indian RDA
aAverage of triplicate analysis (mean ± SE)
b% daily values are calculated as per USFDA and ICMR guidelines
cCalorie was calculated as per fat-9 kcal/g, carbohydrates-4 kcal/g, protein-4 kcal/g
Conclusion
The optimized values suggested by RSM design were 1.8% (w/w) SPI, 166.8 ppm sucralose and 0.5% (w/w) pectin, to formulate the grab-and-go breakfast smoothie. The calculated t values for sensory and physical responses were less than table values (Table 3), indicating that there was no significant difference between the predicted values suggested by RSM design and actual values of all responses. The regression analysis of RSM revealed that the interaction between SPI and pectin had significant effect on flavor, expressible serum, and viscosity of the product. The optimized smoothie provides approximately, 239 kilo calories (74 kilo calories per 100 ml), 23% protein and 27% dietary fiber (Table 4) per serving (325 ml), as described by the US Food and Drug Administration (USFDA) and 18.83% protein as per Indian RDA. These specifications meet the USFDA (2013) guidelines for claiming high protein (10 g/serving or more than 20% of Daily Value) and high fiber (5 g/serving or 20% of Daily Value) which renders the optimized smoothie as a high protein, high fiber, grab-and-go breakfast option.
Acknowledgements
The authors are thankful to National Dairy Research Institute, Karnal for providing funding and research facilities. We are also grateful to M/s. Huber India Pvt. Ltd. Mumbai for their generous supply of pectin sample.
References
- AOAC . Official methods of analysis. 17. Gaithersburg: Association of Official Analytical Chemists; 2000. [Google Scholar]
- Ashraf H-RL, Snyder HE. Influence of ethanolic soaking of soybeans on flavor and lipoxygenase activity of soymilk. J Food Sci. 1981;46:1201–1204. doi: 10.1111/j.1365-2621.1981.tb03023.x. [DOI] [Google Scholar]
- Chinma CE, Ariahu CC, Abu JO. Chemical composition, functional and pasting properties of cassava starch and soy protein concentrate blends. J Food Sci Technol. 2013;50:1179–1185. doi: 10.1007/s13197-011-0451-8. [DOI] [PMC free article] [PubMed] [Google Scholar]
- Deshpande R, Chinnan M, McWatter K. Optimization of a chocolate-flavored, peanut–soy beverage using response surface methodology (RSM) as applied to consumer acceptability data. LWT-Food Sci Technol. 2008;41:1485–1492. doi: 10.1016/j.lwt.2007.08.013. [DOI] [Google Scholar]
- Doesburg J, de Vos L (1959) Pasteurized mixtures of fruit juices and milk, with a long shelf life, Int Fruit Juice Congr 2nd Report 32, pp 32–37
- Glahn P. Hydrocolloid stabilization of protein suspensions at low pH. Prog Food Nutr Sci. 1982;6:171–177. [Google Scholar]
- Granato D, Ribeiro JCB, Castro IA, Masson ML. Sensory evaluation and physicochemical optimisation of soy-based desserts using response surface methodology. Food Chem. 2010;121:899–906. doi: 10.1016/j.foodchem.2010.01.014. [DOI] [Google Scholar]
- Hanger L, Lotz A, Lepeniotis S. Descriptive profiles of selected high intensity sweeteners (HIS), HIS blends, and sucrose. J Food Sci. 1996;61:456–459. doi: 10.1111/j.1365-2621.1996.tb14216.x. [DOI] [Google Scholar]
- Henika R. Use of response-surface methodology in sensory evaluation. Food Technol. 1982;36:96–101. [Google Scholar]
- Hettiarachchy N, Kalapathy U. Functional properties of soy proteins. Washington: ACS Publications; 1998. [Google Scholar]
- Indian Council of Medical Research (ICMR) (2010) Nutrient requirements and recommended dietary allowances for Indians. http://icmr.nic.in/final/rda-2010.pdf. Accessed 24 July 2016
- Khurana HK (2006) Development of technology for extended shelf life fruit lassi. Ph.D. Thesis. N.D.R.I.-Karnal, Karnal, Haryana, India
- Kinney AJ. Engineering soybeans for food and health. AgBioForum. 2003;6:1–5. [Google Scholar]
- Klein BP, Perry AK, Adair N. Incorporating soy proteins into baked products for use in clinical studies. J Nutr. 1995;125:666S–674S. doi: 10.1093/jn/125.3_Suppl.666S. [DOI] [PubMed] [Google Scholar]
- Knight I. The development and applications of sucralose, a new high-intensity sweetener. Can J Physiol Pharmacol. 1994;72:435–439. doi: 10.1139/y94-063. [DOI] [PubMed] [Google Scholar]
- Kumar P, Mishra HN. Mango soy fortified set yoghurt: effect of stabilizer addition on physicochemical, sensory and textural properties. Food Chem. 2004;87:501–507. doi: 10.1016/j.foodchem.2003.12.022. [DOI] [Google Scholar]
- Lam M, Paulsen P, Corredig M. Interactions of soy protein fractions with high-methoxyl pectin. J Agric Food Chem. 2008;56:4726–4735. doi: 10.1021/jf073375d. [DOI] [PubMed] [Google Scholar]
- Lucey J, Tamehana M, Singh H, Munro P. Stability of model acid milk beverage: effect of pectin concentration, storage temperature and milk heat treatment. J Texture Stud. 1999;30:305–318. doi: 10.1111/j.1745-4603.1999.tb00219.x. [DOI] [Google Scholar]
- Maroziene A, De Kruif CG. Interaction of pectin and casein micelles. Food Hydrocoll. 2000;14:391–394. doi: 10.1016/S0268-005X(00)00019-9. [DOI] [Google Scholar]
- Montgomery DC, Myers RH. Response surface methodology: process and product optimization using designed experiments. New Jersey: Wiley; 1995. [Google Scholar]
- National Institute of Nutrition (2011) Dietary Guidelines for Indians. http://ninindia.org/dietaryguidelinesforninwebsite.pdf. Accessed 23 July 2017
- Neumark-Sztainer D, Eisenberg ME, Fulkerson JA, Story M, Larson NI. Family meals and disordered eating in adolescents: longitudinal findings from project EAT. Arch Pediatr Adolesc Med. 2008;162:17–22. doi: 10.1001/archpediatrics.2007.9. [DOI] [PubMed] [Google Scholar]
- Parker A, Boulenguer P, Kravtchenko TP. Effect of the addition of high methoxy pectin on the rheology and colloidal stability of acid milk drinks. In: Nishinari K, Doi E, editors. Food hydrocolloids. New York: Springer; 1994. pp. 307–312. [Google Scholar]
- Rackis JJ, Sessa DJ, Honig DH. Flavor problems of vegetable food proteins. J Am Oil Chem Soc. 1979;56:262–271. doi: 10.1007/BF02671470. [DOI] [Google Scholar]
- Rani R, Kumar MHS, Sabikhi L. Process optimisation for a ready-to-serve breakfast smoothie from a composite milk–sorghum base. Int J Dairy Technol. 2016;69:372–379. doi: 10.1111/1471-0307.12269. [DOI] [Google Scholar]
- Saxena D, Chakraborty SK, Sabikhi L, Singh D. Process optimization for a nutritious low-calorie high-fiber whey-based ready-to-serve watermelon beverage. J Food Sci Technol. 2015;52:960–967. doi: 10.1007/s13197-013-1066-z. [DOI] [PMC free article] [PubMed] [Google Scholar]
- Shukla F, Jain S, Sandhu K. Effect of stabilizers and additives on the diacetyl and volatile fatty acids contents of yoghurt. Ind J Dairy Sci. 1986;39:486–488. [Google Scholar]
- Singh AK, Singh K. Utilization of whey for the production of instant energy beverage by using response surface methodology. Adv J Food Sci Technol. 2012;4:104–111. [Google Scholar]
- Singleton N, Rhoads DS. Meal and snacking patterns of students. J School Health. 1982;52:529–534. doi: 10.1111/j.1746-1561.1982.tb04033.x. [DOI] [PubMed] [Google Scholar]
- Smith KJ, Gall SL, McNaughton SA, Blizzard L, Dwyer T, Venn AJ. Skipping breakfast: longitudinal associations with cardiometabolic risk factors in the Childhood Determinants of Adult Health Study. Am J Clin Nutr. 2010;92:1316–1325. doi: 10.3945/ajcn.2010.30101. [DOI] [PubMed] [Google Scholar]
- Stone H, Sidel J, Oliver S, Woolsey A, Singleton RC. Sensory evaluation by quantitative descriptive analysis. In: Gacula MC, editor. Desriptive sensory analysis in practice. Connecticut: Food and Nutrition Press Inc.; 2008. pp. 23–34. [Google Scholar]
- Syrbe A, Bauer W, Klostermeyer H. Polymer science concepts in dairy systems-an overview of milk protein and food hydrocolloid interaction. Int Dairy J. 1998;8:179–193. doi: 10.1016/S0958-6946(98)00041-7. [DOI] [Google Scholar]
- US Food and Drug Administration (2013) Appendix B: additional requirements for nutrient content claims. Guidance for Industry: A Food Labeling Guide. https://www.fda.gov/downloads/Food/GuidanceRegulation/UCM265446.pdf. Accessed 23 July 2017
- USDA Food and Nutrition Service (2013) Team Nutrition. https://www.fns.usda.gov/tn/team-nutrition. Accessed 23 July 2017