

SUMMARY
What is known and objective
Hypertension is a leading cause of death and major contributor to heart attacks, strokes, heart and kidney failure. Anti-hypertensive (HTN-medication) non-adherence contributes to uncontrolled hypertension. Effective initiatives to improve uncontrolled hypertension include a team-based approach with home blood pressure (BP) monitoring. Our study objective was to evaluate whether objectively measured medication adherence was influenced by home BP telemonitoring and pharmacist management.
Methods
We analyzed HTN-medication adherence in 240 patients who received home BP telemonitoring and pharmacist intervention (TI). Adherence was measured based on prescription fills and the proportion of days covered (PDC). HTN-medications continued pre- to post-baseline was similar for telemonitoring intervention (TI) and usual care (UC) patients (rate ratio=1.00, p=0.90).
Results and discussion
More HTN-medications were discontinued pre- to post-baseline in TI patients (rate ratio=1.38, p=0.04). Similarly, more HTN-medications were added in TI patients (rate ratio=2.46, p<0.001). The proportion with a mean PDC>=0.8 for HTN-medications added after baseline and overall adherence did not differ between groups.
What is new and conclusion
Medication adherence was high in both groups; however, medication adherence was not significantly altered by the intervention. There were more medication modifications and greater medication intensification among TI patients.
Keywords: adherence, antihypertensive, clinical pharmacy, disease management, hypertension
WHAT IS KNOWN AND OBJECTIVE
Hypertension, a major risk factor for heart attacks, stroke, heart failure and kidney failure affects roughly 30% of U.S. adults and is the most common chronic condition for which patients seek primary care.1 High blood pressure (BP) is the largest contributor to all-cause and cardiovascular mortality in the United States.2 Compared with other modifiable cardiovascular risk factors, poorly controlled high BP is the leading cause of death among women and the second leading cause of death among men.3 Recent initiatives have focused on methods to improve care for individuals with hypertension not controlled to recommended BP levels.4–6 The most effective methods to improve BP control include nurses or pharmacists within clinical practices in a team-based approach.7–11 Also, home BP monitoring has been shown to be a useful adjunct to team-based care for hypertension.12
Medication non-adherence is often cited among the reasons for high rates of uncontrolled BP in addition to lack of patient awareness, physician reluctance to intervene (therapeutic inertia), and physiologic treatment resistance.13,14 We previously reported the results of a cluster-randomized trial comparing usual care (UC) to an intervention combining home BP telemonitoring with pharmacist management (Telemonitoring Intervention, TI).15 At 6 months of follow-up, 72% of participants in the TI group had achieved BP control, compared with 45% in the UC group (p<0.001). The TI group also had greater lowering of systolic BP (SBP) by 11.3 mmHg and diastolic BP (DBP) by 5.8 mmHg. The improvement in BP persisted through 12 and 18 months of follow-up. A subsequent multivariable analysis to evaluate key mediators of the improved BP in the TI group showed nearly half (47%; 5.3mmHg change) of the 11.3 mmHg difference in change in SBP was mediated by increased medication treatment intensity (24%) and increased home BP monitor use (19%).
The study’s multifaceted intervention also targeted medication adherence. Self-reported medication adherence improved more in the TI group compared with UC; however, it was not a significant mediator of the greater blood pressure lowering in the TI group. One potential explanation is the high rate of medication adherence at baseline may have left little room for further improvement.16 Another possibility is that measurement error inherent in self-reported adherence made it difficult to discern any improvement. In the present analysis, we used pharmacy claims to determine whether objectively measured medication initiation, discontinuation, and adherence were influenced by the home BP telemonitoring and pharmacist management intervention.
METHODS
Hyperlink Clinical Trial
The present analysis included a subset of data obtained from the Home Blood Pressure Telemonitoring and Case Management to Control Hypertension (Hyperlink) study.15 In the Hyperlink study, patients with uncontrolled hypertension (two elevated blood pressure measurements ≥140/90 mm Hg prior to the baseline visit and an elevated blood pressure measurement ≥140/90 mm Hg, or ≥130/80 mm Hg if the patient had diabetes or kidney disease at the baseline research visit) were enrolled and randomized. The primary outcome was the change in SBP between the baseline and 6-month clinic visits. Patients were enrolled from March 2009 through April 2011. All participants provided informed consent, and the study protocol was approved by the HealthPartners Institutional Review Board.
Hyperlink Study Site, Population, Interventions and Outcome Measures
Hyperlink was a two-group cluster-randomized clinical trial conducted at HealthPartners Medical Group, a multispecialty practice in the Minneapolis-St. Paul, MN metropolitan area that is part of an integrated health system. Study recruitment, enrollment, and outcomes from the Hyperlink trial are described previously.15–17 In the Hyperlink trial, 2020 patients were screened and 450 were identified as eligible and volunteered to participate. During the study, 16 of 21 HealthPartners primary care clinics had a Medication Therapy Management (MTM) pharmacist on-site at least once weekly and each clinic had a clinical practice agreement between the MTM pharmacists and primary care physicians allowing pharmacists to prescribe and change antihypertensive therapy within specified parameters.18 The 16 study clinics were randomly assigned to either TI (n=8) or UC (n=8) as previously described.17 All study patients received standard verbal advice and educational material on hypertension.
During the clinical trial, all TI patients received home BP monitors that stored and transmitted BP data to a secure website and underwent in-person MTM pharmacist visits.17 Following the initial in-person visit, patients and pharmacists met every 2 weeks via telephone until BP control was sustained for 6 weeks; the visit frequency was then reduced to monthly through month 6 and every 2 months through month 12 at which time the intervention ended. During the telephone visits, pharmacists emphasized lifestyle changes and medication adherence. The pharmacists assessed and adjusted antihypertensive drug therapy based on an algorithm using the percentage of home BP readings meeting goal.17
Data Collection, Sources, and Variables
The current analysis was conducted on Hyperlink study patients with health plan membership, including prescription coverage in the 12 months preceding or the 12-month period following the baseline visit and a prescription fill for an anti-hypertensive medication (HTN-medication) in either the 12 months preceding or following the baseline visit. (Figure 1) Medication inventories obtained at the baseline and 12-month study visits included all HTN-medications taken by study patients and were used to identify current HTN-medications at each time point for the current analysis. (Figure 2) Patients were asked to bring their current medications to each study visit. The medication inventory included a review of the patient’s medication list within the electronic medical record (EMR), and medications brought to the study visit. Any differences were reconciled. Prescription fills for HTN-medication(s) listed on the baseline and 12-month medication inventory were identified from pharmacy claims in either the 12 months preceding or following the baseline visit. Medications were considered discontinued if they were identified on the baseline inventory but not on 12 month inventory. Medications were considered added if they were identified on the 12-month inventory, but not on the baseline inventory. Medications were considered continued if they appeared on both the baseline and 12-month inventory. Medications listed on the baseline or 12-month inventory and for which no prescription fill was identified were not retained for analysis.
Figure 1.
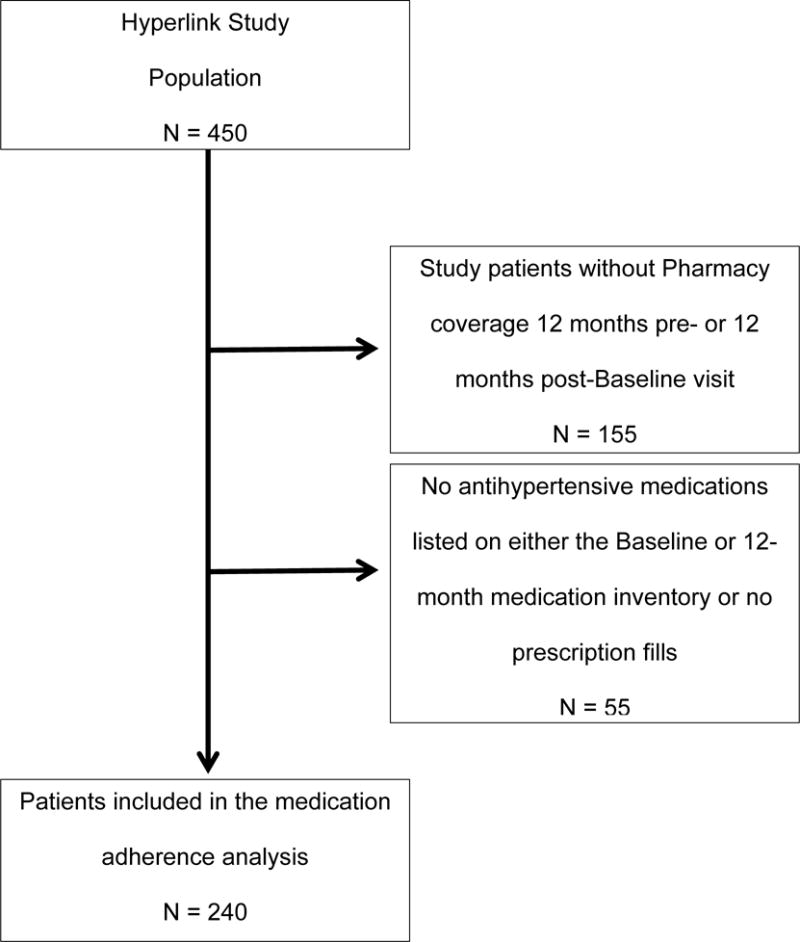
Flow diagram describing identification of the medication adherence analysis subpopulation from the Hyperlink Study
Figure 2.
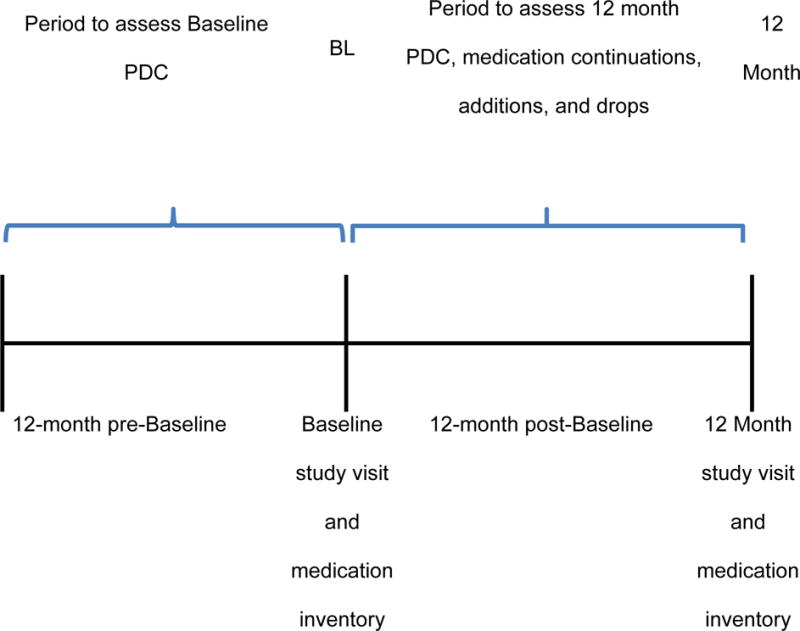
Description of the analysis periods relative to the Baseline and 12-month clinic visits for the Hyperlink Study patients included in the medication adherence analysis.
Medication adherence was calculated based on the proportion of days covered (PDC) for each medication for the 12-month study period pre- and post-baseline visit based on the method described by Vollmer, et al.19 This measure is based on the number of days of HTN-medication supply divided by the number of days in the observation interval using the following equation:
The PDC was calculated initially at the level of medication name to account for medication discontinuations or new starts. When there was more than one medication per patient, the patient’s mean PDC across all individual medication PDC values at baseline or 12 months was computed. This person-level mean PDC value was also converted into a binary indicator of adherence to HTN-medications (PDC>=0.8 coded as 1, otherwise coded as 0).
Statistical Analysis
Differences in patient baseline characteristics in the TI and UC groups were tested with independent samples t-tests and Pearson chi-square tests. Counts of HTN-medications in the baseline inventory, medications continued from baseline to the 12-month inventory, medications dropped from the baseline inventory, and medications added to the baseline inventory were summarized as counts and proportions. Differences in medication counts by study arm were tested with Poisson regression and expressed using rate ratios. The mean and standard deviation of the person-level mean PDC for all HTN-medications in the baseline inventory and the 12-month inventory were presented by study arm. Differential change in mean PDC from baseline to 12 months by study arm and a binary indicator of PDC >=0.8 were tested using general (identity link, normal error distribution) and generalized (logit link, binomial error distribution) linear mixed models. The p-value from the interaction term of study arm (TI vs. UC) and time (baseline vs. 12 months) in these models served as the test of differential change of PDC over time by study arm. As a sensitivity analysis, a medication-level PDC analysis was also conducted using a GEE approach to account for multiple medications per patient.
RESULTS
The analytic sample consisted of 240 unique patients (112 UC, 128 TI) who had prescription coverage in the 12 months pre-baseline or 12-month post-baseline visit and who had at least one HTN-medication fill in the same time period. The mean patient age at baseline was 64.6 (SD 11.9), SBP was 148.8 mmHg (SD 12.9), DBP 82.4 mmHg (SD 12.1) (Table 1). Slightly less than half of patients (47%) were female, 84% were white non-Hispanic, and the mean BMI was 31.4 kg/m2 (SD=6.3). About 81% had education beyond high school and 44% were employed. None of the baseline variables were statistically significantly different by study group.
Table 1.
Baseline characteristics of patients with at least one anti-hypertensive medication fill in the 12 months prior to the baseline visit or 12 months after the baseline visit (n=240).
| Total (n=240) |
Usual Care (n=112) |
Telemonitoring Intervention (n=128) |
p | |
|---|---|---|---|---|
| Age, mean (SD) | 64.6 (11.9) | 63.6 (12.2) | 65.6 (11.6) | 0.20 |
| Female | 113 (47.1) | 50 (44.6) | 63 (49.2) | 0.48 |
| Non-Hispanic white | 202 (84.2) | 92 (82.4) | 110 (85.9) | 0.42 |
| Education level | ||||
| <= High school or GED | 44 (18.9) | 21 (19.4) | 23 (18.4) | 0.59 |
| Some college or technical school | 79 (33.9) | 41 (38.0) | 38 (30.4) | |
| 4 year college degree | 33 (14.2) | 14 (13.0) | 19 (15.2) | |
| > 4 year college degree | 77 (33.1) | 32 (29.6) | 45 (36.0) | |
| Paid working status | ||||
| Full-time | 77 (33.1) | 37 (34.3) | 40 (32.0) | 0.28 |
| Part-time | 26 (11.2) | 11 (10.2) | 15 (12.0) | |
| Retired | 112 (48.1) | 48 (44.4) | 64 (51.2) | |
| Not working | 18 (7.7) | 12 (11.1) | 6 (4.8) | |
| Body mass index kg/m2, mean (SD) | 31.4 (6.3) | 31.8 (6.2) | 31.1 (6.4) | 0.41 |
| BP at baseline, mean (SD), mm Hg | ||||
| Systolic | 148.8 (12.9) | 147.8 (13.2) | 149.7 (12.6) | 0.25 |
| Diastolic | 82.4 (12.1) | 82.3 (12.3) | 82.5 (11.9) | 0.87 |
Values expressed as number (percentage) unless otherwise noted
The number of HTN-medications in the baseline inventory was not statistically different between groups (rate ratio=1.07, SE=0.10). (Table 2) At the 12 month inventory the number of HTN-medications was higher for TI than UC patients (rate ratio=1.36, SE=0.13). In particular, TI patients were less likely to be treated with one medication and were more likely to be treated with 3 or 4 medications. The number of HTN-medications continued from baseline to 12 months was similar by study group (rate ratio=1.00, SE=0.12). There were more medications dropped from the baseline inventory in TI compared to UC (rate ratio=1.38, SE=0.22). Finally, the number of medications added to the baseline inventory was significantly higher in TI compared to UC (rate ratio=2.46, SE=0.42).
Table 2.
Anti-hypertensive medication changes following baseline inventory among patients having at least one anti-hypertensive medication fill in the 12 months prior to the baseline visit or 12 months after the baseline visit (n=240).
| Usual Care patients (n=112) N (%) |
Telemonitoring Intervention patients (n=128) N (%) |
Rate ratio (SE), TI vs. UC | P | |
|---|---|---|---|---|
| Number of anti-hypertensive medications per patient in baseline inventory | 1.07 (0.10) | 0.49 | ||
| 0 medications | 11 (9.8) | 19 (14.8) | ||
| 1 | 42 (37.5) | 38 (29.7) | ||
| 2 | 32 (28.6) | 33 (25.8) | ||
| 3 | 21 (18.8) | 24 (18.8) | ||
| 4 | 5 (4.5) | 10 (7.8) | ||
| 5 | 1 (0.9) | 3 (2.3) | ||
| 6 | 0 (0) | 1 (0.8) | ||
| Number of anti-hypertensive medications per patient in 12 month inventory | 1.36 (0.13) | 0.002 | ||
| 0 medications | 20 (17.9) | 22 (17.2) | ||
| 1 | 43 (38.4) | 23 (18.0) | ||
| 2 | 25 (22.3) | 31 (24.2) | ||
| 3 | 18 (16.1) | 28 (21.9) | ||
| 4 | 4 (3.6) | 21 (16.4) | ||
| 5 | 2 (1.8) | 3 (2.3) | ||
| Number of anti-hypertensive medications continued (present in both baseline and 12 month post-baseline medication inventories) per patient* | 1.00 (0.12) | 0.99 | ||
| 0 medications | 27 (26.7) | 31 (28.4) | ||
| 1 | 40 (39.6) | 37 (33.9) | ||
| 2 | 18 (17.8) | 27 (24.8) | ||
| 3 | 14 (13.9) | 11 (10.1) | ||
| 4 | 2 (2.0) | 3 (2.8) | ||
| Number of anti-hypertensive medications dropped from baseline inventory per patient* | 1.38 (0.22) | 0.04 | ||
| 0 medications | 59 (58.4) | 52 (47.7) | ||
| 1 | 24 (23.8) | 34 (31.2) | ||
| 2 | 10 (9.9) | 12 (11.0) | ||
| 3 | 8 (7.9) | 4 (3.7) | ||
| 4 | 0 (0) | 4 (3.7) | ||
| 5 | 0 (0) | 3 (2.8) | ||
| Number of anti-hypertensive medications added since baseline inventory per patient | 2.46 (0.42) | <0.001 | ||
| 0 medications | 77 (68.8) | 46 (35.9) | ||
| 1 | 24 (21.4) | 42 (32.8) | ||
| 2 | 10 (8.9) | 32 (25.0) | ||
| 3 | 1 (0.9) | 7 (5.5) | ||
| 4 | 0 | 1 (0.8) |
p-values from Poisson regression
Patients with no medications filled prior to the baseline visit are excluded from this analysis. Resulting sample sizes are n=101 for usual care and n=109 for telemonitoring intervention.
Patient-level mean PDC values for all filled HTN-medications in the baseline or 12-month inventory, for medications continued, and for medications added are shown in Table 3. There were no statistically significant differences in change in PDC over time by study arm for any of these, although the proportion of patients in the TI arm with PDC>=0.8 for newly added medications was marginally higher than in the UC arm (0.90 vs. 0.77, p=0.07). These analyses yielded similar results when repeated at the medication level, accounting for medications clustered within patients (data not reported).
Table 3.
Proportion of days covered (PDC) and proportion adherent to anti-hypertensive medications (HTN-medications) filled by patients having at least one HTN-medication fill in the 12 months prior to the baseline visit or 12 months after the baseline visit (n=240).
| Usual Care (n=112) |
Telemonitoring Intervention (n=128) |
P | |||
|---|---|---|---|---|---|
| All HTN-medications | |||||
|
| |||||
| Baseline inventory (n=101 pts) | 12 mo inventory (n=92 pts) | Baseline inventory (n=109 pts) | 12 mo inventory (n=106 pts) | ||
|
| |||||
| Proportion of days covered, mean (SE) | 0.91 (0.02) | 0.90 (0.01) | 0.95 (0.01) | 0.93 (0.01) | 0.91† |
| Proportion adherent, PDC >= 0.80 (SE) | 0.85 (0.04) | 0.78 (0.05) | 0.89 (0.03) | 0.88 (0.03) | 0.51† |
| HTN-medications continued (present in baseline and 12 month inventories) | |||||
|
| |||||
| Baseline inventory (n=74 pts) | 12 mo inventory (n=74 pts) | Baseline inventory (n=78 pts) | 12 mo inventory (n=78 pts) | ||
|
| |||||
| Proportion of days covered, mean (SE) | 0.94 (0.02) | 0.91 (0.02) | 0.95 (0.02) | 0.93 (0.02) | 0.88† |
| Proportion adherent, PDC >= 0.80 (SE) | 0.90 (0.04) | 0.84 (0.05) | 0.91 (0.03) | 0.85 (0.04) | 0.99† |
| HTN-medications added (not present at baseline but present in 12 month inventory) | |||||
|
| |||||
| Baseline inventory | 12 mo inventory (n=35 pts) | Baseline inventory | 12 mo inventory (n=82 pts) | ||
|
| |||||
| Proportion of days covered, mean (SE) | NA | 0.88 (0.02) | NA | 0.96 (0.01) | †† |
| Proportion adherent, PDC >= 0.80 (SE) | NA | 0.77 (0.07) | NA | 0.90 (0.03) | 0.07 |
Notes
p-value for group by time interaction term.
Statistical testing was not conducted on means due to skewed PDC.
Proportion of days covered (PDC) is computed as the mean of all HTN- medications in the med inventory in the pre- or post-baseline time period. Proportion adherent is computed as 1 if the mean PDC >=0.8 and 0 otherwise.
Means and proportions are model-based from general and generalized linear mixed models.
DISCUSSION
Overall, medication adherence did not change over time in the TI group compared with the UC group. However, medication adherence was high in both groups pre-intervention (mean PDC≥0.9); therefore leaving little room for improvement in either group. More medication stops and new medication starts occurred in the TI group compared with UC suggesting evidence-based, individualized, active medication management (medication intensification) by the MTM pharmacists based on home BP monitoring. Moreover, there was a suggestion that adherence to newly added medications was higher in the TI group compared with UC. Thus, the present data provide a more nuanced view of how improved adherence may have contributed to the effectiveness of the intervention, even if overall HTN-medication adherence was not significantly improved.
It is possible that medication intensification may be more important to achieving BP control than medication adherence.20,21 Vigen, et al. evaluated medication adherence among 162,879 patients enrolled in Cardiovascular Research Network Hypertension Registry.20 Adherence was calculated using PDC, including a summary estimate for those receiving multiple HTN-medications. The mean PDC was 0.77 (SD 0.28) and a multivariable analysis demonstrated that greater adherence was significantly associated with greater BP control, adjusted OR 1.28 (95% CI 1.26–1.29, P<0.001). However, treatment intensification had an even stronger association with BP control, adjusted OR 1.55 (95% CI 1.53–1.57, P<0.001). Likewise, a study conducted in a cohort of patients with resistant hypertension demonstrated that average medication adherence, determined by PDC over 12-months was 84.7% among 3,548 patients.21 Medication adherence was marginally associated with BP control in the unadjusted analysis; however, in the adjusted analysis the association was lost, OR 1.18 (95% CI 0.94–1.47, P=0.15). Treatment intensity was significant in both the unadjusted and adjusted analyses, unadjusted OR 1.6 (95% CI 1.54–1.66, P<0.01) and adjusted OR 1.64 (95% CI 1.58–1.71, P<0.01). Further, Fontil, et al. demonstrated in an individual-level Monte Carlo microsimulation model of BP management that idealized medication intensification had a far greater effect on improving BP control rates compared with UC (71% vs. 18%) than either increasing visit frequency (35%) or medication adherence (26%).22 When all three processes were idealized, BP control was predicted to be 95%. Thus, while adherence to medication therapy is necessary, it may not be sufficient for achieving blood pressure control.
We previously reported that self-reported medication adherence was not a significant mediator of BP control in a multivariable analysis and only accounted for 0.6% of the effect on the change in BP (−0.07 mmHg).16 The highest level of medication adherence (0 out of 4 points on the 4-item Morisky scale) was self-reported by 67% of patients in both TI and UC groups at baseline.15 Adherence was greater in the TI group at the 6-month follow up visit (77%, P<0.05), but returned to 68% at the 12-month visit and did not differ from the UC group. The present analysis utilizing pharmacy claims confirms high adherence to HTN-medications and did not demonstrate a significant difference in overall medication adherence at baseline or 12 months or among the HTN-medications continued between the two study periods. High medication adherence rates within our site are likely related to the medication coverage program within integrated health plans and enrollment of motivated study volunteers as demonstrated elsewhere.23
Strengths of this analysis include inclusion of the subset of patient members with pharmacy plan coverage allowing for the collection of pharmacy fills regardless of the pharmacy used. Our analysis was based on the medication inventory obtained at study visits. We believe this data source is an accurate representation of the patient’s intended medication regimen, allowing us to separately analyze adherence to medications continued and those newly added. A limitation of this analysis is that medication orders were not obtained and compared with pharmacy fills; therefore the degree of primary non-adherence or adherence to medications started and stopped between the medication inventories is unknown. Most EMR systems do not include reliable stop orders to determine the reason fills may have ceased, eg, if the patient discontinued a medication on their own or because the physician recommended discontinuation, and the reason for the medication discontinuation. Patients included in this analysis are well-educated, have a drug coverage benefit, and volunteered to participate in the study; therefore, the results may not be generalizable to all populations. Patients with other forms of insurance or no insurance may demonstrate different rates of medication adherence. It is also possible that pharmacy claims may be missing if patients paid for their prescriptions with cash; however, we anticipate this is a small proportion of apparent non-adherence.
WHAT IS NEW AND CONCLUSION
Although medication adherence was high among both the TI and UC patients, it was not significantly altered by the intervention. There were more medication modifications and greater medication intensification among TI patients. In clinical settings with high levels of medication adherence, clinical pharmacists may still improve hypertension care by focusing on optimizing HTN-medication regimens.
Acknowledgments
SOURCE OF FUNDING:
The Hyperlink study was funded by a grant from the National Heart, Lung, and Blood Institute (R01 HL090965).
Footnotes
DISCLOSURES:
Dr. Sperl-Hillen reports that she is a listed inventor on US patent 8,388,348 B2 titled “Disease Treatment Simulation.” She is a non-paid member of the board of SimCare Health, a company that is disseminating a provider education computer program that uses the technology under a royalty-bearing license agreement from HealthPartners. These activities are not related to the content of this manuscript.
CONFLICT OF INTEREST STATEMENT: None of the other authors reports potential conflicts of interest.
References
- 1.Mozaffarian D, Benjamin EJ, Go AS, et al. Heart disease and stroke statistics–2015 update: a report from the American Heart Association. Circulation. 2015;131(4):e29–322. doi: 10.1161/CIR.0000000000000152. [DOI] [PubMed] [Google Scholar]
- 2.Go AS, Mozaffarian D, Roger VL, et al. Executive summary: heart disease and stroke statistics–2014 update: a report from the American Heart Association. Circulation. 2014;129(3):399–410. doi: 10.1161/01.cir.0000442015.53336.12. [DOI] [PubMed] [Google Scholar]
- 3.Danaei G, Ding EL, Mozaffarian D, et al. The preventable causes of death in the United States: comparative risk assessment of dietary, lifestyle, and metabolic risk factors. PLoS medicine. 2009;6(4):e1000058. doi: 10.1371/journal.pmed.1000058. [DOI] [PMC free article] [PubMed] [Google Scholar]
- 4.Gillespie CD, Hurvitz KA. Prevalence of hypertension and controlled hypertension - United States, 2007–2010. MMWR Surveill Summ. 2013;62(Suppl 3):144–148. [PubMed] [Google Scholar]
- 5.Go AS, Bauman MA, Coleman King SM, et al. An effective approach to high blood pressure control: a science advisory from the American Heart Association, the American College of Cardiology, and the Centers for Disease Control and Prevention. Journal of the American College of Cardiology. 2014;63(12):1230–1238. doi: 10.1016/j.jacc.2013.11.007. [DOI] [PubMed] [Google Scholar]
- 6.Frieden TR, King SM, Wright JS. Protocol-based treatment of hypertension: a critical step on the pathway to progress. JAMA. 2014;311(1):21–22. doi: 10.1001/jama.2013.282615. [DOI] [PMC free article] [PubMed] [Google Scholar]
- 7.Walsh JM, McDonald KM, Shojania KG, et al. Quality improvement strategies for hypertension management: a systematic review. Med Care. 2006;44(7):646–657. doi: 10.1097/01.mlr.0000220260.30768.32. [DOI] [PubMed] [Google Scholar]
- 8.Carter BL, Rogers M, Daly J, Zheng S, James PA. The potency of team-based care interventions for hypertension: a meta-analysis. Arch Intern Med. 2009;169(19):1748–1755. doi: 10.1001/archinternmed.2009.316. [DOI] [PMC free article] [PubMed] [Google Scholar]
- 9.Community Preventive Services Task F. Team-based care to improve blood pressure control: recommendation of the Community Preventive Services Task Force. American journal of preventive medicine. 2014;47(1):100–102. doi: 10.1016/j.amepre.2014.03.003. [DOI] [PubMed] [Google Scholar]
- 10.Proia KK, Thota AB, Njie GJ, et al. Team-based care and improved blood pressure control: a community guide systematic review. American journal of preventive medicine. 2014;47(1):86–99. doi: 10.1016/j.amepre.2014.03.004. [DOI] [PMC free article] [PubMed] [Google Scholar]
- 11.Glynn LG, Murphy AW, Smith SM, Schroeder K, Fahey T. Interventions used to improve control of blood pressure in patients with hypertension. Cochrane Database Syst Rev. 2010(3):CD005182. doi: 10.1002/14651858.CD005182.pub4. [DOI] [PubMed] [Google Scholar]
- 12.Uhlig K, Patel K, Ip S, Kitsios GD, Balk EM. Self-measured blood pressure monitoring in the management of hypertension: a systematic review and meta-analysis. Ann Intern Med. 2013;159(3):185–194. doi: 10.7326/0003-4819-159-3-201308060-00008. [DOI] [PubMed] [Google Scholar]
- 13.Huebschmann AG, Mizrahi T, Soenksen A, Beaty BL, Denberg TD. Reducing clinical inertia in hypertension treatment: a pragmatic randomized controlled trial. J Clin Hypertens (Greenwich) 2012;14(5):322–329. doi: 10.1111/j.1751-7176.2012.00607.x. [DOI] [PMC free article] [PubMed] [Google Scholar]
- 14.Kronish IM, Woodward M, Sergie Z, Ogedegbe G, Falzon L, Mann DM. Meta-analysis: impact of drug class on adherence to antihypertensives. Circulation. 2011;123(15):1611–1621. doi: 10.1161/CIRCULATIONAHA.110.983874. [DOI] [PMC free article] [PubMed] [Google Scholar]
- 15.Margolis KL, Asche SE, Bergdall AR, et al. Effect of home blood pressure telemonitoring and pharmacist management on blood pressure control: a cluster randomized clinical trial. JAMA. 2013;310(1):46–56. doi: 10.1001/jama.2013.6549. [DOI] [PMC free article] [PubMed] [Google Scholar]
- 16.Margolis KL, Asche SE, Bergdall AR, et al. A Successful Multifaceted Trial to Improve Hypertension Control in Primary Care: Why Did it Work? J Gen Intern Med. 2015 doi: 10.1007/s11606-015-3355-x. [DOI] [PMC free article] [PubMed] [Google Scholar]
- 17.Margolis KL, Kerby TJ, Asche SE, et al. Design and rationale for Home Blood Pressure Telemonitoring and Case Management to Control Hypertension (HyperLink): a cluster randomized trial. Contemporary clinical trials. 2012;33(4):794–803. doi: 10.1016/j.cct.2012.03.014. [DOI] [PMC free article] [PubMed] [Google Scholar]
- 18.MTM Fact Sheet. 2012 http://www.cms.gov/Medicare/Prescription-Drug-Coverage/PrescriptionDrugCovContra/MTM.html. Accessed June 15, 2015.
- 19.Vollmer WM, Xu M, Feldstein A, Smith D, Waterbury A, Rand C. Comparison of pharmacy-based measures of medication adherence. BMC health services research. 2012;12:155. doi: 10.1186/1472-6963-12-155. [DOI] [PMC free article] [PubMed] [Google Scholar]
- 20.Vigen R, Shetterly S, Magid DJ, et al. A comparison between antihypertensive medication adherence and treatment intensification as potential clinical performance measures. Circulation Cardiovascular quality and outcomes. 2012;5(3):276–282. doi: 10.1161/CIRCOUTCOMES.112.965665. [DOI] [PubMed] [Google Scholar]
- 21.Daugherty SL, Powers JD, Magid DJ, et al. The association between medication adherence and treatment intensification with blood pressure control in resistant hypertension. Hypertension. 2012;60(2):303–309. doi: 10.1161/HYPERTENSIONAHA.112.192096. [DOI] [PMC free article] [PubMed] [Google Scholar]
- 22.Fontil V, Bibbins-Domingo K, Kazi DS, et al. Simulating Strategies for Improving Control of Hypertension Among Patients with Usual Source of Care in the United States: The Blood Pressure Control Model. J Gen Intern Med. 2015;30(8):1147–1155. doi: 10.1007/s11606-015-3231-8. [DOI] [PMC free article] [PubMed] [Google Scholar]
- 23.Ralston JD, Cook AJ, Anderson ML, et al. Home blood pressure monitoring, secure electronic messaging and medication intensification for improving hypertension control: a mediation analysis. Applied clinical informatics. 2014;5(1):232–248. doi: 10.4338/ACI-2013-10-RA-0079. [DOI] [PMC free article] [PubMed] [Google Scholar]