Abstract
Background
Type 2 diabetes (T2D) is preceded by prolonged insulin resistance and relative insulin deficiency incompletely captured by glucose metabolism parameters, HDL-c and triglycerides.
Objective
Whether lipoprotein insulin resistance score (LPIR), a metabolomic marker, is associated with incident diabetes and improve risk reclassification over traditional markers on extended follow up.
Methods
Among 25,925 non-diabetic women aged 45 years or older, LPIR was measured by nuclear magnetic resonance spectroscopy as a weighted score of VLDL, LDL and HDL particle sizes, and their subsets concentrations. We run adjusted cox regression models for LPIR with incident T2D (20.4 years median follow-up).
Results
Adjusting for demographics, body mass index (BMI), life style factors, blood pressure and T2D family history, the LPIR hazard ratio for T2D (HR per SD, 95% confidence interval [CI]) was 1.95 (1.85, 2.06). Further adjusting for HbA1c, C-reactive protein, triglycerides, HDL and LDL cholesterol, LPIR HR was attenuated to 1.41 (1.31, 1.53) and had the strongest association with T2D after HbA1C in mutually adjusted models. The association persisted even in those with optimal clinical profiles, adjusted HR per SD 1.91 (1.17, 3.13). In participants deemed at intermediate T2D risk by the Framingham Offspring T2D score, LPIR led to a net reclassification of 0.145 (0.117, 0.175).
Conclusion
In middle aged or older healthy women followed prospectively over 20 years, LPIR was robustly associated with incident T2D, including among those with an optimal clinical metabolic profile. LPIR improved T2D risk classification and may guide early and targeted prevention strategies.
Keywords: Metabolomics, Lipoprotein, Insulin Resistance, Type 2 Diabetes, Risk Prediction, Prevention
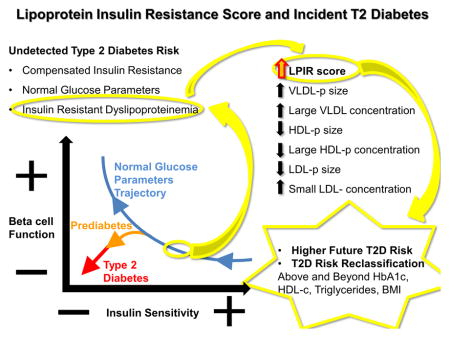
Graphical Abstract
Introduction
Type 2 diabetes (T2D) is a global epidemic with increasing prevalence worldwide.(1) Since T2D is preceded by prolonged pre-clinical insulin resistance and beta cell dysfunction(2, 3), biomarkers of these early processes could identify and guide timely interventions in individuals susceptible to T2D. Despite glucose metabolism measures being good risk predictors and the benchmark for T2D diagnosis, current dysglycemia parameters are insensitive to incipient insulin resistance(4). Non-diabetic individuals have alterations in hepatic lipoprotein metabolism due to insulin resistance that take place when glucose levels are still normal(5). As insulin resistance is associated with future T2D, myocardial infarction and overall mortality in non-diabetic subjects (6–8), even earlier identification of such a process is of utmost importance.
Conventional lipoprotein metabolism biomarkers, such as high-density lipoprotein cholesterol (HDL-c) and triglycerides correlate with insulin resistance and incident T2D (9, 10). However, they do not reflect detailed insulin resistant dyslipoproteinemia. This is characterized by hypersecretion of triglyceride–rich very low density lipoprotein particles (VLDL-p) followed by concerted actions of lipases and transferases, which leads to accumulation of small dense low density lipoprotein particles (LDL-p) and reduction in large HDL particles(11). Despite that each of these lipoproteins has been associated with insulin resistance and incident T2D(12–16), single lipid or lipoprotein parameters may not reflect insulin resistant dyslipoproteinemia overall.
Lipoprotein insulin resistance score (LPIR) is a novel composite metabolomic biomarker that captures the multidimensional effects of insulin resistance on the lipoprotein metabolic chain (17). LPIR is a clinically available test measured by a targeted metabolomics approach using high throughput nuclear magnetic resonance spectroscopy. It is a weighted score of VLDL, LDL and HDL particle sizes; and large VLDL, small LDL, and large HDL particle concentrations that is more strongly related to insulin resistance than each of its individual subclasses(17). Recently, LPIR was associated with incident T2D in a prospective study (12), even among individuals treated with high intensity statin (18). We hypothesized that LPIR may identify T2D risk years prior to dysglycemia onset and other metabolic derangements.
We addressed the association of baseline LPIR with incident T2D in a cohort of non-diabetic healthy middle-aged women at baseline (N=25,925) followed prospectively for over 20 years. We also examined if LPIR can enhance risk prediction over a composite clinical score for incident T2D.
Material and Methods
Population Study
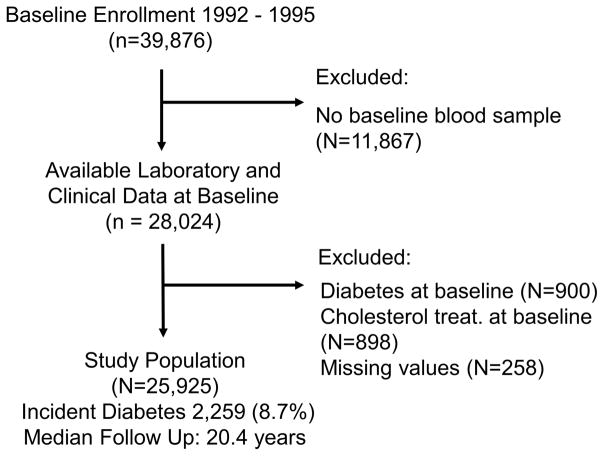
We studied the Women’s Health Study (WHS), a completed double blinded, placebo-controlled trial of low dose aspirin and vitamin E on the prevention of primary cardiovascular events and cancer in apparently healthy female healthcare professionals 45 years and older (19). Individuals were enrolled between 1992 and 1995, and followed prospectively through 2015. All participants signed written informed consent, approved by the Institutional Review Board of Brigham and Women’s Hospital (Boston, MA). At enrollment, participants answered questionnaires for demographics, anthropometrics, medical history, and lifestyle behaviors. From 39,876 individuals, 28,345 consented to have a blood sample stored in liquid nitrogen. We excluded participants with baseline T2D diagnosis, glycated hemoglobin (HbA1c) ≥ 6.5%, those using lipid lowering therapy, and those with no LPIR measurement, resulting in 25,925 individuals (Figure 1).
Figure 1.
Study Population Selection Flow Chart
Population Characteristics
At study entry age, race, smoking, alcohol intake, physical activity, menopausal status, postmenopausal hormone use, and family history of diabetes were self-reported on questionnaires (13). Body mass index (BMI) was measured by weight (kilograms) divided by height (meters) squared.
Laboratory Parameters
Baseline blood was collected in EDTA tubes and stored in liquid nitrogen (−170°C) until the laboratory analysis. Standard lipids were measured by direct assays (Roche Diagnostics, Indianapolis, IN, USA); high-sensitivity C reactive protein (hs-CRP) by a validated assay (Denka Seiken, Niigata, Japan); and HbA1c by turbidimetric immunoinhibition using hemolyzed whole blood or packed red cells (Roche Diagnostics)(13). Fasting plasma glucose was not measured in WHS. Targeted metabolomics approach (Liposcience, Inc. now LabCorp, Raleigh, NC, USA) was used to detect proton nuclear magnetic resonance spectroscopy methyl group signal from lipoprotein subclasses: large, medium and small VLDL; large, medium and small HDL; and large and small LDL concentrations(17). Mean VLDL, LDL, and HDL particle sizes derive from weighted averages of each subclass diameter relative to its mass percentage. LPIR is a composite weighted score of six lipoprotein parameters with homeostatic model assessment insulin resistance (HOMA-IR): VLDL, LDL and HDL average particle size; and concentrations of large VLDL, small LDL and large HDL particles, previously described(17). LPIR interassay repeatability from 80 replicate analyses of 8 plasma pools over 20 days had a coefficient of variation (CV) of 6% within-run and 9% between-run(17). Each parameter value corresponds to a point score from zero to a capped value, and their sum from 0 to 100, with increasing scores signaling more insulin resistance (Table 1).
Table 1.
LPIR Score Calculation Algorithm
| VLDL Size (nm) | VLDL size score | Large VLDL-p (nmol/L) | Large VLDL-p score | LDL size (nm) | LDL size score | Small LDL-p (nmol/L) | Small LDL-p score | HDL size (nm) | HDL size score | Large HDL-p (μmol/L) | Large HDL-p score |
|---|---|---|---|---|---|---|---|---|---|---|---|
| < 39.2 | 0 | < 0.7 | 0 | < 21.0 | 6 | < 90 | 0 | < 8.7 | 20 | < 3.1 | 12 |
| 39.2–41.1 | 1 | 0.7–1.0 | 2 | 21.0 | 5 | 90–104 | 1 | 8.7 | 16 | 3.1–4.0 | 10 |
| 41.2–42.8 | 2 | 1.1–1.3 | 5 | 21.1 | 3 | 105–128 | 3 | 8.8 | 12 | 4.1–5.4 | 9 |
| 42.8–44.3 | 4 | 1.4–1.5 | 7 | 21.2 | 2 | 129–372 | 4 | 8.9 | 10 | 5.5–6.3 | 8 |
| 44.4–46.0 | 6 | 1.6–1.7 | 9 | > 21.2 | 0 | 373–961 | 6 | 9 | 9 | 6.4–7.1 | 6 |
| 46.1–48.1 | 9 | 1.8–2.5 | 12 | > 961 | 8 | 9.1–9.2 | 7 | 7.2–8.0 | 4 | ||
| 48.2–50.3 | 10 | 2.6–3.7 | 15 | 9.3 | 5 | 8.1–9.3 | 2 | ||||
| 50.4–51.6 | 11 | 3.8–5.3 | 18 | 9.4–9.5 | 4 | > 9.3 | 0 | ||||
| 51.7–53.2 | 12 | 5.4–7.9 | 19 | 9.6–9.7 | 2 | ||||||
| 53.3–55.3 | 15 | > 7.9 | 22 | > 9.7 | 0 | ||||||
| 55.4–58.4 | 18 | ||||||||||
| 58.5–61.0 | 19 | ||||||||||
| 61.1–63.0 | 22 | ||||||||||
| 63.1–64.1 | 25 | ||||||||||
| 64.2–65.1 | 28 | ||||||||||
| > 65.1 | 32 |
Adapted from reference 17: Shalaurova I, Connelly MA, Garvey WT, Otvos JD. Lipoprotein insulin resistance index: a lipoprotein particle-derived measure of insulin resistance. Metab Syndr Relat Disord. 2014:12:422–429.
LPIR interassay repeatability from 80 replicate analyses of 8 plasma pools over 20 days had a coefficient of variation (CV) of 6% within-run and 9% between-run (17).
Incident Type 2 Diabetes Ascertainment
Cases of incident T2D were initially identified by self-report on annual questionnaires that asked if and when the participant had been diagnosed with T2D since baseline or the previous questionnaire (20, 21). Self-reported cases were then confirmed by physician-administered telephone interviews (22) or a self-administered supplemental questionnaire, using the American Diabetes Association diagnostic criteria as previously described (21). In a validation study, both interview-based and supplemental questionnaire-based confirmation yielded positive predictive values >90% in comparison to medical record review(22). In particular, the positive predictive value of the supplemental questionnaire compared with medical record review was 99% (95% CI 97–100%). Overall, in 95% of all self-reported T2D events, sufficient information for confirmation or disconfirmation of the endpoint was obtained, and only confirmed cases were used in this analysis. The American Diabetes Association diagnostic criteria(23) required at least one of the following: (1) presence of more than 1 classic symptom of hyperglycemia (ie, polyuria, polydipsia, weight loss, with or without polyphagia, and blurred vision) plus either a fasting plasma glucose of 126 mg/dL (7.0 mmol/L) or higher or random plasma glucose 200 mg/dL (11.1 mmmol/L) or higher; (2) in the absence of symptoms, 2 or more elevated plasma glucose concentrations (fasting plasma glucose of ≥ 126md/dL [7.0 mmol/L], random plasma glucose ≥ 200 mg/dL [11.1 mmol/L], or 2-hour plasma glucose ≥ 200 mg/dL [11.1 mmom/L] during oral glucose tolerance testing); or (3) use if insulin or an oral hypoglycemic agent.
Statistical Analysis
LPIR values were described by percentages, and medians/interquartiles. Trend across quartiles were tested by Cochran-Mantel-Haenszel for categorical variables or Jonckheere-Terpstra for continuous. The Spearman correlation of LPIR with other T2D predictors was tested.
Cumulative incidence curves and the logrank test were computed for LPIR and HbA1c quartiles. Cox proportional hazards models were used to estimate hazard ratios (HRs) for incident T2D across LPIR quartiles and per standard deviation (1). Trend across LPIR quartiles was assessed using median levels. Model adjustment was incremental: Model 1: age, race, body mass index, current smoking, physical activity, education, menopause, hormone replacement therapy, systolic blood pressure, antihypertensive treatment, and family history of T2D; Model 2: Model 1 plus HbA1c; Model 3: Model 2 plus log hs-CRP; and Model 4: Model 3 plus HDL, LDL cholesterol, and log triglycerides. Testing for interaction with log time found a lack of proportionality across the full follow up, but hazards were proportional on separate analysis for the first and last ten years. As estimators for these two time intervals and the full follow up were similar, we considered full follow up most informative. Cumulative incidence of T2D by LPIR quartiles was plotted for the first and last ten years.
Other T2D clinical predictor’s SD HRs (95% CIs) obtained from model 4 were plotted. We also tested the HR for LPIR and T2D by clinically defined strata: age (< or ≥ 55 years); BMI (<25 or ≥ 25 kg/m2); family history of T2D; HbA1c (< or ≥ 5.7 %); HDL-c (< or ≥ 50 mg/dL); triglycerides (< or ≥150 mg/dL) and hs-CRP (< or ≥2 mg/L); and metabolically healthy profile (all of the following BMI <25 kg/m2, HDL ≥ 50 mg/dL, triglycerides <150 mg/dL, HbA1< 5.7%, hs-CRP <2 mg/L, blood pressure <140/90 mmHg, no anti-hypertensive treatment and no family history of T2D), or not metabolically healthy (at least one of those characteristics absent). Effect modification was tested by an interaction term between LPIR and each stratum for T2D association. We also assessed T2D risk by LPIR and HbA1c composite groups (HbA1c <5.7 or 5.7–6.4% and LPIR< or ≥48, the median LPIR value) by cumulative incidence curves, logrank test and Cox models.
Discrimination and reclassification of LPIR over the Framingham Offspring (FOS) T2D score (9) was examined at 10 and 16 years. We chose 16 years, instead of 20 years, as many participants were censored or had an event at 20 years, which affects model precision. The FOS score is calculated by integrating the weighted values of age, family history of T2D, body mass index, systolic blood pressure, anti-hypertensive medication, HDL cholesterol, triglycerides, and fasting plasma glucose; which results in an expected T2D percentage incidence in a determined time window (8 years in the original paper). As fasting plasma glucose was unavailable, we used HbA1c instead. The original score predictors were fitted to our population for balanced comparison. Discrimination performance was tested by Harrell’s c-index(24) and the difference of LPIR over FOS was tested by ten-fold cross-validation and the 95% CI by 1000 bootstrap replications, which avoid overoptimism. Calibration was tested by the Greenwood-Nam-D’Agostino for survival method(25) by predicted probabilities deciles and displayed in calibration plots. Discrimination and reclassification of LPIR over FOS was tested by the integrated discrimination improvement (IDI-absolute and relative) and categorical net reclassification index (NRI)(26). For NRI, we considered the original FOS study limits for low, intermediate and high T2D risk (9). Assuming linear events accumulation, the original 3% and 10% limits at 8 years, correspond to 3.75% and 12.5% at 10 years; and 6% and 20% at 16 years.
Results
Baseline Population Characteristics
Overall, our study population was generally healthy: age, median 52.7 years (25th to 75th percentile: 48.9–58.6); BMI, median 24.8 kg/m2 (25th to 75th percentile: 22.3–28.2); and median HbA1c 5.0% (25th to 75th percentile: 4.8–5.2%). Nearly one quarter had metabolic syndrome or T2D family history. The median LPIR was 48 (25th to 75th percentile: 29–67). There were 2,259 T2D cases over 463,717 person years (0.49 cases per 100 person years) along 20.4 years median follow up (maximum 21.6 years). For increasing LPIR quartiles, characteristics tracked with T2D risk factors (Table 2): older age, higher BMI, and more prevalent physical inactivity and T2D family history. Likewise, metabolic syndrome characteristics followed increasing LPIR quartiles: blood pressure, HDL-c, triglycerides, HbA1c, and hs-CRP.
Table 2.
Baseline Characteristics according to LPIR Quartiles
| Characteristics | LPIR Quartile (score range) | |||
|---|---|---|---|---|
| Q1 (< 30) | Q2 (30–47) | Q3 (48–67) | Q4 (> 67) | |
| Age (years) | 51.9 (48.5–57.3) | 52.6 (48.8–58.4) | 53.2 (49.1–59.2) | 53.4 (49.2–59.4) |
| Caucasian, % | 95.1 | 95.8 | 95.3 | 95.9 |
| BMI (kg/m2) | 22.8 (21.2–24.9) | 23.9 (21.9–26.6) | 25.6 (23.0–28.8) | 27.8 (24.8–31.5) |
| Current Smoking, % | 9.0 | 11.4 | 12.8 | 13.4 |
| Physical Activity (≥1 / week), % | 50.5 | 45.8 | 40.8 | 36.7 |
| Alcohol (1 ≥ drink / day), % | 12.1 | 12.2 | 10.3 | 7.4 |
| Education (≥ BS), % | 51.9 | 45.6 | 42.7 | 38.1 |
| Family History T2D, % | 21.0 | 22.0 | 26.0 | 29.3 |
| Metabolic Syndrome, % | 1.1 | 6.8 | 26.4 | 65.8 |
| Systolic Blood Pressure (mmHg) | 115 (115–125) | 115 (115–125) | 125 (115–135) | 125 (115–135) |
| Hypertension Treatment, % | 6.1 | 8.7 | 13.3 | 19.4 |
| Postmenopausal, % | 48.7 | 52.8 | 55.9 | 56.5 |
| Hormone Therapy, % | 40.5 | 44.9 | 44.4 | 41.7 |
| Laboratory Measurements | ||||
| Total Cholesterol (mg/dL) | 202 (179–228) | 203 (179–228) | 209 (185–235) | 217 (192–245) |
| HDL-c (mg/dL) | 65.1 (56.9–74.7) | 55.8 (48.5–64.3) | 48.6 (42.4–55.9) | 41.8 (36.4–48.2) |
| LDL-c (mg/dL) | 113 (94–134) | 118 (98–140) | 125 (104–148) | 129 (108–152) |
| Triglycerides (mg/dL) | 74 (58–93) | 98 (78–127) | 133 (106–170) | 199 (158–261) |
| Apolipoprotein B (mg/dL) | 86.3 (73.7–102.8) | 93.8 (79.9–111.4) | 106.4 (88.9–123.6) | 118.3 (99.3–136.3) |
| Apolipoprotein A1 (mg/dL) | 161 (146–179) | 153 (137–172) | 145 (130–164) | 137 (124–154) |
| hs-CRP (mg/L) | 1.0 (0.4–2.3) | 1.5 (0.7–3.4) | 2.4 (1.1–4.7) | 3.3 (1.7–6.1) |
| HbA1C (%) | 4.9 (4.8–5.1) | 5.0 (4.8–5.1) | 5.0 (4.8–5.2) | 5.1 (4.9–5.3) |
Continuous variables displayed by median (25th–75th percentiles) and categorical ones by number of observations (percentage). Increasing quartiles trend test by Cochran-Mantel-Haenszel for categorical variables and Jonckheere Terpstra for continuous ones. All p values <0.001, except for hormone therapy (p value=0.240).
hs-CRP (high sensitivity C reactive protein).
LPIR Correlations
Comparison with other T2D clinical predictors, LPIR was weakly correlated with HbA1c (ρ 0.18, p < 0.001)(Supplementary Table I). As expected, LPIR strongly correlated with HDL-c and triglycerides (respectively, ρ −0.66 and 0.75 p < 0.001), and its individual lipoprotein components.
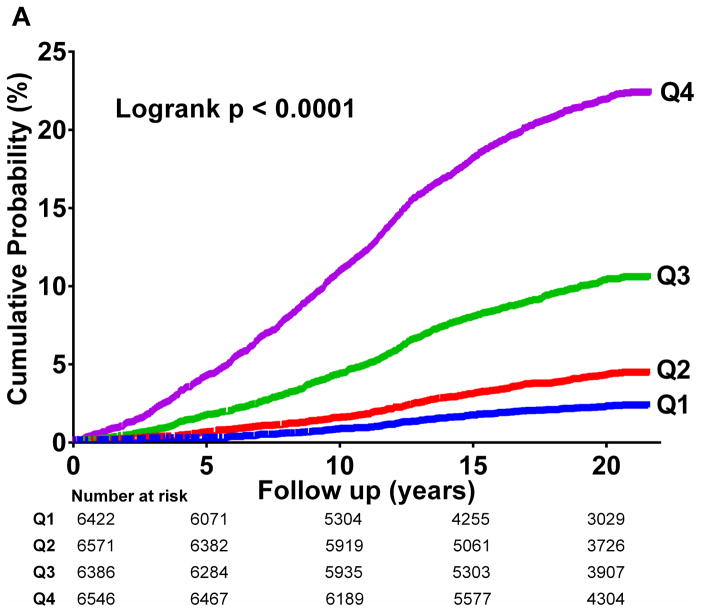
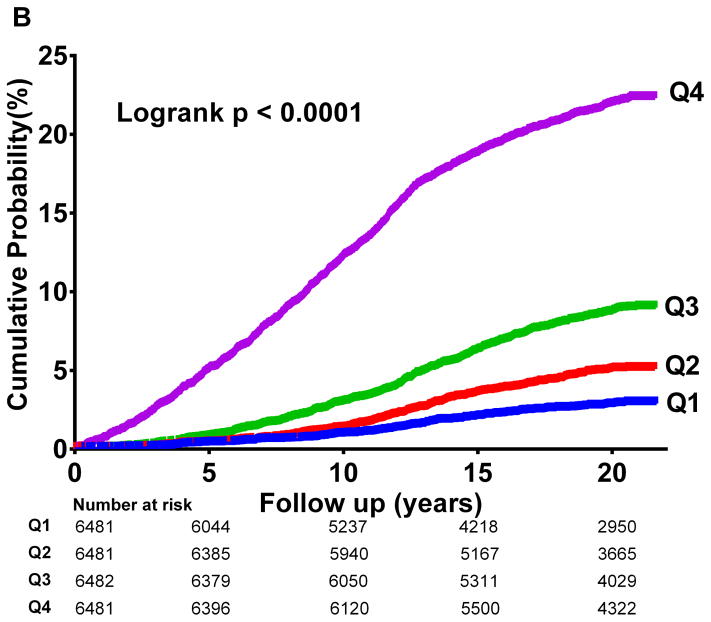
In unadjusted analysis, increasing LPIR quartiles corresponded to higher T2D incidence (logrank p<0.001) (Figure 2A), strikingly similar to HbA1c quartiles curves (logrank p<0.001) (Figure 2B).
Figure 2.
Diabetes Cumulative Incidence
2 A: LPIR Quartiles
LPIR score across quartiles Q1 (<30), Q2 (30–47), Q3 (48–67), and Q4 (>67).
2 B: HbA1c Quartiles
HbA1c values (%) across quartiles Q1 (<4.83), Q2 (4.83–4.99), Q3 (4.99–5.17), and Q4 (>5.17).
LPIR and Incident Type 2 Diabetes
The LPIR risks for the first and last 10 years of follow up were similar to the full follow up (Supplementary Table II and Supplementary Figure I).
In adjusted analysis, increasing LPIR quartiles were associated with T2D risk in a linear fashion (Table 3). First, adjusted for age, race, smoking, physical activity, education, menopause status, hormone replacement therapy, blood pressure, antihypertensive treatment, BMI and family history of T2D; HRs (95% CIs) for LPIR Q2 to Q4 versus Q1 were respectively: 1.67 (1.34, 2.07); 3.23 (2.66, 3.92); and 5.68 (4.70, 6.87). After incremental adjustment for HbA1c (Model 2), and also hs-CRP (Model 3), the estimators were mildly attenuated (model 3 Q4 vs Q1 HR: 4.53 (95% CI: (3.74, 5.49)). Further adjusting for lipids (model 4), the HR of Q4 vs Q1 was attenuated to 2.21 (95% CI: (1.75, 2.80)). Alternatively, in model 4 for each LPIR SD increment (23.4 units), T2D risk was 41% higher (95% CI: (31%, 53%)). Additional adjustment for alcohol consumption and fasting state at blood draw did not change the results (data not shown).
Table 3.
LPIR and Incident Diabetes-Full Follow Up
| Q1 | Q2 | Q3 | Q4 | p value for linear trend | per Standard Deviation | p value | |
|---|---|---|---|---|---|---|---|
| Events / N (%) | 131 / 6546 (2.00%) | 247 / 6386 (3.87%) | 611 / 6571 (9.30%) | 1270 / 6422 (19.78%) | |||
| T2D/100 person-years (95%CI) | 0.11 (0.09–0.13) | 0.21 (0.19–0.24) | 0.52 (0.49–0.57) | 1.21 (1.15–1.27) | |||
| M1 HR (95% CI) | 1.00 (ref.) | 1.67 (1.34, 2.07) | 3.23 (2.66, 3.92) | 5.68 (4.70, 6.87) | <.0001 | 1.95 (1.85, 2.06) | <.0001 |
| M2 HR (95% CI) | 1.00 (ref.) | 1.72 (1.38, 2.13) | 3.15 (2.59, 3.83) | 5.03 (4.16, 6.09) | <.0001 | 1.81 (1.72, 1.91) | <.0001 |
| M3 HR (95% CI) | 1.00 (ref.) | 1.64 (1.32, 2.04) | 2.89 (2.37, 3.51) | 4.53 (3.74, 5.49) | <.0001 | 1.75 (1.67, 1.85) | <.0001 |
| M4 HR (95% CI) | 1.00 (ref.) | 1.26 (1.01, 1.57) | 1.75 (1.41, 2.17) | 2.21 (1.75, 2.80) | <.0001 | 1.41 (1.31, 1.53) | <.0001 |
Adjusted hazard ratios for LPIR quartiles and LPIR per standard deviation increment (23.4 score units). P values for trend according to quartiles median values.
Model 1 (M1): age, race, smoking status, physical activity, education, menopause status, hormone replacement therapy, systolic blood pressure, anti-hypertensive treatment, body mass index, family history of T2D.
Model 2 (M2): M1 plus HbA1c.
Model 3(M3): M2 plus hs C-reactive protein logarithm.
Model 4(M4): M 3 plus lipid parameters not contemplated by LPIR (HDL-c, LDL-c and triglycerides logarithm).
Comparative Strengths for Incident Type 2 Diabetes
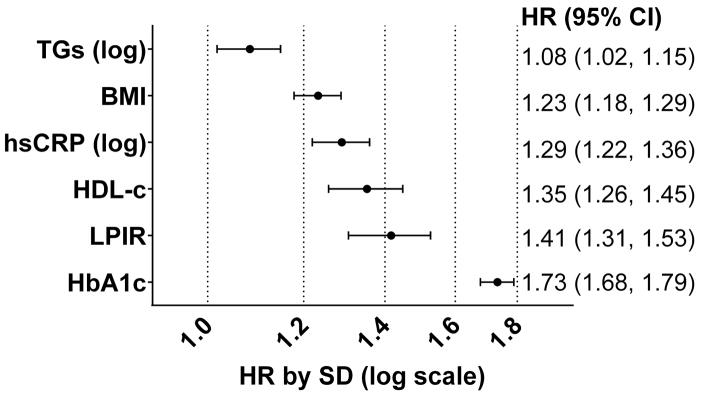
Comparing the LPIR T2D risk with other traditional predictors in a mutually adjusted model (model 4), LPIR outranked triglycerides, BMI, hs-CRP, and had at least similar magnitude to lower HDL cholesterol, 1.35 per SD (95% CI: (1.26, 1.45)). LPIR SD HR was only lower than HbA1c, 1.73 (95% CI: (1.68, 1.79))(Figure 3).
Figure 3.
Standardized Hazard Ratios for Predictors of Diabetes.
Mutually adjusted covariates plus those from model number 4 in main analysis.
Subgroups Analysis
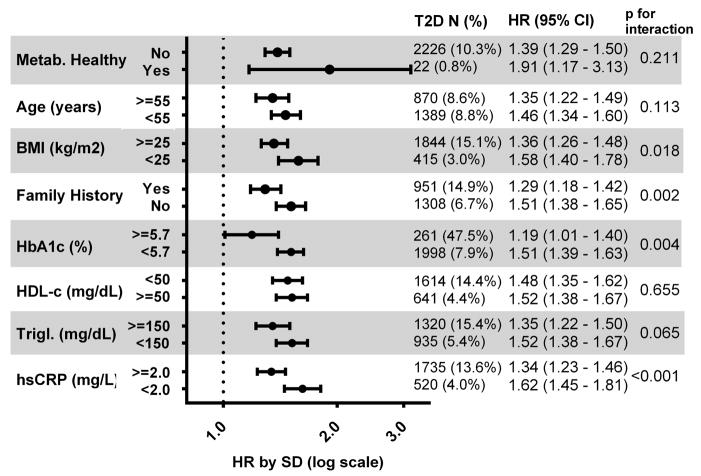
In stratified analysis, LPIR was associated with risk of T2D incidence in all subgroups (Figure 4). The HRs ranged from 1.19 (95% CI: 1.01, 1.40) for HbA1c ≥ 5.7% to 1.91 (95% CI: (1.17, 3.13)) in metabolically healthy stratum. Overall, LPIR relative risks were higher in individuals at lower T2D risk by clinical factors. There was significant effect modification for BMI, family history, HbA1c and hs-CRP strata.
Figure 4.
LPIR Standardized Hazard Ratios within Each Stratum.
Model adjsutment for age, race, smoking status, physical activity, education, menopause status, hormone replacement therapy, systolic blood pressure, anti–hypertensive treatment, body mass index, family history of diabetes, HbA1c, log hs-CRP, HDL-c, LDL-c and log triglycerides (Trigl.).
Metabolically healthy defined as those with BMI <25 kg/m2 and HDL ≥ 50 mg/dL and triglycerides <150 mg/dL and HbA1< 5.7% and hs-CRP <2 mg/L and blood pressure <140/90 mmHg and no anti-hypertensive treatment and no family history of T2D; or not if otherwise.
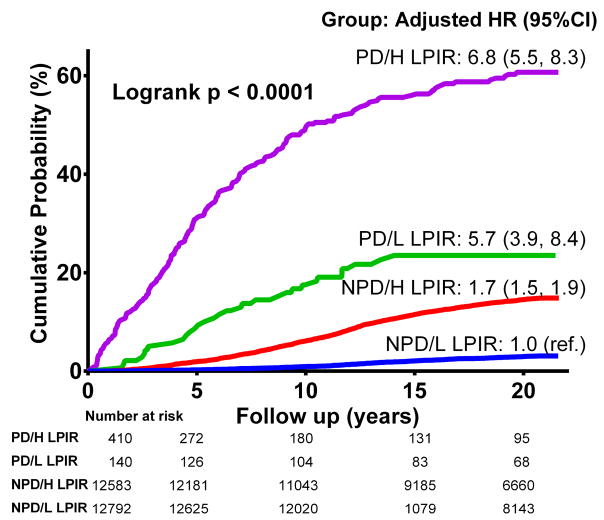
For groups defined by prediabetic state presence (HbA1c <5.7% or 5.7–6.5%) and LPIR (< or ≥ 48, study median), there was incremental adjusted risk from no prediabetes and low LPIR group (reference), to no prediabetes and high LPIR, to prediabetes and low LPIR, to prediabetes and high LPIR (HR 6.8, 95%CI: 5.5, 8.3 vs the reference)(Figure 5).
Figure 5.
Groups according to prediabetes (PD) status (HbA1c < or ≥5.7%) and LPIR < or ≥48.
PD/H LPIR (prediabetes and LPIR≥48), PD/L LPIR (prediabetes and LPIR<48); NPD/H LPIR (no prediabetes and LPIR≥48), and NPD/L LPIR (no prediabetes and LPIR<48).
Ajusted analysis covariates: age, race, smoking status, physical activity, education, menopause status, hormone replacement therapy, systolic blood pressure, anti-hypertensive treatment, body mass index, family history of diabete, HbA1c, hs-CRP, HDL-c, LDL-c and triglycerides. P for trend <0.001 across quartiles in unadjusted and adjusted analysis.
Unadjusted HR (95%CI) for PD/LPIR groups versus the NPD/L LPIR (reference): NPD/H LPIR 5.4 (4.7, 5.9); PD/L LPIR 10.1 (7.0, 14.6); and PD/H LPIR 40.7 (34.4, 48.1).
Model Performance with LPIR Compared with a Clinical Type 2 Diabetes Risk Score
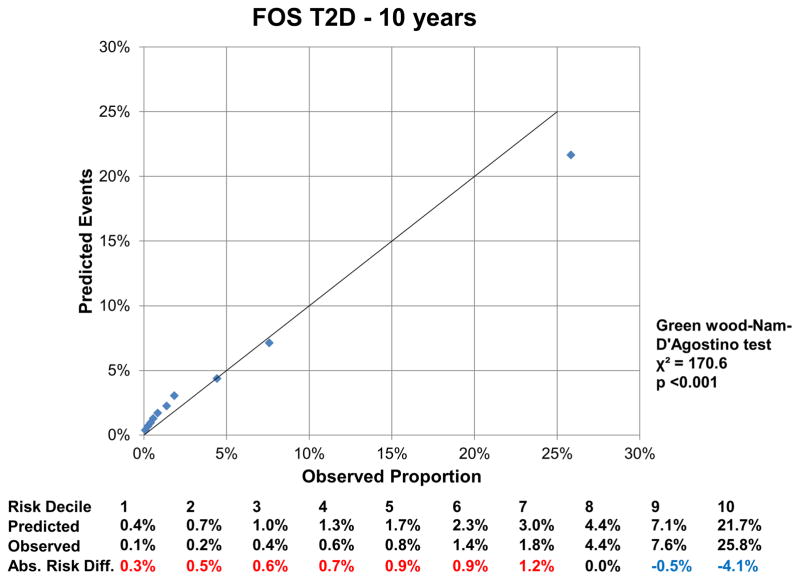
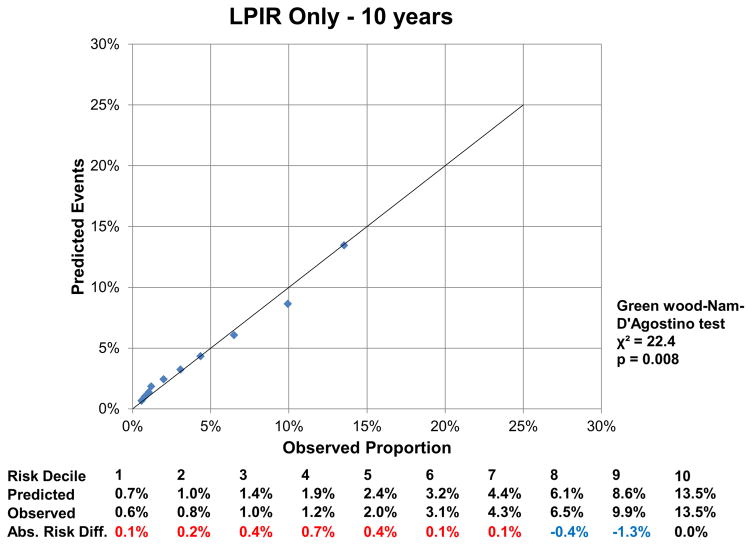
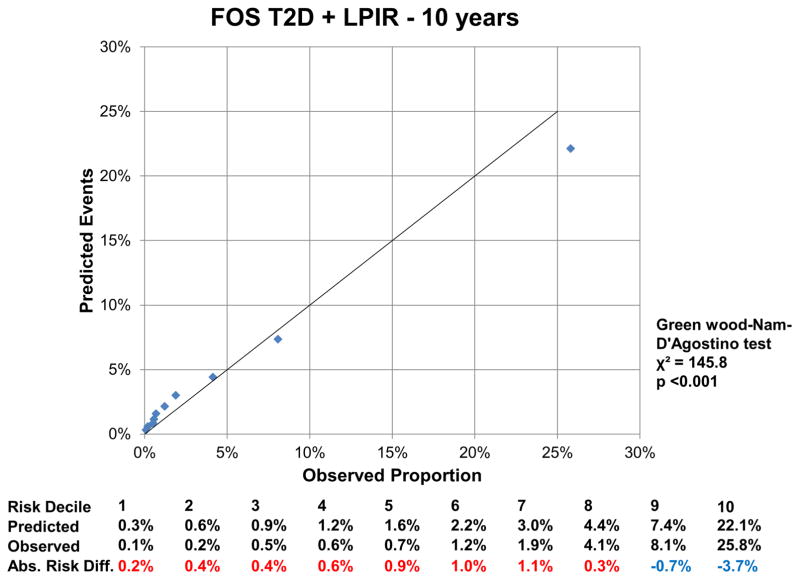
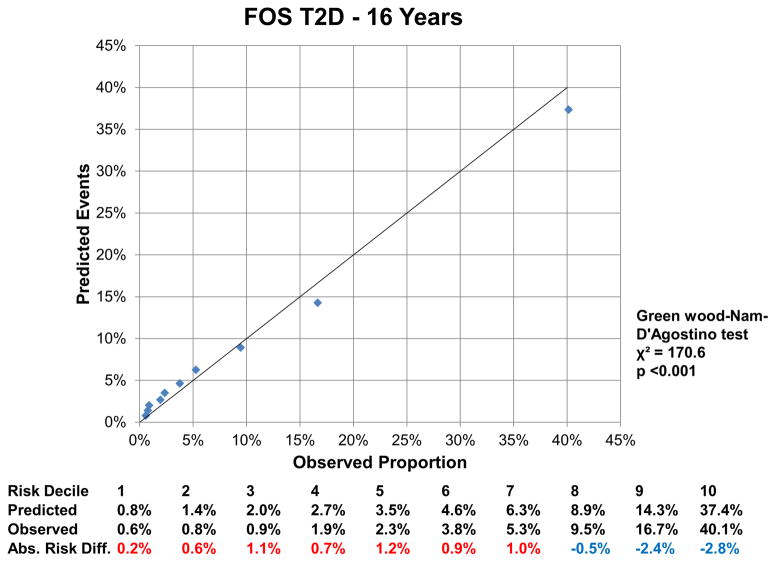
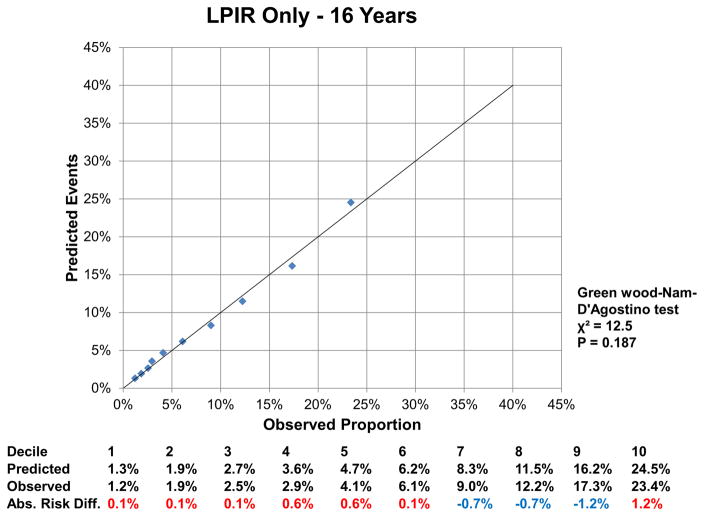
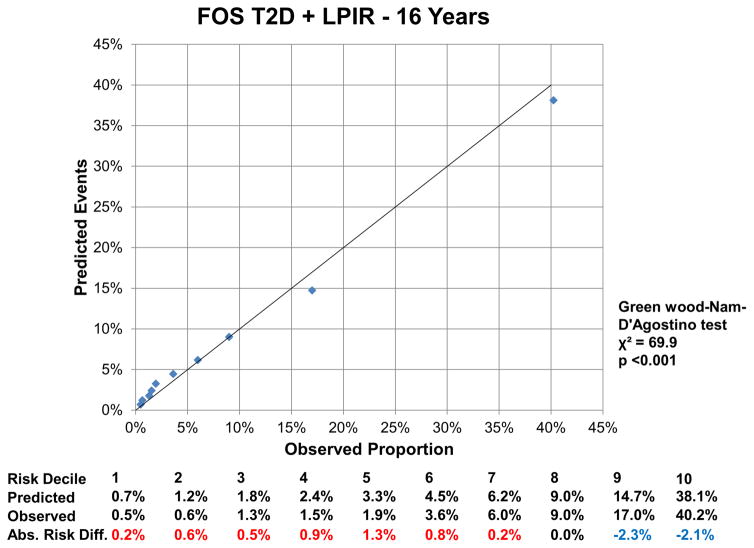
At 16 years, the c-index for the FOS model was 0.850 (95% CI: 0.843, 0.857), and improved by 0.002 (95%CI: 0.001, 0.004) with LPIR (Supplementary Table III). At 16 years, LPIR improved overall model performance (goodness of fit likelihood ratio χ2 87.49), model discrimination (integrated discrimination improvement 0.009 (95% CI: 0.006, 0.011); relative integrated discrimination improvement 0.043 (95% CI: 0.031, 0.056)) and reclassification (NRI 0.028 (95%CI: 0.015, 0.043). Regarding FOS, LPIR only and FOS+LPIR models calibration, they generally overestimated T2D risk in the low and moderate range but underestimated in the higher risk range (Figure 6A–F). Interestingly, just the LPIR only model at 16 years was statistically calibrated (Greenwood-Nam-D’Agostino test p value 0.187 - Figure 6E). In participants deemed at intermediate T2D risk by the FOS model, LPIR led to a correct reclassification in 5.7% for events, 7.6% for non-events and net reclassification of 0.145 (0.117, 0.175) (Table 4). Overall similar results were obtained at 10 years.
Figure 6.
6 A: Calibration Plot Framingham Offspring T2D at 10 Years
6 B: Calibration LPIR Only at 10 Years
6 C: Calibration Plot Framingham Offspring T2D + LPIR at 10 Years
6 D: Calibration Plot Framingham Offspring T2D at 16 Years
6 E: Calibration LPIR Only at 16 Years
6 F: Calibration Plot Framingham Offspring T2D + LPIR at 16 Years
Variables in the Framingham Offspring model, age, family history of T2D, body mass index, systolic blood pressure, anti-hypertensive medication, HDL, triglycerides and HbA1c. For calibration analysis Greenwood-Nam-D’Agostino test was applied, where a P value <0.05 indicate a non calibrated model. Tables below graphs displaying the predicted risk by corresponding model, the observed risk and the absolute difference of the former minus the last. Red colour indicates overestimation and blue one underestimation of the prediction model.
Table 4.
Net Reclassification Improvement for Incident Type 2 Diabetes with Addition of LPIR to Framingham Ofsspring T2D in Intermediate Risk Women
| Total Reclassified % | Low | Intermediate | High | Correctly Reclassified % | NRI | ||
|---|---|---|---|---|---|---|---|
| 10 Years | Events | 13.2% | 47 | 783 | 72 | 2.8% | 0.126 (0.087, 0.168) |
| Non-events | 15.8% | 568 | 3875 | 158 | 8.9% | ||
| 16 Years | Events | 12.4% | 29 | 759 | 78 | 5.7% | 0.145 (0.117, 0.175) |
| Non-events | 15.6% | 691 | 5023 | 237 | 7.6% |
NRI: Net reclassification improvement. Variables in the Framingham Offspring model, age, family history of T2D, body mass index, systolic blood pressure, anti-hypertensive medication, HDL, triglycerides and HbA1c. NRI risk limits for low, internediate and high categories were: 3.75% and 12.5% for 10 years; and 6% and 20% for 16 years. NRI estimator and 95% CI was calculated by 1000 bootstrap replications, which explains the the small divergence versus the sum of % net reclassification of events and non-events.
Discussion
LPIR, a novel metabolomic biomarker of lipoprotein insulin resistance, is associated with incident T2D in a population of otherwise healthy women followed prospectively for more than 20 years. This association persisted after adjustment for a wide range of potential confounders and was observed even in those at very low risk for T2D based on the standard clinical profile. Furthermore, LPIR improved T2D risk assessment beyond traditional markers during a very long follow up. Thus, the LPIR metabolic signature detects T2D risk earlier and largely independent from traditional markers, including HbA1c.
In our study, LPIR correlated with demographic and laboratory markers of T2D risk, but contributed to T2D risk largely independently of all these markers. Moreover, this association persisted even in subgroups at low short-term risk for T2D. Thus, LPIR captures information on very early insulin resistant dyslipoproteinemia (27, 28) signaling T2D risk. Detecting T2D susceptibility above and beyond current prediction models opens up a novel and earlier dimension to T2D prevention. On the other hand, among participants with more advanced dysglycemia (i.e. baseline HbA1c 5.7–6.5%), the smaller magnitude (on a relative scale compared with participants with HbA1c <5.7%) of LPIR-related risk also translated into clinically relevant incremental absolute risk differences as these participants had high incidence rates (Figure 5). It is yet to be determined whether LPIR is directly involved in T2D pathophysiology or is just a marker of underlying mechanisms.
Our results reproduce and expand Mackey et al findings (12) in the Multi-Ethnic Study of Atherosclerosis (MESA) population. In that population of 5,314 men and women aged 45 to 84 years followed for 7.7 years, LPIR HR for T2D was 1.59 for Q4 versus Q1 in a model adjusted for fasting glucose, triglycerides to HDL-c ratio and other traditional markers. In our female population, there was higher risk for Q4 versus Q1, fully adjusted HR 2.21 (95%CI: (1.75, 2.80), which may be partly explained by a different population profile, model adjustment, or follow-up time. Similar to our study, in the MESA population LPIR was associated with T2D risk even in those with low T2D risk. Moreover, in MESA, LPIR was associated with T2D largely independent of glucose, insulin, and Homeostasis Model Assessment – Insulin Resistance, which reinforces the LPIR unique risk information. Hence, LPIR detects T2D susceptibility years before clinically detectable glycemic abnormalities. Besides that, LPIR was also associated with short term incident T2D, even among those under statin therapy initiation in the higher T2D risk JUPITER trial population (18). The overall effects of insulin resistance on lipoprotein metabolism are well established(29, 30), especially for low HDL-c and high triglycerides. Individual measures of LPIR, such as larger VLDL, smaller LDL, smaller HDL particle sizes and higher concentrations of large VLDL and small LDL, and lower concentrations of large HDL, were individually associated with incident T2D in the Women’s Health Study(13) and other studies(12, 14–16). In the normal liver insulin inhibits VLDL secretion(27, 28), but not as efficiently when hepatic insulin resistance sets in. Then, large VLDL particles, rich in triglycerides, accumulate and suffer sequential lipolysis that leads to increasing concentrations of cholesterol-poor small LDL particles. HDL particles acquire triglycerides from VLDL in exchange for cholesterol under the action of cholesteryl ester transfer protein, which leads to lower concentrations of large HDL particles. Therefore, insulin resistant dyslipoproteinemia results in higher concentrations of large VLDL and small LDL particles, and lower concentrations of large HDL particles, with corresponding effects on particle average size. Therefore, LPIR may better reflect the aggregate biology of lipoprotein insulin resistance rather than individual particles. Our data support the superiority of this approach, where the LPIR SD HR, 1.41 (95%CI: 1.31, 1.53), outranked HDL-c, triglycerides and each individual LPIR sub–particle. Reassuringly, LPIR remained associated with T2D even after HDL-c and triglycerides adjustment, and also in the subgroups of high HDL-c or low triglycerides. Thus, the LPIR signature reflects the complex biology of insulin resistance on lipoproteins metabolism.
Glucose metabolism parameters are the benchmark for risk assessment and T2D diagnosis. Despite HbA1c adjustment, LPIR was strongly associated with T2D risk and represents an independent component of insulin resistance and T2D risk. As supporting data for that, within the optimal HbA1c (<5.7%) subgroup, for each SD LPIR increment there was 51% higher risk for T2D (p for interaction 0.004). Pathophysiologically, very early insulin resistance enhances VLDL-triglyceride secretion in the liver when its glucose metabolism is normally responsive to insulin.(5) Hence, LPIR unveils an early underappreciated dimension of insulin resistance undetected by standard glucose metabolism parameters. By contrast, in the very high T2D risk group (i.e., participants with HbA1c 5.7–6.5%), the smaller magnitude (on a relative scale) of LPIR-related risk translated into a high absolute risk difference as these participants were at particularly high absolute risk for incident T2D (Figure 5) such that even smaller relative risk translates into clinically relevant incremental absolute risk.
Regarding T2D risk assessment, LPIR enhanced the performance of a validated prediction score (FOS T2D)(9). Importantly, the FOS score variables were refitted to Women’s Health Study, which ensured high discriminative performance for FOS c-index, 0.878 for 10 years and 0.850 for 16 years. Hence, LPIR increment over FOS c-index, despite being small, is remarkable given the excellent FOS model performance. Also, the LPIR integrated discrimination improvement for 10 years (0.006) is equal to the best performance integrated discrimination improvement among 35 novel T2D risk factors, including a genetic risk score in the Atherosclerosis Risk in Communities Study (31). Moreover, LPIR improved NRI at 16 years in the whole sample of our study, while none of the 35 novel risk factors in the ARIC study did (31). Given that, LPIR seems promising for improving T2D risk prediction, especially in the intermediate risk group in which reclassification performance at 10 and 16 years was higher and clinically relevant. Despite the adequate calibration for LPIR only model at 16 years, by contrast to other models, FOS should remain as the standard practice for T2D risk prediction. The LPIR reclassification performance over FOS should be further tested in diverse populations.
Our results may not extrapolate to men and non-Caucasian individuals, although they were consistent with MESA that included men and minorities. Despite no fasting plasma glucose in our analysis, HbA1c is a valid substitute. Undetected diabetes bias is highly unlikely as individuals with HbA1c ≥ 6.5% were excluded. Strengths include the large well–characterized population observed for a long follow up period and reliable T2D ascertainment. Finally, the large number of T2D cases powered our study even for subgroup analyses.
Conclusions
In summary, LPIR is a novel metabolomic composite marker reflecting insulin resistance dyslipoproteinemia, which was robustly associated with T2D risk in otherwise healthy middle aged women during extended follow up. Importantly, this finding extended even to those with very low risk of disease due to an optimal clinical profile.
Supplementary Material
Highlights.
LPIR captures incipient effects of insulin resistance on lipoprotein metabolism.
LPIR was robustly associated with incident T2D along 20 years of follow-up.
The association persisted even in low T2D risk subgroups, as BMI< 25 kg/m2 and HbA1c < 5.7%.
In the intermediate risk Framingham T2D score, LPIR improved risk classification in a clinically relevant magnitude.
LPIR may enhance T2D prevention in at risk populations otherwise unaware.
Acknowledgments
Paulo H.N. Harada researched literature, designed the study, made figures, analyzed and interpreted data, and wrote the manuscript. Olga V. Demler designed the study and analyzed data. Sagar B Dugani interpreted data and wrote the manuscript. Akintunde O. Akinkuolie interpreted data and wrote the manuscript. M.V. Moorthy: designed the study, analyzed data. Paul M Ridker interpreted data and wrote the manuscript. Nancy R. Cook designed the study and analyzed data. Aruna D. Pradhan interpreted data and wrote the manuscript. Samia Mora researched literature, designed the study, made figures, analyzed and interpreted data, and wrote the manuscript.
Sources of Funding
P.H.N.Harada was funded by the Lemann Foundation. A.O. Akinkoulie receives support from NIH T32 (HL007575). The Women’s Health Study was funded by grants CA047988, HL043851, HL080467, HL099355, and UM1 CA182913. Additional funding was received from a charitable gift from the Molino Family Trust. Dr. Mora received funding from the National Heart, Lung, and Blood Institute of the National Institute of Health (HL 117861).
Abbreviations List
- FOS
Framingham Offspring Study
- HbA1c
Glycated Hemoglobin
- HR
Hazard Ratio
- hs-CRP
High Sensitivity C reactive Protein
- LPIR
Lipoprotein Insulin Resistance Score
- T2D
Type 2 Diabetes
Footnotes
Women’s Health Study URL http://clinicaltrials.gov/ct/show/NCT00000479. unique identifier NCT00000479
Disclosures
P.H.N.Harada has nothing to disclose; O.V. Demler has nothing to disclose; S.B. Dugani has nothing to disclose; A.O. Akinkoulie has nothing to disclose; M.V.Moorthy has nothing to disclose; P. M. Ridker received research grant support from AstraZeneca, Novartis, Amgen, Pfizer, and NHLBI R01HL117861, and is listed as a co-inventor on patents held by the Brigham and Women’s Hospital related to the use of inflammatory biomarkers in CVD (licensed to AstraZeneca and Siemens); N.R.Cook has nothing to disclose; A.D.Pradhan received research grant support from Kowa Research Institute and NIDDK R01 DK088078. S. Mora received research grant support from Atherotech Diagnostics and NHLBI (HL 117861); is consultant to Lilly, Pfizer, Amgen, Quest Diagnostics, and Cerenis Therapeutics; and is co-inventor on a patent on the use of NMR-measured GlycA for predicting risk of colorectal cancer.
Publisher's Disclaimer: This is a PDF file of an unedited manuscript that has been accepted for publication. As a service to our customers we are providing this early version of the manuscript. The manuscript will undergo copyediting, typesetting, and review of the resulting proof before it is published in its final citable form. Please note that during the production process errors may be discovered which could affect the content, and all legal disclaimers that apply to the journal pertain.
References
- 1.DALYs GBD, H Collaborators. Murray CJ, et al. Global, regional, and national disability-adjusted life years (DALYs) for 306 diseases and injuries and healthy life expectancy (HALE) for 188 countries, 1990–2013: quantifying the epidemiological transition. Lancet. 2015;386:2145–2191. doi: 10.1016/S0140-6736(15)61340-X. http://dx.doi.org/10.1016/S0140-6736(15)61340-X. [DOI] [PMC free article] [PubMed] [Google Scholar]
- 2.Song Y, Manson JE, Tinker L, et al. Insulin sensitivity and insulin secretion determined by homeostasis model assessment and risk of diabetes in a multiethnic cohort of women: the Women’s Health Initiative Observational Study. Diabetes Care. 2007;30:1747–1752. doi: 10.2337/dc07-0358. http://dx.doi.org/10.2337/dc07-0358. [DOI] [PMC free article] [PubMed] [Google Scholar]
- 3.Festa A, Williams K, D’Agostino R, Jr, Wagenknecht LE, Haffner SM. The natural course of beta-cell function in nondiabetic and diabetic individuals: the Insulin Resistance Atherosclerosis Study. Diabetes. 2006;55:1114–1120. doi: 10.2337/diabetes.55.04.06.db05-1100. http://dx.doi.org/10.2337/diabetes.55.04.06.db05-1100. [DOI] [PubMed] [Google Scholar]
- 4.Weyer C, Bogardus C, Mott DM, Pratley RE. The natural history of insulin secretory dysfunction and insulin resistance in the pathogenesis of type 2 diabetes mellitus. J Clin Invest. 1999;104:787–794. doi: 10.1172/JCI7231. http://dx.doi.org/10.1172/JCI7231. [DOI] [PMC free article] [PubMed] [Google Scholar]
- 5.Sorensen LP, Sondergaard E, Nellemann B, Christiansen JS, Gormsen LC, Nielsen S. Increased VLDL-triglyceride secretion precedes impaired control of endogenous glucose production in obese, normoglycemic men. Diabetes. 2011;60:2257–2264. doi: 10.2337/db11-0040. http://dx.doi.org/10.2337/db11-0040. [DOI] [PMC free article] [PubMed] [Google Scholar]
- 6.Hedblad B, Nilsson P, Engstrom G, Berglund G, Janzon L. Insulin resistance in non-diabetic subjects is associated with increased incidence of myocardial infarction and death. Diabet Med. 2002;19:470–475. doi: 10.1046/j.1464-5491.2002.00719.x. http://dx.doi.org/10.1046/j.1464-5491.2002.00719.x. [DOI] [PubMed] [Google Scholar]
- 7.Ausk KJ, Boyko EJ, Ioannou GN. Insulin resistance predicts mortality in nondiabetic individuals in the U.S. Diabetes Care. 2010;33:1179–1185. doi: 10.2337/dc09-2110. http://dx.doi.org/10.2337/dc09-2110. [DOI] [PMC free article] [PubMed] [Google Scholar]
- 8.Perry IJ, Wannamethee SG, Shaper AG, Alberti KG. Serum true insulin concentration and the risk of clinical non-insulin dependent diabetes during long-term follow-up. Int J Epidemiol. 1999;28:735–741. doi: 10.1093/ije/28.4.735. http://dx.doi.org/doi:10.1093/ije/28.4.735. [DOI] [PubMed] [Google Scholar]
- 9.Wilson PW, Meigs JB, Sullivan L, Fox CS, Nathan DM, D’Agostino RB., Sr Prediction of incident diabetes mellitus in middle-aged adults: the Framingham Offspring Study. Arch Intern Med. 2007;167:1068–1074. doi: 10.1001/archinte.167.10.1068. http://dx.doi.org/10.1001/archinte.167.10.1068. [DOI] [PubMed] [Google Scholar]
- 10.Wu L, Parhofer KG. Diabetic dyslipidemia. Metabolism. 2014;63:1469–1479. doi: 10.1016/j.metabol.2014.08.010. http://dx.doi.org/10.1016/j.metabol.2014.08.010. [DOI] [PubMed] [Google Scholar]
- 11.Adiels M, Olofsson SO, Taskinen MR, Boren J. Overproduction of very low-density lipoproteins is the hallmark of the dyslipidemia in the metabolic syndrome. Arterioscler Thromb Vasc Biol. 2008;28:1225–1236. doi: 10.1161/ATVBAHA.107.160192. http://dx.doi.org/10.1161/ATVBAHA.107.160192. [DOI] [PubMed] [Google Scholar]
- 12.Mackey RH, Mora S, Bertoni AG, et al. Lipoprotein particles and incident type 2 diabetes in the multi-ethnic study of atherosclerosis. Diabetes Care. 2015;38:628–636. doi: 10.2337/dc14-0645. http://dx.doi.org/10.2337/dc14-0645. [DOI] [PMC free article] [PubMed] [Google Scholar]
- 13.Mora S, Otvos JD, Rosenson RS, Pradhan A, Buring JE, Ridker PM. Lipoprotein particle size and concentration by nuclear magnetic resonance and incident type 2 diabetes in women. Diabetes. 2010;59:1153–1160. doi: 10.2337/db09-1114. http://dx.doi.org/10.2337/db09-1114. [DOI] [PMC free article] [PubMed] [Google Scholar]
- 14.Festa A, Williams K, Hanley AJ, et al. Nuclear magnetic resonance lipoprotein abnormalities in prediabetic subjects in the Insulin Resistance Atherosclerosis Study. Circulation. 2005;111:3465–3472. doi: 10.1161/CIRCULATIONAHA.104.512079. http://dx.doi.org/10.1161/CIRCULATIONAHA.104.512079. [DOI] [PubMed] [Google Scholar]
- 15.Garvey WT, Kwon S, Zheng D, et al. Effects of insulin resistance and type 2 diabetes on lipoprotein subclass particle size and concentration determined by nuclear magnetic resonance. Diabetes. 2003;52:453–462. doi: 10.2337/diabetes.52.2.453. http://dx.doi.org/10.2337/diabetes.52.2.453. [DOI] [PubMed] [Google Scholar]
- 16.Goff DC, Jr, D’Agostino RB, Jr, Haffner SM, Otvos JD. Insulin resistance and adiposity influence lipoprotein size and subclass concentrations. Results from the Insulin Resistance Atherosclerosis Study. Metabolism. 2005;54:264–270. doi: 10.1016/j.metabol.2004.09.002. http://dx.doi.org/10.1016/j.metabol.2004.09.002. [DOI] [PubMed] [Google Scholar]
- 17.Shalaurova I, Connelly MA, Garvey WT, Otvos JD. Lipoprotein insulin resistance index: a lipoprotein particle-derived measure of insulin resistance. Metab Syndr Relat Disord. 2014;12:422–429. doi: 10.1089/met.2014.0050. http://dx.doi.org/10.1089/met.2014.0050. [DOI] [PMC free article] [PubMed] [Google Scholar]
- 18.Dugani SB, Akinkuolie AO, Paynter N, Glynn RJ, Ridker PM, Mora S. Association of Lipoproteins, Insulin Resistance, and Rosuvastatin With Incident Type 2 Diabetes Mellitus : Secondary Analysis of a Randomized Clinical Trial. JAMA cardiology. 2016;1:136–145. doi: 10.1001/jamacardio.2016.0096. http://dx.doi.org/10.1001/jamacardio.2016.0096. [DOI] [PMC free article] [PubMed] [Google Scholar]
- 19.Ridker PM, Cook NR, Lee IM, et al. A randomized trial of low-dose aspirin in the primary prevention of cardiovascular disease in women. N Engl J Med. 2005;352:1293–1304. doi: 10.1056/NEJMoa050613. http://dx.doi.org/10.1056/NEJMoa050613. [DOI] [PubMed] [Google Scholar]
- 20.Pradhan AD, Cook NR, Manson JE, Ridker PM, Buring JE. A randomized trial of low-dose aspirin in the prevention of clinical type 2 diabetes in women. Diabetes Care. 2009;32:3–8. doi: 10.2337/dc08-1206. http://dx.doi.org/10.2337/dc08-1206. [DOI] [PMC free article] [PubMed] [Google Scholar]
- 21.Liu S, Lee IM, Song Y, et al. Vitamin E and risk of type 2 diabetes in the women’s health study randomized controlled trial. Diabetes. 2006;55:2856–2862. doi: 10.2337/db06-0456. http://dx.doi.org/10.2337/db06-0456. [DOI] [PubMed] [Google Scholar]
- 22.Ding EL, Song Y, Manson JE, Pradhan AD, Buring JE, Liu S. Accuracy of administrative coding for type 2 diabetes in children, adolescents, and young adults. Diabetes Care. 2007;30:e98. doi: 10.2337/dc07-0903. ; author reply e99, http://dx.doi.org/10.2337/dc07-0903. [DOI] [PubMed] [Google Scholar]
- 23.Report of the Expert Committee on the Diagnosis and Classification of Diabetes Mellitus. Diabetes Care. 1997;20:1183–1197. doi: 10.2337/diacare.20.7.1183. http://dx.doi.org/10.2337/diacare.20.7.1183. [DOI] [PubMed] [Google Scholar]
- 24.Harrell FE, Jr, Lee KL, Califf RM, Pryor DB, Rosati RA. Regression modelling strategies for improved prognostic prediction. Stat Med. 1984;3:143–152. doi: 10.1002/sim.4780030207. http://dx.doi.org/10.1002/sim.4780030207. [DOI] [PubMed] [Google Scholar]
- 25.Demler OV, Paynter NP, Cook NR. Tests of calibration and goodness-of-fit in the survival setting. Statistics in medicine. 2015;34:1659–1680. doi: 10.1002/sim.6428. http://dx.doi.org/10.1002/sim.6428. [DOI] [PMC free article] [PubMed] [Google Scholar]
- 26.Pencina MJ, D’Agostino RB, Sr, D’Agostino RB, Jr, Vasan RS. Evaluating the added predictive ability of a new marker: from area under the ROC curve to reclassification and beyond. Stat Med. 2008;27:157–172. doi: 10.1002/sim.2929. ; discussion 207-112, http://dx.doi.org/10.1002/sim.2929. [DOI] [PubMed] [Google Scholar]
- 27.Lewis GF, Uffelman KD, Szeto LW, Steiner G. Effects of acute hyperinsulinemia on VLDL triglyceride and VLDL apoB production in normal weight and obese individuals. Diabetes. 1993;42:833–842. doi: 10.2337/diab.42.6.833. http://dx.doi.org/10.2337/diab.42.6.833. [DOI] [PubMed] [Google Scholar]
- 28.Malmstrom R, Packard CJ, Caslake M, et al. Effects of insulin and acipimox on VLDL1 and VLDL2 apolipoprotein B production in normal subjects. Diabetes. 1998;47:779–787. doi: 10.2337/diabetes.47.5.779. http://dx.doi.org/10.2337/diabetes.47.5.779. [DOI] [PubMed] [Google Scholar]
- 29.Garg A, Helderman JH, Koffler M, Ayuso R, Rosenstock J, Raskin P. Relationship between lipoprotein levels and in vivo insulin action in normal young white men. Metabolism. 1988;37:982–987. doi: 10.1016/0026-0495(88)90157-6. http://dx.doi.org/10.1016/0026-0495(88)90157-6. [DOI] [PubMed] [Google Scholar]
- 30.Laakso M, Sarlund H, Mykkanen L. Insulin resistance is associated with lipid and lipoprotein abnormalities in subjects with varying degrees of glucose tolerance. Arteriosclerosis. 1990;10:223–231. doi: 10.1161/01.atv.10.2.223. http://dx.doi.org/10.1161/01.ATV.10.2.223. [DOI] [PubMed] [Google Scholar]
- 31.Raynor LA, Pankow JS, Duncan BB, et al. Novel risk factors and the prediction of type 2 diabetes in the Atherosclerosis Risk in Communities (ARIC) study. Diabetes Care. 2013;36:70–76. doi: 10.2337/dc12-0609. http://dx.doi.org/10.2337/dc12-0609. [DOI] [PMC free article] [PubMed] [Google Scholar]
Associated Data
This section collects any data citations, data availability statements, or supplementary materials included in this article.


