Abstract
Chemical investigations of a soil-derived Streptomyces sp. led to the isolation of five new polyketides, (+)-oxanthromicin, (±)-hemi-oxanthromicins A/B, (±)-spiro-oxanthromicin A and oxanthroquinone, and the known alkaloid staurosporine, and the detection of four new metastable analogues, (±)-spiro-oxanthromicins B1/B2/C1/C2. Among the compounds tested, SAR investigations established that the synthetic oxanthroquinone ethyl ester and 3-O-methyl-oxanthroquinone ethyl ester were optimal at mislocalising oncogenic mutant K-Ras from the plasma membrane of intact Madin-Darby canine kidney (MDCK) cells (IC50 4.6 and 1.2 μM), while a sub-EC50 dose of (±)-spiro-oxanthromicin A was optimal at potentiating (750%) the K-Ras inhibitory activity of staurosporine (IC50 60 pM). These studies demonstrate that a rare class of Streptomyces polyketide modulates K-Ras plasma membrane localisation, with implications for the future treatment of K-Ras dependent cancers.
Introduction
Ras GTPases are key molecular switches that regulate cell growth, proliferation and differentiation, and are ubiquitously expressed in mammalian cells as three isoforms (H-Ras, N-Ras and K-Ras).1 Constitutively activated oncogenic K-Ras is a key driver of oncogenesis in pancreatic adenocarcinomas (95%), colon adenomas (40%) and non-small cell lung cancer (15–20%).2 The key role played by K-Ras in these cancers is evidenced by experimental data, which demonstrate that inhibition of K-Ras membrane localisation blocks all oncogenic activity.3 Despite K-Ras inhibitors being very attractive prospects as cancer chemotherapeutics, the development of clinically useful inhibitors has proved elusive.
In an effort to address this challenge, we employed a high-throughput, high-content assay to screen a library of microbial extracts, successfully detecting a Streptomyces sp. (MST-134270), isolated from a soil sample collected near Pamplona, Spain, as a source of metabolites that selectively mislocalised Ras proteins. In an earlier report,4 we described staurosporine (10) isolated from this culture as a potent and selective inhibitor of K-Ras plasma membrane (PM) localisation, disrupting phosphatidylserine trafficking at concentrations below the threshold required for high affinity pan-kinase activity. This report extends our earlier findings, to describe the spectroscopic analysis, chemistry and biology of compounds 1–9 (Fig. 1), including commentary on their biosynthetic origins, chemical stability and total synthesis.
Fig. 1.
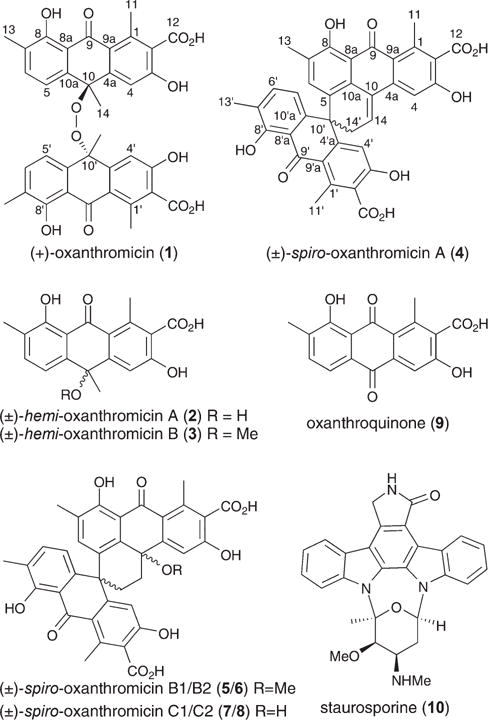
Structures of 1–10.
Results and discussion
Bioassay-guided fractionation of a solid phase (cracked wheat) cultivation of MST-134270 resulted in the isolation and characterisation of five new polyketides, (+)-oxanthromicin (1), (±)-hemi-oxanthromicin A (2), (±)-hemi-oxanthromicin B (3), (±)-spiro-oxanthromicin A (4), and oxanthroquinone (9), as well as the detection and identification of four new metastable analogues, (±)-spiro-oxanthromicins B1/B2 (5/6), and (±)-spiro-oxanthromicins C1/C2 (7/8), and the isolation of the known indole alkaloid staurosporine (10) (Fig. 1).
HRESI(−)MS measurements on 1 established a molecular formula of C36H30O12 (Δmmu −0.2) while the NMR (DMSO-d6) data (Fig. 2 and ESI Table S1a†) revealed only 18 carbon resonances, necessitating a degree of symmetry. Further analysis of the 1H NMR data revealed resonances for one tertiary methyl (δH 1.44), two benzylic methyls (δH 2.18 and 2.69), one isolated (δH 7.16) and two ortho coupled (δH 6.33 and 7.12, 7.8 Hz) aromatic protons, and a chelated hydroxy group (δH 13.46, s), with diagnostic 2D NMR correlations permitting assembly of a dimeric anthrone featuring a rare peroxide bridge. A search of the literature and comparison of NMR data with the published compound (ESI Table S1b†) confirmed that 1 was (+)-oxanthromicin ( , c 0.26, EtOH), a new enantiomer of the rare Streptomyces metabolite (−)-oxanthromicin ( , c 0.3, EtOH).5
Fig. 2.
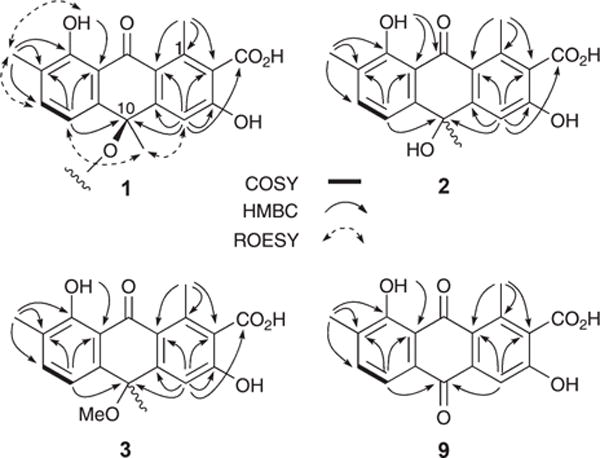
Selected 2D NMR correlations for 1–3 and 9.
Molecular formulae attributed to 2 (C18H16O6, Δmmu +0.8) and 3 (C19H18O6, Δmmu −0.2) on the basis of HRESI(−)MS measurements were suggestive that both compounds contain the monomer polyketide unit in 1. Supportive of this hypothesis, analysis of the NMR (DMSO-d6) data for 2 and 3 (Fig. 2 and ESI Tables S2–S3†) revealed differences centred around replacement of the C-10 peroxy bridge in 1 with (i) a 10-OH (δH 6.11) moiety in 2, exhibiting HMBC correlations to C-4a, C-10 and C-10a and ROESY correlations to H-4 and H-5, and (ii) a 10-OMe (δH 2.81, s; δC 51.8) moiety in 3, exhibiting HMBC correlations to C-10 and ROESY correlations to H-4 and H-5. These observations, together with the lack of an optical rotation, permitted assignment of racemic structures to (±)-hemi-oxanthromicins A (2) and B (3) as indicated. Similarly, HRESI(−)MS measurements on 9 (C17H12O6, Δmmu +0.7) together with analysis of the 1D and 2D NMR (DMSO-d6) data (Fig. 2 and ESI Table S5†) permitted assignment of the structure for oxanthroquinone (9) as indicated.
HRESI(−)MS measurements established a molecular formula of C36H26O10 (Δmmu −0.3) for 4, while analysis of the NMR (DMSO-d6) data (Fig. 3 and ESI Table S4†), suggested a heavily substituted aromatic system possessing many structural characteristics in common with the co-metabolites 1–3. Detailed analysis of these NMR data, including consideration of diagnostic 2D NMR correlations, permitted assembly of the planar structure as indicated. More specifically, HMBC correlations required that the aromatic methyl H3-13 be flanked by H-6 and the phenolic 8-OH, while additional correlations linked this fragment to the quaternary aromatics C-8a and C-10a, and the sp3 spiro C-10′. COSY correlations established the H2-14′ to H-14 fragment, while HMBC correlations linked this fragment to C-10′, C-5, C-10a and C-10. Further HMBC correlations required that the aromatic methyl H3-11 be flanked by C-2 and C-9a, and para-disposed to H-4, which was in turn flanked by C-4a and C-5 (the latter bearing a hydroxy group). Additional HMBC correlations from H-4 to C-10, supported by ROESY correlations between (i) H-6 and H3-13, (ii) H3-13 and 8-OH, (iii) 8-OH and H3-11 and (iv) H-4 and H-14, defined the ABCD ring system as indicated (Fig. 3). Comparable 2D NMR correlations defined the EFG ring system, with diagnostic HMBC correlations linking the spiro C-10′ to H-4′, H-5′ and H-6′. ROESY correlations between H-5′ and both H-6 and H2-14′, and between H-4′ and both H-6 and H2-14′, defined the orthogonal relationship between the ABCD and EFG ring systems (Fig. 3). Despite the presence of a chiral centre (C-10′), the lack of an optical rotation required that (±)-spiro-oxanthromicin A (4) be assigned the racemic structure as indicated. Further chemical studies supportive of this structure assignment are presented below.
Fig. 3.
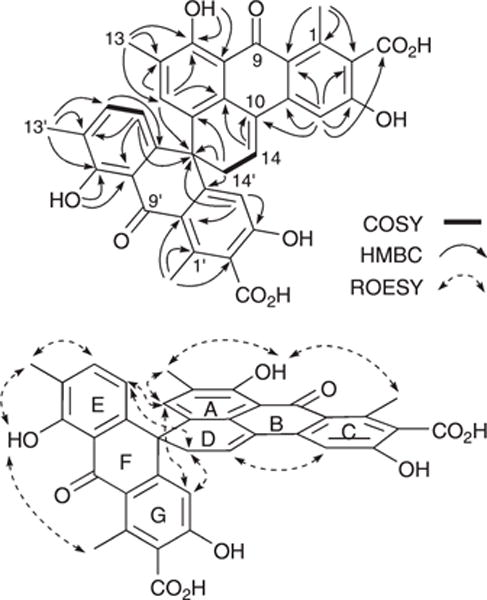
Selected 2D NMR correlations for 4.
HPLC-DAD-MS analysis of the crude MeOH extract of Streptomyces sp. MST-134270 confirmed the dominant cultivation/biosynthetic products as 1, 2 and 10, with 3 and 4 only detected at trace levels (ESI Fig. S10†). Significantly, during SPE fractionation, the detected (and recovered) yields of 3 and 4 increased, as did levels of two hitherto undetected compounds 5 and 6. These observations strongly suggested that 3–6 were capable of being produced during handling (ESI Fig. S11†). In support of this hypothesis, exposure of a pure sample of 2 to 0.1% TFA–MeOH (conditions comparable to those encountered during SPE fractionation) resulted in partial conversion to 3 and 4, while exposure to 0.1% TFA–MeCN yielded only 4 (ESI Fig. S12†). Likewise, a pure sample of 3 was observed to undergo partial conversion to 2 during routine handling.
In an effort to assign structures to 5 and 6, we noted that their UV-vis (DAD) spectra were similar to those of 1–3, suggestive of closely related chromophores and molecular structures, while HPLC-HRESI(−)MS analysis suggested that 5 (C37H30O11, Δmmu +2.4) and 6 (C37H30O11, Δmmu +2.0) were isomeric MeOH adducts of 4. Attempts at purification of 5 and 6 by reversed phase HPLC proved problematic as immediately post-elution both underwent partial conversion to 7 and 8, a transformation that proceeded to near-completion after standing at r.t. for 3 h (ESI Fig. S13–S14†). The transformation products 7 and 8 exhibited almost identical UV-vis (DAD) spectra to 5 and 6, with HPLC-HRESI(−)MS analysis suggesting that 7 (C36H28O11, Δmmu +0.6) and 8 (C36H28O11, Δmmu +0.0) were isomeric H2O adducts of 4. On concentrating in vacuo and resuspending in MeOH, the mixture of 7 and 8 rapidly transformed to a complex mixture of 4–8, dominated by 4.
In presenting a plausible mechanism for the biosynthetic/chemical origins of 1–9 (Fig. 4), we speculate that the polyketide precursor, oxanthroquinone (9), undergoes stereospecific methylation to a single (10R) enantiomer of 2, which in turn undergoes dimerisation to (+)-oxanthromicin (1). Acid-mediated dehydration of 2 could deliver an achiral carbocation intermediate that is reversibly quenched with either H2O or MeOH to yield (±)-hemi-oxanthromicin A (2) or B (3) respectively. Significantly, the carbocation intermediate could also transform, via a mechanism foreshadowed in a 1979 study directed at the acid-mediated dimerisation of 10-methyleneanthrone,6 to yield a (±)-spiro-carbocation. The (±)-spiro-carbocation could in turn undergo reversible quenching with either MeOH or H2O to deliver the diastereomeric (±)-spiro-oxanthromicin B1 (5) and B2 (6), or the diastereomeric (±)-spiro-oxanthromicin C1 (7) and C2 (8), respectively. Finally, the acid-labile doubly benzylic 10-OH moiety in 7 and 8 can undergo irreversible dehydration to yield (±)-spiro-oxanthromicin A (4) as a stable quinone methide. In addition to rationalising the biosynthetic/chemical relationships between 1–9, this biosynthetic/chemical pathway demonstrates for the first time that a rare spiro dimerisation mechanism, first proposed in 1979,6 has a footprint in the natural world.
Fig. 4.
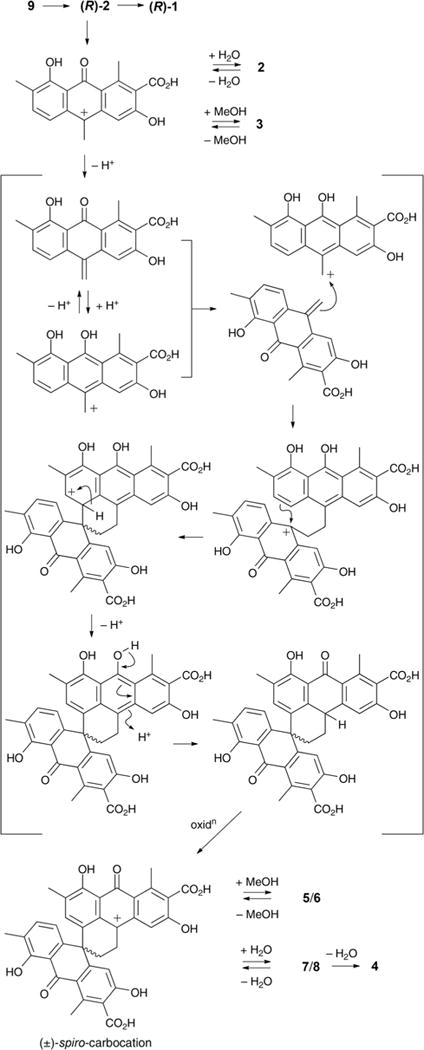
Biosynthetic/chemical pathway linking 1–9.
To support the structural assignments outlined above, and to provide material for a structure activity relationship (SAR) study, we embarked on the syntheses summarised in Scheme 1. Commercially available 2,4-dichloro-1,4-benzoquinone was treated with the Danishefsky diene derived from tiglic aldehyde7 to form a Diels–Alder adduct, which on Jones oxidation yielded 2-chloro-8-hydroxy-7-methylnaphthaquinone8 (60%). A subsequent Diels–Alder reaction with the Danishefsky diene derived from ethyl diacetoacetate9 yielded oxanthroquinone ethyl ester (11) (58%) (ESI Fig. S6a–S6b†), which on hydrolysis returned oxanthroquinone (9) (88%). Treatment of synthetic 9 with MeMgBr resulted in regioselective addition to C-10 in preference to C-9, which is chelated to the adjacent 8-hydroxy, to yield (±)-hemi-oxanthromicin A (2) (45%). NMR data showed that synthetic samples 9 and 2 are identical in all respects to the natural products. As the stability studies discussed above had established a sequence of chemical transformations from 2 to 3–8, the total synthesis of 9 and 2 represents a formal synthesis of 3–8. To further explore SAR, we exploited the chelation of 8-OH to selectively mono-methylate 11 with MeI (Scheme 1) to yield 3-O-methyl oxanthroquinone ethyl ester (14) (72%) (ESI Fig. S7a–S7b†).
Scheme 1.
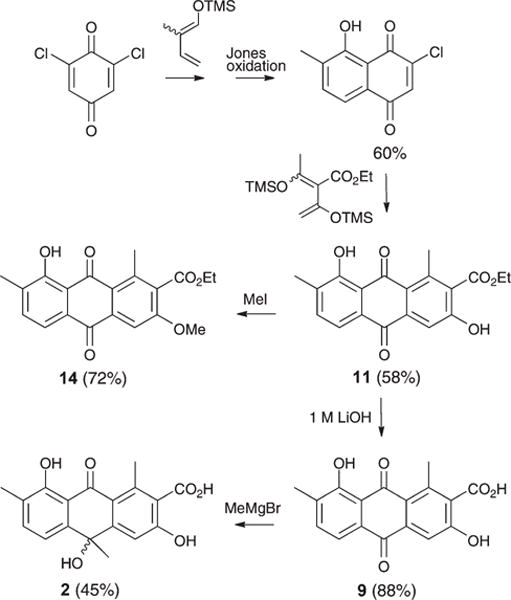
Synthesis of 2, 9, 11, and 14.
On reviewing the polyketide natural products literature, we noted 1–9 possess unique 1-Me/7-Me and 2-CO2H substitutions. To explore the possible SAR significance of the 7-Me and 2-CO2H moieties, we completed the syntheses outlined in Scheme 2, transforming 3-bromojuglone to 7-desmethylox-anthroquinone ethyl ester (12) (68%) (ESI Fig. S8a–S8b†) and 7-desmethyloxanthroquinone (13) (90%) (ESI Fig. S9a–S9b†).
Scheme 2.
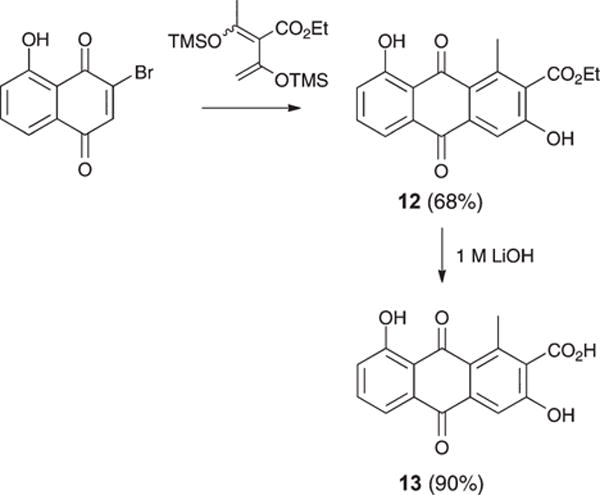
Synthesis of 12 and 13.
We next set out to use quantitative confocal imaging to measure the ability of 1–2, 4, 9 and 11–14 to mislocalise oncogenic mutant K-Ras (mGFP-K-RasG12 V) from the PM of intact Madin-Darby canine kidney (MDCK) cells following a previously published protocol.4 The results (Table 1) revealed that the natural product (+)-oxanthromicin (1), the dimeric transformation product (±)-spiro-oxanthromicin A (4) and the synthetic ethyl ester analogues 12, 11 and 14 (in increasing order of potency) were effective at mislocalising K-Ras from the PM. An SAR analysis of these data suggests that the monomers 11 and 12–14 are more active than the dimers 1 and 4, and that esterification of the 2-CO2H moiety improves K-Ras mislocalisation. Activity is further enhanced by the presence of a 7-Me, and substitution (methylation) of the 3-OH.
Table 1.
Summary of K-Ras mislocalisation studies
| Compound | Emax ± SEM | IC50 (μM) ± SEM |
|---|---|---|
| 1 | 0.76 ± 0.02 | 62.5 ± 8.0 |
| 2 | 0.47 ± 0.03 | a |
| 4 | 0.75 ± 0.03 | 26.7 ± 7.2 |
| 9 | 0.44 ± 0.05 | a |
| 11 | 0.76 ± 0.04 | 4.6 ± 0.8 |
| 12 | 0.73 ± 0.02 | 18.6 ± 2.9 |
| 13 | 0.43 ± 0.02 | a |
| 14 | 0.73 ± 0.02 | 1.2 ± 0.3 |
| 10 | 0.67 ± 0.03 | 0.00051 ± 0.0002 |
Compounds with an Emax < 0.50 were deemed to be inactive. Negative control DMSO Emax = 0.37.
To further our investigations into oxanthromicin/oxanthroquinone chemistry and biology, we analysed our in-house database of the HPLC-DAD secondary metabolite profiles of ∼50 000 microbial extracts, to detect additional Streptomyces capable of producing examples of this structure class. This study revealed two Streptomyces that were subsequently re-cultivated and subjected to detailed chemical analysis. Streptomyces sp. MST-RA9773 isolated from a soil sample collected near Barellan, New South Wales (NSW), and Streptomyces sp. MST-104069 isolated from a soil sample collected near Broken Hill, NSW, produced 1 and related hemi- and spiro-oxanthromicins, only the former produced 10. This analysis established that oxanthromicins/oxanthroquinone are exceptionally rare with an incidence (in our library) of ∼1 : 17 000, in contrast to staurosporine with an incidence of ∼1 : 100. The repeated co-production of oxanthromicins/oxanthroquinone and staurosporine is noteworthy, and raised the possibility that these structurally diverse microbial metabolites may exhibit synergistic biological properties. To probe this hypothesis, we quantified the K-Ras mislocalising properties of 10 when exposed to sub-IC50 doses of 1–2, 4, 9 or 12–13 (4 μM), 11 (1.45 μM) and 14 (0.60 μM), revealing significant levels of synergism by 1 (130%), 4 (750%), 11 (410%) and 14 (470%).
Conclusions
In conclusion, this report describes a successful high-throughput, high-content microbial biodiscovery approach to detect and identify novel small molecule inducers of K-Ras PM mislocalisation. Our chemical investigations of Streptomyces sp. MST-134270 yielded a suite of new polyketides 1–9, interconnected by an array of biosynthetic and chemical transformations, inclusive of the first natural occurrence of a rare spiro dimerisation reaction. Structure elucidations were supported by detailed spectroscopic analysis, chemical interconversion and total synthesis. SAR studies established the synthetic anthraquinone 14 as a potent lead candidate, capable of mislocalising oncogenic mutant K-Ras (mGFP-K-RasG12 V) from the PM of intact MDCK cells. We established the natural occurrence of oxanthromicins/oxanthroquinone (in our library) as being exceptionally low, and correlated with the co-production of staurosporine (10). Co-treatment of 10 with sub-EC50 doses of selected oxanthroquinones resulted in a significant synergism of K-Ras PM mislocalisation. Collectively, these studies demonstrate that a rare class of Streptomyces polyketides, and analogues inspired by these compounds, can induce significant K-Ras PM mislocalisation (IC50 1.2 μM), and can synergise the K-Ras PM mislocalisation properties of staurosporine (IC50 60 pM). A detailed account of the biological properties and mechanism of action of these polyketides will be reported elsewhere.
Experimental section
Microbial cultivation and extraction
A Streptomyces sp. (MST-134270) cultivation was incubated for 10 days at 28 °C in 40 Erlenmeyer flasks (250 mL each) containing sterilised cracked wheat (50 g) hydrated in water (30 mL), and inoculated with 5 mL of a ISP2 media seed fermentation. The resulting ferment (3.14 kg) was extracted with acetone (6 L), filtered and concentrated in vacuo to an aqueous concentrate (800 mL). The aqueous concentrate was extracted with EtOAc (1.5 L) and concentrated in vacuo to yield a crude EtOAc extract (7.2 g), which was subsequently partitioned between hexane and MeOH to give hexane-soluble (2.4 g) and MeOH-soluble (4.8 g) extracts (ESI Scheme S1†).
Fractionation and characterisation of compounds
A portion of MeOH-soluble extract (206 mg) was fractionated using a C18-max SPE cartridge (5 g) eluting with a stepwise gradient from 90% H2O–MeOH to 100% MeOH with isocratic 0.01% TFA modifier to give Fractions A–G. SPE Fraction E (62 mg), eluting at 30% H2O–MeOH, was further fractionated by semi-preparative HPLC (Agilent Zorbax XDB-C8, 5 μm, 9.4 × 250 mm column, 10 min gradient elution at 3.5 mL min−1 from 70–20% H2O–MeCN, then 100% MeCN for 5 min, with isocratic 0.01% TFA modifier) to afford staurosporine (10) (tR 4.8 min, 16.0 mg), (±)-hemi-oxanthromicin A (2) (tR 8.1 min, 17.1 mg) and (±)-hemi-oxanthromicin B (3) (tR 10.1 min, 2.9 mg). SPE Fraction F (40 mg), eluting at 15% H2O–MeOH, was further fractionated by semi-preparative HPLC (Agilent Zorbax XDB-C8, 5 μm, 9.4 × 250 mm column, 12 min gradient elution at 3.5 mL min−1, from 50–20% H2O–MeCN with isocratic 0.01% TFA modifier) to afford staurosporine (10) (tR 2.8 min, 7.5 mg), (±)-hemi-oxanthromicin A (2) (tR 5.2 min, 8.0 mg), oxanthroquinone (9) (tR 6.5 min, 2.0 mg), (±)-hemi-oxanthromicin B (3) (tR 7.5 min, 5.1 mg), (±)-spiro-oxanthromicin B1 (5)* (tR 9.0 min, 2.0 mg), (±)-spiro-oxanthromicin A (4) (tR 9.8 min, 1.8 mg), (±)-spiro-oxanthromicin B2 (6)* (tR 10.6 min, 1.5 mg). (*Note: 5 and 6 transformed to the more stable 4 during the removal of HPLC solvents.) SPE Fraction G (55 mg), eluting with MeOH, was further fractionated by semi-preparative HPLC (Agilent Zorbax XDB-C8, 5 μm, 9.4 × 250 mm column, 12 min gradient elution at 3.5 mL min−1, from 60% H2O–MeCN to 100% MeCN with isocratic 0.01% TFA modifier) to afford staurosporine (10) (tR 3.5 min, 5.5 mg), (±)-hemi-oxanthromicin A (2) (tR 6.2 min, 0.7 mg), (±)-hemi-oxanthromicin B (3) (tR 8.2 min, 1.8 mg), (±)-spiro-oxanthromicin A (4) (tR 9.7 min, 2.3 mg) and (+)-oxanthromicin (1) (tR 11.4 min, 13.7 mg) (ESI Scheme S1†). Based on the above, the estimated % yield from the crude culture extract is 1 (0.99%), 2 (1.9%), 3 (0.71%), 4 (0.30%), 5 (0.14%), 6 (0.11%), 9 (0.15%) and 10 (2.1%) (Note: these yields do not take into account the transformation of 2 to 3 and 4; 3 to 2; 5 and 6 to 4 after HPLC purification). (ESI Fig. S13–S14†).
(+)-Oxanthromicin (1)
Yellow amorphous solid; (c = 0.26, EtOH); UV (MeOH) λmax (log ε) 259 (4.34), 321 (4.31), 355 (4.22) nm; NMR (DMSO-d6) see ESI Table S1 and Fig. S1a–S1b†; HRESI(−)MS m/z 653.1662 [M − H]− (calcd for C36H29O12−, 653.1664).
(±)-hemi-Oxanthromicin A (2)
Yellow amorphous solid; (c = 0.10, EtOH); UV (MeOH) λmax (log ε) 259 (4.05), 325 (4.02), 341 (3.99), 356 (3.96) nm; NMR (DMSO-d6) ESI Table S2 and Fig. S2a–S2b†; HRESI(−)MS m/z 327.0882 [M − H]− (calcd for C18H15O6−, 327.0874).
(±)-hemi-Oxanthromicin B (3)
Yellow amorphous solid; (c = 0.13, EtOH); UV (MeOH) λmax (log ε) 258 (4.12), 323 (4.10), 344 (4.04), 355 (4.03) nm; NMR (DMSO-d6) ESI Table S3 and Fig. S3a–S3b†; HRESI(−)MS m/z 341.1029 [M − H]− (calcd for C19H17O6−, 341.1031).
(±)-spiro-Oxanthromicin A (4)
Yellow amorphous solid; (c = 0.13, EtOH); UV (MeOH) λmax (log ε) 239 (4.55), 258 (4.48), 303 (4.38), 356 (4.18) nm; NMR (DMSO-d6) ESI Table S4 and Fig. S4a–S4b†; HRESI(−)MS m/z 617.1450 [M − H]− (calcd for C36H25O10−, 617.1453).
(±)-spiro-Oxanthromicin B1 (5)
UV (MeCN–H2O) λmax 235, 275, 320, 360 nm; HRESI(−)MS m/z 649.1739 [M − H]− (calcd for C37H29O11−, 649.1715).
(±)-spiro-Oxanthromicin B2 (6)
UV (MeCN–H2O) λmax 235, 275, 320, 360 nm; HRESI(−)MS m/z 649.1735 [M − H]− (calcd for C37H29O11−, 649.1715).
(±)-spiro-Oxanthromicin C1 (7)
UV (MeCN–H2O) λmax 235, 275, 320, 360 nm; HRESI(−)MS m/z 635.1565 [M − H]− (calcd for C36H27O11−, 635.1559).
(±)-spiro-Oxanthromicin C2 (8)
UV (MeCN–H2O) λmax 235, 275, 320, 360 nm; HRESI(−)MS m/z 635.1559 [M − H]− (calcd for C36H27O11−, 635.1559).
Oxanthroquinone (9)
Orange amorphous solid; UV (MeOH) λmax (log ε) 221 (4.19), 284 (4.14), 412 (3.53) nm; NMR (DMSO-d6) ESI Table S5 and Fig. S5a–S5b†; HRESI(−)MS m/z 311.0568 [M − H]− (calcd for C17H11O6−, 311.0561).
Chemical stability studies of 1–4
Aliquots of 1–4 (0.1 mg) were dissolved in either 0.1% TFA in MeCN (0.5 mL) or 0.1% TFA in MeOH (0.5 mL) and heated at 40 °C for 24 h, after which the solutions were analysed by HPLC-DAD-MS (Agilent Zorbax SB-C8, 5 μm, 4.6 × 150 mm column, 15 min gradient elution at 1 mL min−1 from 90% H2O–MeCN to 100% MeCN with isocratic 0.05% formic acid modifier). Samples of 1–4 (0.1 mg) dissolved in MeOH (1.0 mL) were used as authentic standards, and analysed by the same HPLC method. Analytical results, as illustrated in the ESI Fig. S12–S14,† demonstrate that whereas 1 and 4 were stable under these conditions, 2 and 3 equilibrate, and transform through 5 and 6, to 7 and 8, and finally to 4.
Synthetic studies
2-Chloro-8-hydroxy-7-methylnaphthaquinone
A solution of 2,4-dichloro-1,4-benzoquinone (354 mg, 2.00 mmol) and the Danishefsky diene derived from tiglic aldehyde7 (340 mg, 2.18 mmol) in toluene (5 mL) was stirred at r.t. for 1 h. After concentrating in vacuo, the residue was dissolved in acetone and stirred at r.t. for 16 h in the presence of Jones reagent (2.5 M CrO3 in 3.6 M H2SO4) (5.0 mL, 12.5 mmol). After quenching excess reagent by addition of 2-propanol (10 mL) the reaction mixture was filtered, extracted with Et2O (20 mL), and the organic phase washed with H2O (10 mL) and brine (10 mL). The residue recovered from concentrating in vacuo was recrystallised from EtOAc to afford 2-chloro-8-hydroxy-7-methylnaphthaquinone8 (266 mg, 60% for 2 steps). 1H NMR (600 MHz, CDCl3): δH = 12.06 (s, 1H), 7.56 (d, J = 7.7 Hz, 1H), 7.53 (d, J = 7.7 Hz, 1H), 7.17 (s, 1H), 2.37 (s, 3H).
Oxanthroquinone ethyl ester (11)
A solution of 2-chloro-8-hydroxy-7-methylnaphthaquinone (80 mg, 0.36 mmol) and the Danishefsky diene derived from ethyl diacetoacetate9 (230 mg, 0.72 mmol) in toluene (5 mL) was refluxed for 3 days. After concentrating in vacuo the residue was extracted with CH2Cl2 (5 mL) and stirred in the presence of silica gel (240 mg) at r.t. for 5 min. The reaction mixture was then concentrated in vacuo and the residue purified by silica gel chromatography (isocratic elution 1 : 10 EtOAc–light petroleum) to afford oxanthroquinone ethyl ester (11) (Rf 0.4; 71 mg, 58%). UV (MeOH) λmax (log ε) 221 (4.50), 273 (4.58), 414 (3.93) nm; 1H NMR (600 MHz, CDCl3): δH = 13.28 (s, 1H), 10.49 (s, 1H), 7.78 (s, 1H), 7.69 (d, J = 7.6 Hz, 1H), 7.49 (d, J = 7.6 Hz, 1H), 4.53 (q, J = 7.2 Hz, 1H), 2.99 (s, 3H), 2.38 (s, 3H), 1.48 (t, J = 7.2 Hz, 3H); 13C NMR (150 MHz, DMSO-d6): δC = 189.6, 181.6, 166.8, 160.0, 158.9, 141.0, 136.8, 136.5, 134.6, 130.2, 129.8, 122.4, 118.1, 115.7, 112.0, 61.5, 19.9, 15.9, 14.1 (ESI Fig. S6a–S6b†); HRESI (−)MS m/z 339.0873 [M − H]− (calcd for C19H15O6−, 339.0874).
Oxanthroquinone (9)
A solution of 11 (70 mg, 0.21 mmol) in aq. LiOH (1 M; 2 mL) was stirred at 100 °C overnight. The dark red solution was then acidified by addition of aq. HCl (1 M; 2.1 mL) and extracted with Et2O (3 × 5 mL). The organic phase was dried over anhydrous MgSO4, concentrated in vacuo and purified using a C18 SPE cartridge (stepwise gradient of 90% H2O–MeCN to 100% MeCN) to afford synthetic oxanthroquinone (9; 56 mg, 88%) identical in all respects to natural 9.
(±)-hemi-Oxanthromicin A (2)
A solution of 9 (20 mg, 0.064 mmol) in anhydrous THF (1 mL) was cooled to 0 °C and MeMgBr (3 M in Et2O; 430 μL, 1.3 mmol) was added. The mixture was allowed to reach r.t. and then stirred overnight. After quenching with sat. aqueous NH4Cl, the reaction mixture was acidified to pH 4 with 0.1 M HCl and extracted with Et2O (3 × 3 mL), after which the organic phase was dried over anhydrous MgSO4, concentrated in vacuo, and purified by semi-preparative HPLC [Agilent Zorbax Rx-C8, 5 μm, 9.4 × 250 mm column, 15 min gradient elution at 3.5 mL min−1 from 90% H2O–MeCN to 100% MeCN with isocratic 0.01% TFA modifier] to afford synthetic (±)-hemi-oxanthromicin A (2; tR 10.9 min, 8.3 mg, 45%), identical in all respects to natural 2, and recovered oxanthroquinone (9; tR 11.9 min, 9 mg, 43%).
3-O-Methyl oxanthroquinone ethyl ester (14)
A solution of 11 (6.0 mg, 0.018 mmol) and K2CO3 (5.0 mg, 0.035 mmol) in acetone (1 mL) was treated with MeI (6.0 mg, 0.042 mmol) and stirred overnight at r.t. The filtered reaction mixture was acidified to pH 4 with 0.1 M HCl and extracted with Et2O (3 × 3 mL), and the organic phase dried over anhydrous MgSO4, concentrated in vacuo, and purified by preparative HPLC [Phenomenex Luna C18 (2), 10 μm, 21.2 × 250 mm column, 15 min gradient elution at 20 mL min−1 from 90% H2O–MeCN to 100% MeCN with isocratic 0.01% TFA modifier] to afford 3-O-methyl-oxanthroquinone ethyl ester (14; tR 16.9 min, 4.5 mg, 72%). UV (MeOH) λmax (log ε) 222 (4.70), 270 (4.72), 298 (4.28), 415 (3.94) nm; 1H NMR (600 MHz, CDCl3): δH = 13.25 (s, 1H), 7.75 (s, 1H), 7.69 (d, J = 7.7 Hz, 1H), 7.48 (d, J = 7.7 Hz, 1H), 4.46 (q, J = 7.2 Hz, 1H), 4.01 (s, 3H), 2.76 (s, 3H), 2.37 (s, 3H), 1.41 (t, J = 7.2 Hz, 3H); 13C NMR (150 MHz, CDCl3): δC = 190.3, 182.5, 167.3, 161.1, 160.0, 141.4, 137.8, 136.5, 135.8, 131.5, 130.6, 125.0, 118.8, 116.2, 107.6, 62.1, 56.6, 20.2, 16.5, 14.3 (ESI Fig. S7a–S7b†); HRESI(+)MS m/z 377.0997 [M + Na]+ (calcd for C20H18O6Na+, 377.0996).
7-Desmethyloxanthroquinone ethyl ester (12)
A solution of 3-bromojuglone10 (100 mg, 0.40 mmol) and the Danishefsky diene derived from ethyl diacetoacetate9 (250 mg, 0.79 mmol) in toluene (5 mL) was refluxed for 3 days. After concentrating in vacuo the residue was dissolved in CH2Cl2 (5 mL), stirred with silica gel (250 mg) at r.t. for 5 min, concentrated in vacuo and purified by silica gel chromatography (isocratic elution 1 : 10 EtOAc–light petroleum) to afford 7-desmethyloxanthroquinone ethyl ester (12; Rf 0.4; 88 mg, 68%).11 UV (MeOH) λmax (log ε) 220 (4.20), 272 (4.26), 409 (3.47) nm; 1H NMR (600 MHz, CDCl3): δH = 12.93 (s, 1H), 10.53 (s, 1H), 7.79 (s, 1H), 7.78 (dd, J = 7.5, 1.0 Hz, 1H), 7.62 (dd, J = 8.3, 7.5 Hz, 1H), 7.31 (dd, J = 8.3, 1.0 Hz, 1H), 4.54 (q, J = 7.2 Hz, 1H), 2.99 (s, 3H), 1.48 (t, J = 7.2 Hz, 3H); 13C NMR (150 MHz, CDCl3): δC = 189.6, 182.2, 170.1, 163.6, 162.5, 148.0, 138.7, 135.8, 132.7, 125.0, 124.5, 121.2, 118.9, 117.5, 115.1, 62.9, 21.9, 14.1 (ESI Fig. S8a–S8b†); HRESI(−)MS m/z 325.0719 [M − H]− (calcd for C18H13O6−, 325.0718).
7-Desmethyloxanthroquinone (13)
A solution of 12 (48 mg, 0.15 mmol) in aq. LiOH (1 M; 1 mL) was stirred at 100 °C overnight. The dark red solution was acidified by aq. HCl (1 M; 1.05 mL) and extracted with Et2O (2 × 5 mL), after which the organic phase was dried over anhydrous MgSO4, concentrated in vacuo, and purified using a C18 SPE cartridge (stepwise gradient of 90% H2O–MeCN to 100% MeCN) to afford 7-desmethyloxanthroquinone (13; 39 mg, 90%).12 UV (MeOH) λmax (log ε) 217 (4.68), 280 (4.72), 411 (4.08) nm; 1H NMR (600 MHz, DMSO-d6): δH = 12.89 (s, 1H), 7.76 (dd, J = 8.3, 7.5 Hz, 1H), 7.66 (dd, J = 7.5, 1.1 Hz, 1H), 7.60 (s, 1H), 7.36 (dd, J = 8.3, 1.1 Hz, 1H), 2.71 (s, 3H); 13C NMR (150 MHz, DMSO-d6): δC = 189.4, 182.1, 168.3, 161.5, 159.2, 140.9, 136.4, 136.2, 132.5, 131.2, 124.5, 122.5, 118.4, 116.9, 112.2, 20.0 (ESI Fig. S9a–S9b†); HRESI(−)MS m/z 297.0405 [M − H]− (calcd for C16H9O6−, 297.0405).
K-Ras bioassay
Madin-Darby canine kidney (MDCK) cells stably co-expressing monomeric green fluorescent protein (mGFP) coupled to the N-terminus of oncogenic K-Ras (K-RasG12 V) and mCherry- CAAX, a red fluorescent fusion protein that decorates endomembranes,4 were plated at 150 000 cells per well on 12-well plates. After 24 h, cells were treated with compounds and incubated for another 48 h. Each compound was tested in 3 independent experiments. At the end of incubation time, cells were fixed with 4% paraformaldehyde and imaged in a Nikon A1R confocal microscope. Ras mislocalisations from the plasma membranes were calculated using Manders coefficients, by measuring the fraction of mCherry-CAAX co-localizing with mGFP-K-RasG12 V.4 IC50 values and two-tailed t-tests were calculated using Prism software (Ver. 5.0c, GraphPad). Emax quantifies the maximum extent of mislocalisation of K-Ras from the plasma membrane to endomembrane.
Supplementary Material
Acknowledgments
We acknowledge the assistance of A. Crombie (MST) in the fermentation and genetic sequencing of isolates, and A. Lacey (MST) in the extraction and purification of metabolites. This research was funded in part by the Australian Research Council (ARC DP120100183 and LP120100088), The University of Queensland, the Institute for Molecular Bioscience, and the Cancer Prevention and Research Institute of Texas (RP100483).
Footnotes
Electronic supplementary information (ESI) available: General experimental details, full details of microbial collection and taxonomy, tabulated 2D NMR data and NMR spectra and LCMS stability studies. See DOI: 10.1039/c4ob00745j
Notes and references
- 1.Hancock JF. Nat Rev Mol Cell Biol. 2003;4:373. doi: 10.1038/nrm1105. [DOI] [PubMed] [Google Scholar]
- 2.Bodemann BO, White MA. Curr Biol. 2013;23:R17. doi: 10.1016/j.cub.2012.11.054. [DOI] [PubMed] [Google Scholar]
- 3.Baines AT, Xu D, Der CJ. Future Med Chem. 2011;3:1787. doi: 10.4155/fmc.11.121. [DOI] [PMC free article] [PubMed] [Google Scholar]
- 4.Cho K-j, Park J-H, Piggott AM, Salim AA, Gorfe AA, Parton RG, Capon RJ, Lacey E, Hancock JF. J Biol Chem. 2012;287:43573. doi: 10.1074/jbc.M112.424457. [DOI] [PMC free article] [PubMed] [Google Scholar]
- 5.(a) Patel M, Horan AC, Gullo VP, Loebenberg D, Marquez JA, Miller GH, Waitz JA. J Antibiot. 1984;37:413. doi: 10.7164/antibiotics.37.413. [DOI] [PubMed] [Google Scholar]; (b) Wright JJK, Merill Y, Puar MS, mcPhail AT. J Chem Soc, Chem Commun. 1984:473. [Google Scholar]
- 6.Becker HD, Sanchez D. J Org Chem. 1979;44:1787. [Google Scholar]
- 7.Gieseler MT, Kalesse M. Org Lett. 2011;13:2430. doi: 10.1021/ol2006727. [DOI] [PubMed] [Google Scholar]
- 8.Boisvert L, Brassard P. J Org Chem. 1988;53:4052. [Google Scholar]
- 9.Caron B, Brassard P. Tetrahedron. 1993;49:771. [Google Scholar]
- 10.Tietze LF, Singidi RR, Gericke KM. Chem – Eur J. 2007;13:9939. doi: 10.1002/chem.200700823. [DOI] [PubMed] [Google Scholar]
- 11.Bingham SJ, Tyman JHP. J Chem Soc, Perkin Trans. 1997;1:3637. [Google Scholar]
- 12.Lee TS, Das A, Khosla C. Bioorg Med Chem. 2007;15:5207. doi: 10.1016/j.bmc.2007.05.019. [DOI] [PubMed] [Google Scholar]
Associated Data
This section collects any data citations, data availability statements, or supplementary materials included in this article.


