Abstract
High-resolution tracking of stem cells remains a challenging task. An ultra-bright contrast agent with extended intracellular retention is suitable for in vivo high-resolution tracking of stem cells following the implantation. Here, a plasmonic-active nanoplatform was developed for tracking mesenchymal stromal cells (MSCs) in mice. The nanoplatform consisted of TAT peptide-functionalized gold nanostars (TAT-GNS) that emit ultra-bright two-photon photoluminescence capable of tracking MSCs under high-resolution optical imaging. In vitro experiment showed TAT-GNS-labeled MSCs retained a similar differentiability to that of non-labeled MSCs controls. Due to their star shape, TAT-GNS exhibited greater intracellular retention than that of commercial Q-Tracker. In vivo imaging of TAT-GNS-labeled MSCs five days following intra-arterial injections in mice kidneys showed possible MSCs implantation in juxta-glomerular (JG) regions, but non-specifically in glomeruli and afferent arterioles. With future design to optimize GNS labeling specificity and clearance, plasmonic-active nanoplatforms may be a useful intracellular tracking tool for stem cell research.
Keywords: gold nanoparticle, mesenchymal stromal cell, plasmonic, tracking, imaging
Graphical Abstract
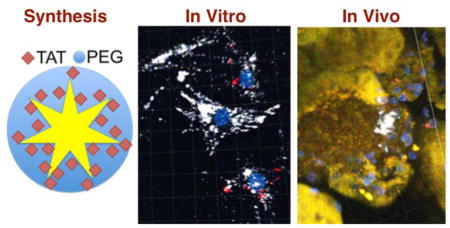
An ultra-bright intracellular contrast agent is developed using TAT peptide-functionalized gold nanostars (TAT-GNS). It poses minimal influence on the stem cell differentiability. It exhibits stronger two-photon photoluminescence and superior labeling efficiency than commercial Q-Tracker. Following renal implantation, some TAT-GNS-labeled MSCs permeate blood vessels and migrate to the juxta-glomerular region.
1. Introduction
Stem cell-based therapy is currently a research area of intense interest due to its high potential in repairing damaged tissues and delivering therapeutic agents.[1, 2] Adult stem cells from the bone marrow, in particular the pluripotent mesenchymal stromal cells (MSCs), have been shown to differentiate into various cell types including muscle, blood, vascular, fat and bone cells. MSCs can be easily isolated and expanded in vitro without losing their differentiation capacity. Immunosuppressive effect and high host tolerance to allogeneic MSCs also render MSCs a promising agent for implantation. Numerous clinical trials are thus currently investigating such therapeutic potential in cardiovascular and neurodegenerative diseases, cancers, and many other pathological disorders. In spite of the fact that MSCs have been a subject of many clinical trials, actual therapeutic applications remain challenging. Poor engraftment at host tissues and lost expression of homing receptors are among the many existing obstacles. The migration, integration, and tissue repair patterns of the injected cells in the body remain unknown due to the lack of proper MSCs tracking capability. In order to understand the in vivo behavior of implanted MSCs, cell-tracking techniques that are sensitive and biocompatible must be developed to monitor MSCs’ location and status following implantation.
In vivo real-time non-invasive imaging of MSCs allows for long-term tracking of cell migration, distribution, and even engraftment following implantation.[3–5] Among different imaging techniques, magnetic resonance imaging (MRI) and positron emission tomography (PET) generally offer a broader field of view for whole body imaging.[6, 7] In contrast, optical imaging provides operation flexibility with higher imaging resolution and sensitivity.[8] For tracking MSCs, which have no intrinsic discriminative imaging feature, a reporter contrast agent must be employed. It is worth noting that each type of reporter has distinct advantages and disadvantages.[9] For example, nanoparticle-based imaging contrast agents (e.g., iron oxides, quantum dots, carbon nanotubes, upconverters, and metal nanoparticles) or radio-nucleotide labels have been designed for sensitive short-term stem cell tracking but suffered from non-specific uptake into surrounding tissues once cells died.[4, 10–16] Reporter gene approaches require transfection of inducible reporters (e.g., HSV1-tk, fluorescence protein, and luciferase), which are expressed only in viable cells,[17] allow for very long-term tracking of MSCs but with a potential immunogenicity that limits their clinical use. Thus far, it remains an ongoing effort to design a cell tracking method with sensitive and high-resolution detection.
For the last few years, plasmonic-active nanoplatforms such as gold nanoparticles (GNPs) have attracted increasing attention due to their optical contrast capability and therapeutic potential in preclinical settings.[3, 18–20] For imaging purposes, GNPs not only exhibit intrinsic contrast properties for multiphoton microscopy (MPM), photoacoustic tomography (PAT) and computer tomography (CT), but also can be chelated with gadolinium and radioisotopes for MRI and PET, respectively.[21, 22] GNPs are generally regarded as biocompatible and can be easily loaded into cells in great quantities.
For high-resolution cell tracking, we focused on exploiting GNPs’ optical properties. Due to their unique plasmon resonance effect, GNPs exhibit not only ultra-bright and stable two-photon photoluminescence (TPL) for MPM, but also high photothermal transduction efficiency for PAT, both of which can operate in the near-infrared (NIR) “tissue optical window” (600–900 nm) that is suitable for deep non-invasive imaging in animals. For example, our group reported gold nanostars (GNS) of intense TPL that are useful for in vivo real-time particle tracking and high-resolution intracellular imaging of GNS.[23, 24] GNS-based TPL and PAT have also been applied in mice for cerebral angiography and optical-modulated opening of the blood-brain barrier.[25, 26] Xia’s group studied the fate of intracellular gold nanocages in vitro and in vivo using both MPM and PAT.[27, 28] Once optimized, GNP-based cell-tracking system can be further developed for delivering therapeutics (e.g., drugs, growth factors and siRNA) as multifunctional theranostic agent. Given these results, GNPs are therefore a potential imaging contrast agent for tracking implanted MSCs.
In this study, we investigated the efficiency of GNS for MSC tracking both in vitro and in vivo. This is the first study to investigate the intra-renal distribution of GNS following administration of TAT-GNS-labeled MSCs. HIV derived TAT-peptide has previously been employed for delivery of nanoparticles into cells.[29–31] The cellular uptake mechanism for TAT-GNS was found active-driven lipid-raft-mediated macropinocytosis.[32] We also applied commercial TAT-functionalized quantum dots (Q-Tracker, Invitrogen) for tracking kidney MSCs.[33] Due to quantum dots’ potential cadmium toxicity and quick intracellular release,[34] gold nanoprobe with greater biocompatibility and longer intracellular retention may be helpful. GNS emit stronger TPL than quantum dots rendering GNS suitable for in vivo real-time single cell tracking.[23, 32] However, the practical use of GNS in tracking stem cells has not been well studied. To assess the interaction specifically between GNS and MSCs, in vitro chase experiments were performed first. MSCs differentiation was compared against the non-labeled controls. Once the optimal tracking window was deduced from the in vitro data, an in vivo study was conducted in which TAT-GNS-labeled MSCs were injected intra-arterially into kidneys of 6- to 8-week old male mice. In each case, MPM was used to examine the distribution of GNS as a surrogate marker for implanted MSCs.
Materials and Methods
TAT-GNS Preparation
All chemicals were purchased from Sigma-Aldrich (St. Louis, MO) and used as received unless noted otherwise. Detail of the surfactant-free GNS synthesis and characterization has been presented previously.[35] Citrate-capped gold seeds were prepared by adding 15 ml of 1% trisodium citrate to 100 ml of boiling HAuCl4 solution (1 mM) under vigorous stirring for 15 minutes. The solution was cooled and filtered by a 0.22 μm nictrocellulose membrane, and stored at 4°C. GNS (~60 nm diameter) were prepared using a seed-mediated method by quickly mixing AgNO3 (1 ml, 3 mM) and ascorbic acid (500 μl, 0.1 M) together into 100 ml of HAuCl4 (0.25 mM) containing HCl (100 μl, 1 M) and citrate gold seeds (1 ml, OD520: 2.8). After 30 seconds, the solution was filtered by a 0.22 μm nitrocellulose membrane. PEG-GNS was prepared by adding 2 μM of SHPEG5000 (O-[2-(3-mercaptopropionylamino)ethyl]-O′-methylpolyethylene glycol, MW 5000) to freshly synthesized GNS for 10 minutes, followed by two centrifugal washes (3000~5000 rcf). Lastly, TAT-GNS were prepared by mixing a final solution of 100 μM of cysteine-TAT-peptide (residues 49–57, sequence Arg-Lys-Lys-Arg-Arg-Arg-Gln-Arg-Cys-CONH2, SynBioSci, Livermore, CA) with 1 nM of PEG-GNS solution for 48 hours at 4°C followed by two centrifugal washes in ethanol. These NP products were examined by TEM (Fei Tecnai G2 Twin, 200 kV) and VIS-NIR spectroscopy (Shimadzu UV-3600; Shimadzu corporation, Japan). The NPs’ hydrodynamic size and concentration were assessed by nanoparticle tracking analysis (NTA 2.3, Build 0025, NanoSight NS500; Nanosight Ltd. UK).
MSC Preparation
C57BL/6 Ren1c YFP (kindly provide by Dr. Ariel Gomez, University of Virginia) were anesthetized, followed by kidney perfusion with saline to flush the blood. Kidneys were harvested, minced and digested with 0.1 % collagenase type I (Gibco) for 30 minutes at 37 °C. The cell suspension was washed with PBS, filtered through 70 μm and 40 μm mesh filters, and treated with ice cold red blood lysing buffer (Sigma) to remove residual red blood cells. Cells were stained with an APC-labeled CD44 antibody and the respective IgG isotype control (BD biosciences). Finally, the CD44+ cells were isolated by two cycles of FACS sorting via specific gates, and the purity of CD44+ cells were confirmed before use. Dead cells were excluded with 7AAD (BD biosciences); doublets were excluded on the basis of three hierarchical gates (forward/side scatter area, forward scatter height/width, and side scatter height/width). Renal CD44+ cells isolated by FACS were cultured in growth medium MesenPRO RS™ Medium (Invitrogen) at 37 °C in the presence of 5% CO2. After 24 to 72 hours, non-adherent cells were discarded. Isolated cells were then grown until sufficient cells were obtained for study. Medium was changed every 2–3 days. Cells were used for experiments during passage 3–6. To evaluate if renal MSCs can be differentiated to renin expressing cells, MSCs were incubated with 3-isobutyl-1-methylxanthine (IBMX) 100 μM, forskolin 10 μM in DMEM 10% FBS (Invitrogen). After 7 days, MSCs were examined for YFP, which is a surrogate for renin expression.[33]
In Vitro Chase Experiment
MSCs were plated (500,000 cells per 10 cm dish) and kept in 37 °C incubator (5% CO2). MSCs were treated with Q-Tracker (Invitrogen) 0.1 nM or TAT-GNS 0.05 nM for 24 h followed by replating them into 35 mm dishes (5,000 cells per plate). Figure 1A depicts the schematic of the chase experiment. In chases 1 and 3, MSCs were incubated with Q-Tracker and TAT-GNS, respectively. In chase 2, Q-Tracker-labeled MSCs and TAT-GNS-labeled MSCs were replated together. In chase 4, Q-Tracker and TAT-GNS were co-incubated with MSCs. Plates of each chase condition were replaced daily to remove cellular excretion. On the 1st, 2nd, and 4th days, plates were washed, fixed with 4% paraformaldehyde, and stained with DAPI (Invitrogen) before imaging.
Figure 1.
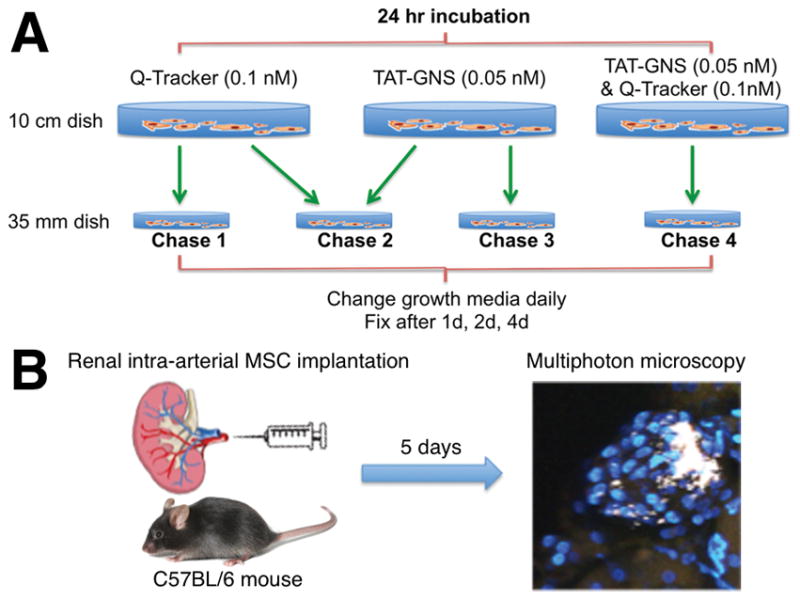
Schematic diagram of (A) the in vitro chase experiment and (B) the in vivo MSC tracking experiment.
Kidney MSC Implantation and Histology
The animal experiments were carried out in accordance with the Duke University Institutional Animal Care and Use Committee guidelines. To determine whether intracellular labels can be used for tracking MSCs in vivo, we employed a mouse model published by Wang et. al. where low sodium and captopril treatment of mice resulted in engraftment and activation of implanted MSCs and their migration to the juxtaglomerular (JG) region.[33] Here, C57BL/6 male mice 6- to 8-week old were preconditioned with low sodium diet (Harlam) for 2 days prior to surgery. Figure 1B illustrates that animals underwent surgery to expose renal arteries for injection of renal MSCs. TAT-GNS (0.05 nM) loaded Ren1c YFP renal CD44+ MSCs (1x10⁶ cells) were concentrated and injected into the kidneys through the renal artery. A group of mice were injected with PBS as control. After three days of a sodium deficient diet, mice were treated with Captopril combined with low sodium diet for 2 more days. Kidneys were then perfused with PBS and harvested. One kidney was cut in half and stored in PBS containing Hoechst 33342 (Invitrogen) 2 μg/ml, and the other was embedded in OCT compound (Sakura Finetek) and frozen on dry ice.
Multiphoton Microscopy Imaging
The MPM images were captured using a commercial multiphoton microscope (Olympus FV1000, Olympus America, Center Valley, PA) at the Light Microscopy Core Facility, Duke University. A femtosecond Ti:Sapphire laser (Chameleon Vision II, Coherent, Santa Clara, CA) with tunable range 680–1080 nm, 140 fsec pulse width and 80 MHz repetition rate was used. The laser beam was focused through a 25× 1.05 NA water-immersion objective (XLPL25XWMP, Olympus America, Center Valley, PA). Images were taken under 800 nm excitation and 0.6 mW unless noted otherwise. Depth sections of images were collected and reconstructed by Fiji (http://fiji.sc/Fiji) or Imaris (Bitplane).
Results and Discussion
TAT-GNS were prepared following a previously described protocol.[32] Figure 2 shows the characterization of PEG-GNS and TAT-GNS. On TEM, GNS have a mode size around 60~70 nm in diameter. TAT-GNS were prepared by a 2-step process. Both PEG and TAT peptides were covalently linked onto the gold surface via the strong dative (gold-sulfar) bond. PEG-GNS was first made by incubating SHPEG5000 with freshly synthesized GNS. TAT-GNS, which was made by incubating cysteine-TAT peptides with PEG-GNS, consisted of a PEG layer for ensuring biophysical stability, and TAT peptides for facilitating cell membrane penetration. Spectroscopic analysis showed that TAT-GNS ensemble exhibits a major plasmon peak at 800 nm and a minor peak (weak shoulder) around 530 nm (Figure 2A). The major and minor peaks correspond to the plasmon mode of the branches and the core, respectively.[35] The mode hydrodynamic size was around 80 nm in diameter with a highly monodisperse size distribution (Figure 2B).
Figure 2.
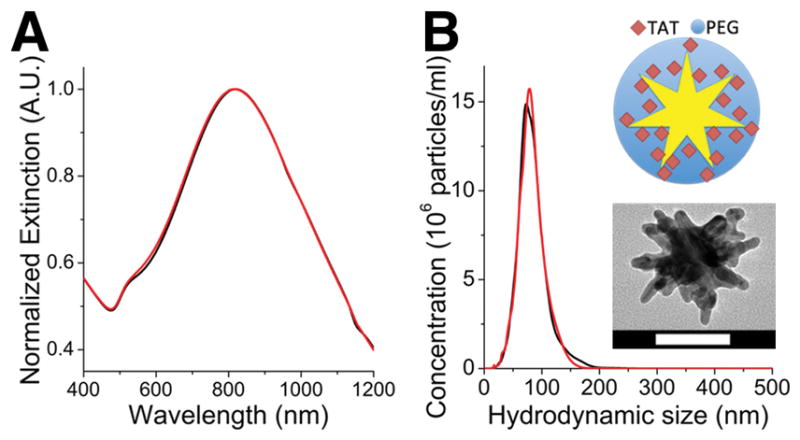
(A) Normalized extinction spectra of PEG-GNS (black) and TAT-GNS (red). (B) Hydrodynamic size distribution of PEG-GNS (black) and TAT-GNS (red). (inset) Illustration and TEM image of TAT-GNS. Scale bar is 50 nm.
Migratability and differentiability are critical for MSCs’ therapeutic function. Here, YFP expression experiment examined the differentiability of MSCs incubated with 3 different concentrations of TAT-GNS up to 0.1 nM for 24 hours (Figure 3). YFP, which is co-expressed during the synthesis of renin, reflects MSCs differentiating into JG-like cells. There was no significant difference in YFP signal between saline treated control (Figure 3A) and TAT-GNS treated groups (Figure 3B–D). MSCs seemed to have retained the capacity to differentiate to renin expressing cells upon incubation with TAT-GNS. It is possible that some MSCs could penetrate the blood vessels and migrate to the towards their target sites. Although we could not assess the surface marker of TAT-GNS-labeled MSCs this time, from our in vivo study it seemed possible that these MSCs still retained a certain level of migratability. Also, TAT-GNS treated MSCs could differentiate into renin-secreting JG-like cells. With a similar YFP expression in labeled and control MSCs, it is possible that TAT-GNS (0.05 nM; 24 hours) incubation did not affect greatly the migratability and differentiability of MSCs. However, this study could not evaluate the in vivo function of the implanted MSCs. Since intracellular nanoparticles can exert either positive or negative influence on MSCs, more studies are needed to evaluate the impact of TAT-GNS in MSCs’ actual function in vivo.[36, 37]
Figure 3.
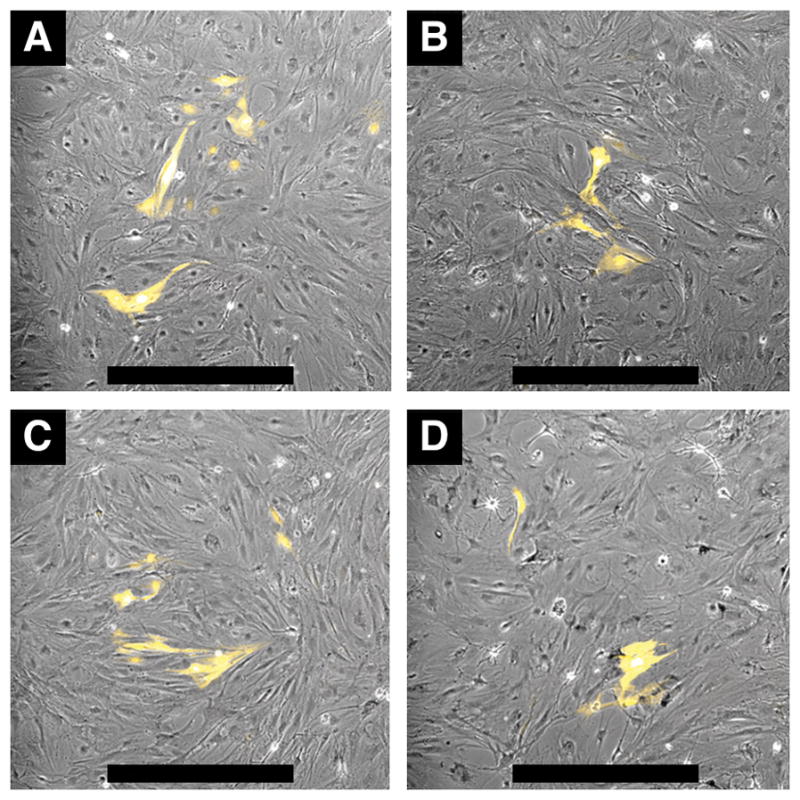
MSC differentiation to renin expressing cells. Differentiation was induced by IBMX and forskolin. MSCs were incubated 24 hours with saline control (A) and TAT-GNS 0.001 nM (B), 0.01 nM (C), 0.1 nM (D). After the incubation, media was replaced daily for 7 days. YFP fluorescence images were overlaid onto phase contrast images. Scale bars are 500 μm.
In vitro chase experiments were performed to compare between Q-Trackers and TAT-GNS as intracellular optical labels. Figure 4 shows the temporal fluorescence profiles from Q-Tracker (chase 1) and TAT-GNS (chase 3) in MSCs. Both Q-Tracker (red) and TAT-GNS (white) signal decreased overtime but with a slower signal decay rate in the TAT-GNS group. For chase 4, where both Q-Tracker and TAT-GNS were co-incubated with MSCs, only TAT-GNS signal was seen (Figure S1) after 4 studied days. These 3 chase experiments showed superior intracellular retention longevity from TAT-GNS than from Q-Tracker. When Q-Tracker-labeled MSCs and TAT-GNS-labeled MSCs were co-cultured (chase 2), Q-Tracker and TAT-GNS signals co-localized in the same MSC, suggesting a reuptake of the intracellular nanoprobes following their excretion. After 24 hours of coincubation (day 1), each cell type can be roughly distinguished by its predominant fluorescence color. TAT-GNS were easily seen in some Q-Tracker-labeled MSCs (Figure 5A) but not that frequently otherwise (Figure 5B), suggesting a greater reuptake on TAT-GNS. At day 2 and onward, the overall signal intensity dropped creating technical challenges in evaluating labels co-localization. Still the GNS signal predominated (Figure 5C,D). At day 4, only GNS signal could be observed (Figure S2).
Figure 4.
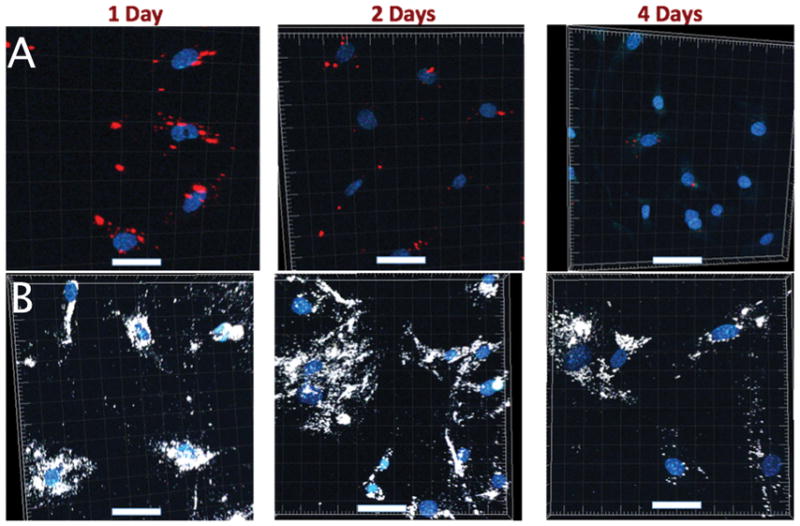
Images from chase 1 (Q-Tracker; A) and chase 3 (TAT-GNS; B). TAT-GNS (white) exhibited greater intracellular retention than Q-Tracker (red) did after 4 days. Scale bars: 50 μm.
Figure 5.
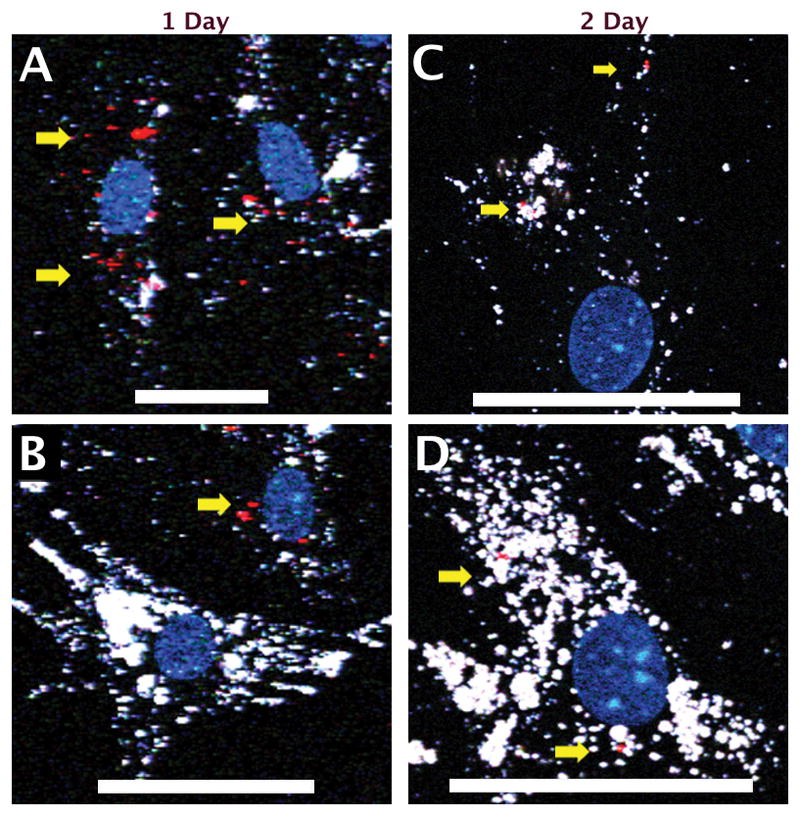
Images from chase 2 (Q-Tracker-labeled MSCs co-culture with TAT-GNS-labeled MSCs). Each cell type could be roughly distinguished by its predominant fluorescence color. Colocalization of Q-Tracker (red dots, yellow arrow) and TAT-GNS (white) could be seen mostly in Q-Tracker-labeled MSCs (cells with more Q-Tracker signal and less GNS signals) but less in TAT-GNS-labeled MSCs (cells with more GNS signals). Scale bars: 50 μm.
The results from chase measurements indicated a superior retention from TAT-GNS than from Q-Tracker in MSCs. This could be due to stronger emission, slower excretion, or greater re-uptake. Since GNS are 1-order brighter than quantum dots,[35] it may allow GNS to be detected after 3 more mitosis cycles than Q-Tracker. Also, since sharp GNS may penetrate endosome and escape to the cytoplasm, the excretion of TAT-GNS may be greatly reduced.[32, 38] Nanoparticle re-uptake, which is most likely facilitated by the surface TAT peptides, provides an additional strategy to maintain the intracellular GNS signal for a longer period in vitro. The actual rate of excretion or re-uptake, however, cannot be easily ascertained in this study. However, it is worth noting that such a re-uptake process may create false localization signal in vivo when released nanoparticles were taken up by surrounding tissues. Q-Tracker, with a smaller size and different surface TAT-peptide coupling, were cleared from tissue quicker hence less false localization. In short, intracellular signal from TAT-GNS was stronger and decayed slower than Q-Tracker but suffered from more non-specific labeling.
The decrease of intracellular TAT-GNS overtime could be attributed to cell division or TAT-GNS excretion. Zhang et al. showed that each mitosis cycle reduces the nanoparticle intracellular concentration in half.[28] In our study at day 8, which is roughly after 4 divisions, there was more than 10-fold decrease in signal intensity under the same excitation laser power (Figure S3). In addition, the cross-over of intracellular TAT-GNS (chase 2 experiment) suggested an excretion process from MSCs. Other potential causes for the TAT-GNS cross-over includes residuals coated on the dish wall, those being released from dead MSCs, or residuals in the growth media when TAT-GNS-labeled MSCs were lifted. Although TAT-GNS had less signal decay than Q-Tracker had, the signal decay still limits the use of our TAT-GNS for short-term (< 1 week) only.
In vivo experiment showed that five days after the injection of TAT-GNS-labeled MSCs, GNS signals were found in the JG regions (Figure 6). Direct injection of the MSCs into the kidney allows MSCs to home and implant in the organ more effectively improving the efficiency of repair. Following the intra-arterial injection, viable MSCs can typically penetrate the glomerular afferent arteriole and migrate to the juxtaglomerular (JG) region to become JG cells.[33] PBS injection control showed no distinct GNS signal (data not shown). GNS clusters were visible near some glomeruli (Figure 6A–C), reflecting the expected migration of TAT-GNS-labeled MSCs to the JG region. Because the JG region can be in any side of the glomerulus, it is easier to find JG regions in the tissue bulk than from multiple slices on histology. Tissue stained with FM 1–43FX (Invitrogen), a membrane dye that also labels the cytoplasm, showed GNS inside the cytoplasm in these cells. However, non-specific labeling was also apparent. GNS were found outside the cytoplasm (Figure S4) in the JG region. Apart from the JG areas, GNS were also found inside the glomeruli and the blood vessels (Figure 6D–F). Inability to remove the large GNS released from MSCs, off-target distribution of GNS became a false localization signal. Although these results indicated the potential use of TAT-GNS as an intracellular label to track MSCs, future design to optimize the tissue clearance is critical for the practical application of nanoparticles.[39]
Figure 6.
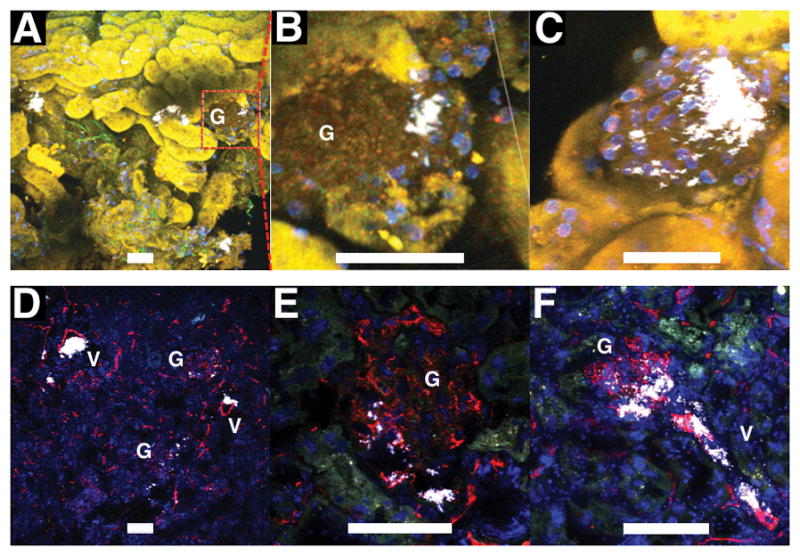
Images from freshly excised half kidney stained with Hoechst 33342 (nuclei; blue) (A–C) and cryosectioned histology stained with CD31 (blood vessels; red) and DAPI (nuclei; blue) (D–F). Mice were injected intra-arterially with TAT-GNS-labeled MSCs and sacrificed 5 days afterwards. In half kidney, GNS (white) could be found inside a cell cluster in the JG region. Zoom-in images of 2 different JG regions (B,C). On histology, GNS were visible near the glomerulus (G), in the glomerulus, and in the afferent arteriole (V). For A–C, images were taken under 1000 nm excitation to visualize renal tubules by their autofluorescence. Scale bars are 50 μm.
Several challenges existed in the practicality of the intracellular labeling technique. Signal dilution upon cell division and particle excretion reduce the MSC detection sensitivity.[3] Intracellular labels can be transferred to the surrounding hence lowers the detection specificity. False localization, especially when using whole body imaging, may occur if not examined carefully under high-resolution imaging. To solve this problem, smaller nanomaterial (< 10 nm) that undergoes renal clearance may exhibit less non-specific retention. Surface chemistry that promotes longer intracellular retention but with minimal excretion or re-uptake can benefit sensitivity. More optimizations are needed to improve the tracking accuracy of intracellular contrast agents to track only viable MSCs or even to monitor the function of MSCs.
Conclusion
This study examined the feasibility of using a plasmonic-active nanoplatform, TAT-GNS, as intracellular contrast agents for tracking MSCs following an intrarenal implantation on mice. TAT peptide-functionalized plasmonic-active star-shaped gold nanoplatform exhibited an intense optical contrast property and enhanced intracellular retention suitable for use in tracking MSCs in mice. In vitro chase experiments showed TAT-GNS outperformed Q-Tracker with superior intracellular stability and detection sensitivity under MPM. In vivo TAT-GNS-labeled MSCs permeated the vascular barrier and possibly migrated towards the JG region 5 days following an intra-arterial implantation in mice kidneys. With a non-specific distribution in glomeruli and blood vessels, further studies are needed to optimize the clearance property to reduce false localization and the specificity of the tracking label. The results of this study indicated that, as compared to Q-Tracker, TAT-GNS may be an interesting alternative cell-tracking tool in providing higher labeling efficiency, improved biocompatibility and greater detection sensitivity for stem cells research and therapy.
Supplementary Material
Acknowledgments
The authors report no conflict of interest. Research conducted in these studies was supported by Duke Exploratory Research Funds (to T.V.D); National Institute of Health RO1 341 EB006201 (to T.V.D); RO1 HL35610, HL81744, HL72010, and HL73219 (to V.J.D.); Edna Madel Foundation (to V.J.D. and M.M.); American Heart Association National Scientist Development Award to M.M. (10SDG4280011). H.Y. and J.A.G. contributed equally to this work.
References
- 1.Hodgkinson CP, Gomez JA, Mirotsou M, Dzau VJ. Hum Gene Ther. 2010;21:1513–26. doi: 10.1089/hum.2010.165. [DOI] [PMC free article] [PubMed] [Google Scholar]
- 2.Shah K. Adv Drug Delivery Rev. 2012;64:739–48. doi: 10.1016/j.addr.2011.06.010. [DOI] [PMC free article] [PubMed] [Google Scholar]
- 3.Gao Y, Cui Y, Chan JK, Xu C. Am J Nucl Med Mol Imaging. 2013;3:232–46. [PMC free article] [PubMed] [Google Scholar]
- 4.Taylor A, Wilson KM, Murray P, Fernig DG, Lévy R. Chem Soc Rev. 2012;41:2707–17. doi: 10.1039/c2cs35031a. [DOI] [PubMed] [Google Scholar]
- 5.Ruggiero A, Thorek DLJ, Guenoun J, Krestin GP, Bernsen MR. Eur Radiol. 2012;22:189–204. doi: 10.1007/s00330-011-2190-7. [DOI] [PMC free article] [PubMed] [Google Scholar]
- 6.Himmelreich U, Dresselaers T. Methods. 2009;48:112–24. doi: 10.1016/j.ymeth.2009.03.020. [DOI] [PubMed] [Google Scholar]
- 7.Elias A, Tsourkas A. Hematology Am Soc Hematol Educ Program. 2009:720–6. doi: 10.1182/asheducation-2009.1.720. [DOI] [PubMed] [Google Scholar]
- 8.Sutton EJ, Henning TD, Pichler BJ, Bremer C, Daldrup-Link HE. Eur Radiol. 2008;18:2021–32. doi: 10.1007/s00330-008-0984-z. [DOI] [PubMed] [Google Scholar]
- 9.Turksen K. Imaging and tracking stem cells : methods and protocols. Humana Press; 2013. p. 218. [Google Scholar]
- 10.Pawelczyk E, Arbab AS, Chaudhry A, Balakumaran A, Robey PG, Frank JA. Stem Cells. 2008;26:1366–75. doi: 10.1634/stemcells.2007-0707. [DOI] [PubMed] [Google Scholar]
- 11.Lewin M, Carlesso N, Tung CH, Tang XW, Cory D, Scadden DT, Weissleder R. Nat Biotechnol. 2000;18:410–4. doi: 10.1038/74464. [DOI] [PubMed] [Google Scholar]
- 12.Muller-Borer BJ, Collins MC, Gunst PR, Cascio WE, Kypson AP. J Nanobiotechnology. 2007;5:9. doi: 10.1186/1477-3155-5-9. [DOI] [PMC free article] [PubMed] [Google Scholar]
- 13.Ferreira L, Karp JM, Nobre L, Langer R. Cell Stem Cell. 2008;3:136–46. doi: 10.1016/j.stem.2008.07.020. [DOI] [PubMed] [Google Scholar]
- 14.Hsiao J-K, Tsai C-P, Chung T-H, Hung Y, Yao M, Liu H-M, Mou C-Y, Yang C-S, Chen Y-C, Huang D-M. Small. 2008;4:1445–52. doi: 10.1002/smll.200701316. [DOI] [PubMed] [Google Scholar]
- 15.Solanki A, Kim JD, Lee K-B. Nanomedicine. 2008;3:567–78. doi: 10.2217/17435889.3.4.567. [DOI] [PubMed] [Google Scholar]
- 16.Jokerst JV, Thangaraj M, Kempen PJ, Sinclair R, Gambhir SS. ACS Nano. 2012;6:5920–30. doi: 10.1021/nn302042y. [DOI] [PMC free article] [PubMed] [Google Scholar]
- 17.Wang J, Najjar A, Zhang S, Rabinovich B, Willerson JT, Gelovani JG, Yeh ETH. Circ Cardiovasc Imaging. 2012;5:94–101. doi: 10.1161/CIRCIMAGING.111.966424. [DOI] [PMC free article] [PubMed] [Google Scholar]
- 18.Vo-Dinh T, Fales AM, Griffin GD, Khoury CG, Liu Y, Ngo H, Norton SJ, Register JK, Wang H-N, Yuan H. Nanoscale. 2013;5:10127–40. doi: 10.1039/c3nr03633b. [DOI] [PMC free article] [PubMed] [Google Scholar]
- 19.Villa C, Erratico S, Razini P, Fiori F, Rustichelli F, Torrente Y, Belicchi M. Int J Mol Sci. 2010;11:1070–81. doi: 10.3390/ijms11031070. [DOI] [PMC free article] [PubMed] [Google Scholar]
- 20.Bhaskar S, Tian F, Stoeger T, Kreyling W, de la Fuente JM, Grazú V, Borm P, Estrada G, Ntziachristos V, Razansky D. Part Fibre Toxicol. 2010;7:3. doi: 10.1186/1743-8977-7-3. [DOI] [PMC free article] [PubMed] [Google Scholar]
- 21.Liu Y, Chang Z, Yuan H, Fales AM, Vo-Dinh T. Nanoscale. 2013;5:12126–31. doi: 10.1039/c3nr03762b. [DOI] [PubMed] [Google Scholar]
- 22.Liu Y, Ashton JR, Moding EJ, Yuan H, Register JK, Fales AM, Choi J, Whitley MJ, Zhao X, Qi Y, Ma Y, Vaidyanathan G, Zalutsky MR, Kirsch DG, Badea CT, Vo-Dinh T. Theranostics. 2015;5:940–60. doi: 10.7150/thno.11974. [DOI] [PMC free article] [PubMed] [Google Scholar]
- 23.Yuan H, Khoury CG, Wilson CM, Grant GA, Bennett AJ, Vo-Dinh T. Nanomedicine: NBM. 2012;8:1355–63. doi: 10.1016/j.nano.2012.02.005. [DOI] [PMC free article] [PubMed] [Google Scholar]
- 24.Yuan H, Register JK, Wang H-N, Fales AM, Liu Y, Vo-Dinh T. Anal Bioanal Chem. 2013;405:6165–80. doi: 10.1007/s00216-013-6975-1. [DOI] [PubMed] [Google Scholar]
- 25.Yuan H, Wilson C, Xia J, Doyle S, Li S, Fales A, Liu Y, Ozaki E, Mulfaul K, Hanna G, Palmer G, Wang LV, Grant G, Vo Dinh T. Nanoscale. 2014;6:4078–82. doi: 10.1039/c3nr06770j. [DOI] [PMC free article] [PubMed] [Google Scholar]
- 26.Kim C, Song H-M, Cai X, Yao J, Wei A, Wang LV. J Mater Chem. 2011;21:2841–4. doi: 10.1039/C0JM04194G. [DOI] [PMC free article] [PubMed] [Google Scholar]
- 27.Cho EC, Zhang Y, Cai X, Moran CM, Wang LV, Xia Y. Angew Chem Int Ed Engl. 2013;52:1152–5. doi: 10.1002/anie.201208096. [DOI] [PMC free article] [PubMed] [Google Scholar]
- 28.Zhang YS, Wang Y, Wang L, Wang Y, Cai X, Zhang C, Wang LV, Xia Y. Theranostics. 2013;3:532–43. doi: 10.7150/thno.5369. [DOI] [PMC free article] [PubMed] [Google Scholar]
- 29.Conde J, Ambrosone A, Sanz V, Hernandez Y, Marchesano V, Tian F, Child H, Berry CC, Ibarra MR, Baptista PV, Tortiglione C, de la Fuente JM. ACS Nano. 2012;6:8316–24. doi: 10.1021/nn3030223. [DOI] [PubMed] [Google Scholar]
- 30.Berry CC, de la Fuente JM, Mullin M, Chu SWL, Curtis ASG. IEEE Trans Nanobioscience. 2007;6:262–9. doi: 10.1109/tnb.2007.908973. [DOI] [PubMed] [Google Scholar]
- 31.de la Fuente JM, Berry CC. Bioconjugate Chem. 2005;16:1176–80. doi: 10.1021/bc050033+. [DOI] [PubMed] [Google Scholar]
- 32.Yuan H, Fales AM, Vo-Dinh T. J Am Chem Soc. 2012;134:11358–61. doi: 10.1021/ja304180y. [DOI] [PMC free article] [PubMed] [Google Scholar]
- 33.Wang H, Gomez JA, Klein S, Zhang Z, Seidler B, Yang Y, Schmeckpeper J, Zhang L, Muramoto GG, Chute J, Pratt RE, Saur D, Mirotsou M, Dzau VJ. J Am Soc Nephrol. 2013;24:1263–73. doi: 10.1681/ASN.2012060596. [DOI] [PMC free article] [PubMed] [Google Scholar]
- 34.Ranjbarvaziri S, Kiani S, Akhlaghi A, Vosough A, Baharvand H, Aghdami N. Biomaterials. 2011;32:5195–205. doi: 10.1016/j.biomaterials.2011.04.004. [DOI] [PubMed] [Google Scholar]
- 35.Yuan H, Khoury CG, Hwang H, Wilson CM, Grant GA, Vo-Dinh T. Nanotechnology. 2012;23:075102. doi: 10.1088/0957-4484/23/7/075102. [DOI] [PMC free article] [PubMed] [Google Scholar]
- 36.Li JaEJ, Kawazoe N, Chen G. Biomaterials. 2015;54:226–36. doi: 10.1016/j.biomaterials.2015.03.001. [DOI] [PubMed] [Google Scholar]
- 37.Mironava T, Hadjiargyrou M, Simon M, Rafailovich MH. Nanotoxicology. 2013;8:189–201. doi: 10.3109/17435390.2013.769128. [DOI] [PubMed] [Google Scholar]
- 38.Chu Z, Zhang S, Zhang B, Zhang C, Fang CY, Rehor I, Cigler P, Chang HC, Lin G, Liu R, Li Q. Sci Rep. 2014;4:4495. doi: 10.1038/srep04495. [DOI] [PMC free article] [PubMed] [Google Scholar]
- 39.Longmire M, Choyke PL, Kobayashi H. Nanomedicine. 2008;3:703–17. doi: 10.2217/17435889.3.5.703. [DOI] [PMC free article] [PubMed] [Google Scholar]
Associated Data
This section collects any data citations, data availability statements, or supplementary materials included in this article.


