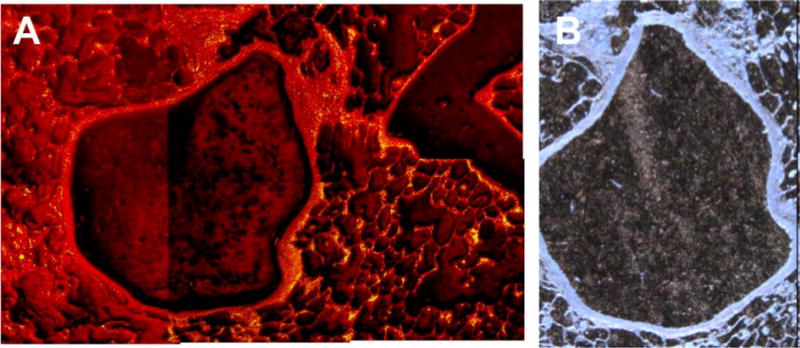
Fig. 4.

Detection of CeO2 particle clusters in lung tissue. (A): Time-of-flight secondary ion mass spectrometry image (1.5 mm × 1 mm) of a deparaffinated lung tissue slice from rats previously exposed to cerium dioxide aerosol (25 mg/m3) for 28 days. The total ion spectrum is displayed; yellow dots, signals of the CeO+ ion are representing CeO2 particles. (B) Corresponding light microscopy image of A (0.75 mm × 1 mm) (Jungnickel, unpublished).
