

Abstract
Many theories of cognitive aging are based on evidence that dopamine (DA) declines with age. Here we performed a systematic meta-analysis of cross-sectional PET and SPECT studies on the average effects of age on distinct DA targets (receptors, transporters, or relevant enzymes) in healthy adults (N=95 studies including 2,611 subjects). Results revealed significant moderate to large, negative effects of age on DA transporters and receptors. Age had a significantly larger effect on D1- than D2-like receptors. In contrast, there was no significant effect of age on DA synthesis capacity. The average age reductions across the DA system were 3.7–14.0% per decade. A meta-regression found only DA target as a significant moderator of the age effect. This study precisely quantifies prior claims of reduced DA functionality with age. It also identifies presynaptic mechanisms (spared synthesis capacity and reduced DA transporters) that may partially account for previously unexplained phenomena whereby older adults appear to use dopaminergic resources effectively. Recommendations for future studies including minimum required samples sizes are provided.
Keywords: Meta-analysis, Healthy aging, Dopamine, Receptors, Transporters, Synthesis capacity
1. Introduction
Positron emission tomography (PET) and single-photon emission computed tomography (SPECT) have been used for over 30 years to assess adult age differences in the dopamine (DA) system (Jagust and D’Esposito, 2009; Kessler, 2003). Selective summaries of the literature estimate that the DA system declines at around 5–10% per decade across adulthood (Bäckman et al., 2010; Bäckman and Farde, 2001; Eppinger et al., 2011; Kaasinen and Rinne, 2002; Li et al., 2009). These qualitative estimates are approximately consistent with non-human animal and human post-mortem studies (Hoekzema et al., 2010; Ingram et al., 2001; Kish et al., 1995; Madras et al., 1998; Morris et al., 1999). However, there are often overlooked inconsistencies in the size of the age effects across different components of the DA system (e.g., receptor subtypes, transporters, synthesis capacity) and brain regions.
The majority of empirical studies estimate age effects as a linear correlation between age and DA targets (receptors, transporters, or relevant enzymes) in the two main destinations of DA pathways, the striatum and frontal cortex. The few studies examining D1-like receptors report large, negative age effects in striatal (Bäckman et al., 2011; Suhara et al., 1992) and frontal regions (Ouchi et al., 1999). The majority of studies have focused on D2-like receptors and have reported wide ranging estimates of the age effect from slightly negative to strongly negative effects (Ichise et al., 1998; Inoue et al., 2001; Laulumaa et al., 1993; Maziére et al., 1985; Nadeau et al., 1995). Age effects on striatal DA transporters are also variable ranging from small to large negative effects (Seibyl et al., 1996; Tiihonen et al., 1997). The largest inconsistencies are apparent in studies investigating synthesis capacity. A similar number of studies report positive effects of age (Braskie et al., 2008; Dreher et al., 2008) and negative effects of age (Kumakura et al., 2010; Ota et al., 2006).
Variation in decline between brain regions (Kumakura et al., 2010), gender (Wong et al., 2012), and tracer differences (Wong et al., 1997) have been suggested as potential sources of the inconsistencies in the published literature, but these moderators have not been systematically tested across studies. In the broader literature on structural brain changes some have suggested that there are larger age-related volume declines (Hedden and Gabrieli, 2004) and steeper rates of decline for frontal regions compared to striatal regions (Bäckman et al., 2011; Kumakura et al., 2010; Ota et al., 2006). However, other studies find similar rates of decline in frontal and striatal regions (Raz et al., 2005; Raz and Rodrigue, 2006). Another explanation for the variability of previously reported age effects are low sample sizes and hence, low statistical power. This is likely due to the high monetary cost of molecular imaging and the desire to limit radiation exposure in healthy volunteers for research purposes. Meta-analysis is the ideal tool to comprehensively assess adult age effects across these low-powered individual studies over the past few decades.
In the present study, we conducted a systematic meta-analysis of all previous cross-sectional PET and SPECT studies of adult age effects on different dopaminergic targets i) D1- and D2-like receptors (hereafter referred to as D1 and D2 receptors), ii) DA transporters (DAT), and iii) DA synthesis capacity. Additionally, we used meta-regression to examine potential moderators of the observed inconsistencies between studies (e.g., target, brain region, sex, age range, radionuclide, imaging method). We expected to observe moderate to large negative effects of age on D1 and D2 receptors and DA transporters (Li et al., 2009). For DA synthesis capacity, we hypothesized a non-significant effect of age, since previous findings have been inconsistent, ranging from negative to positive. Given the mixed results in the literature on differential age effects across brain regions and targets, we did not make directional predictions for any of the potential moderators.
2. Methods
2.1 Literature search
The literature search profited from a pre-existing corpus of 45 PET and SPECT imaging papers of aging and DA function (from the personal library of GRSL). We used this corpus to identify database search terms that would return these studies in addition to other relevant studies in the literature. We restricted our search to PubMed, the largest biomedical and life science database of journal articles and books. In the PubMed database each paper is associated with several U.S. National Library of Medicine Medical Subject Heading (MeSH) terms to describe aspects of a paper including methods, subjects, main effect, and other important characteristics in a consistent and uniform way (Lipscomp, 2000). The most frequent MeSH terms associated with the papers in the initial study corpus were combined to design a systematic search for additional papers for our meta-analysis. It was determined that the terms “aging OR aged,” “tomography, emission-computed,” and “humans,” as well as the individual DA targets (i.e., D1 receptors, D2 receptors, DAT, synthesis capacity), best described the desired features of the studies we wished to include. Since an initial search with the MeSH term “synthesis capacity” yielded no results, we modified the search terms adding different, specific compounds assessing DA synthesis capacity. Additionally, we checked the references of the included studies for further relevant studies. See Supplementary Methods for full search term list and results of literature search (Supplementary Fig. 1). This exhaustive literature search returned a total of 686 single papers published before 01/03/2017, the date on which we performed the full search. During peer review, a reviewer identified two papers (Cumming et al., 2013; Dagher et al., 2001) that were missed by our search and matched the inclusion criteria that we also included.
Of the papers identified in this keyword search, we included all German or English studies (1) reporting original results, published in a journal accessible through Yale University’s library system, (2) reporting data from a cross-sectional sample of healthy, human adults (> 18 years) with a minimum age range of 25 years (in order to obtain age effect estimates from an at least moderate segment of adulthood), and (3) reporting either a linear correlation between age and a DA-relevant tracer kinetic measure from emission computed tomography during a resting condition or containing sufficient information to calculate this linear correlation (e.g., from data comparing DA-relevant kinetic measures in separate age groups). We excluded studies if a) the radiotracer used was not specifically selective to DA or only selective to one subtype of a receptor family (e.g. PHNO), or b) the sample was a subsample of another included study, or c) primarily consisted of smokers or relatives of Parkinson’s patients. Changes in the DA system have been linked with both smoking nicotine (Adermark et al., 2016; Subramaniyan and Dani, 2015) and genes associated with the DA system in Parkinson’s patients (Warner and Schapira, 2003).
2.2 Data extraction
For each of the eligible studies, we extracted the age effect for each tracer kinetic measure. The term tracer kinetic measure is used to reference different quantitative measures of system functioning like binding potential, distribution volume ratio (Innis et al., 2007), standardized uptake value ratio, uptake rate constant (Dreher et al., 2008), and effective distribution volume (Sossi et al., 2001). All of these measures provide relevant information about the location and distribution of the radioligand across the brain (Innis et al., 2007; Kaasinen and Rinne, 2002; Kumakura et al., 2005) as estimates of the availability of DA receptors, DA transporters, and the activity of enzymes contributing to DA synthesis.
Pearson’s correlation coefficients, r, between age and the PET or SPECT kinetic measure used to assess neurotransmission were obtained (1) directly from a report of r in the study, (2) estimated from the age and kinetic measure for each subject provided in a table or from the extracted data of a digitized graph using Source Forge’s Plot Digitizer (Huwaldt, 2001), or (3) converted from reported group values of young and old adults, which were first transformed into Cohen’s d. In each paper, we extracted the correlation between age and the kinetic measure from three regions of interest: midbrain, striatum (consisting of caudate, putamen, and ventral striatum or nucleus accumbens), and frontal cortex (consisting of frontal gyri, anterior cingulate, and anterior insula). If the correlation coefficient was provided separately for males and females or only for subregions instead of the whole region, these values were averaged equally in weight using Fisher’s z-transform. This has been shown to introduce less estimation bias than a direct averaging of correlation coefficients (Silver and Dunlap, 1987). If a study reported r for several different kinetic measures, we extracted the measure which was recommended as the most accurate by the authors or the most commonly used one across studies. In addition, we extracted the following variables as possible moderators of the age effect: i) DA target, ii) brain region, iii) age range in sample, iv) female percentage in sample, v) imaging method, vi) year of introduction of scanner model, vii) effective resolution of the imaging data, viii) radionuclide, and ix) reference region of the kinetic measure.
Among the total of 688 papers, a final pool of 95 studies with 2,611 individual subjects were considered in the current meta-analyses to assess adult age differences in the DA system (cf. Supplementary Methods for a full reference list). Of the 95 included studies, 64 studies used PET and 31 studies used SPECT imaging. The average sample consisted of 27 subjects with 38% women on average. The average age range was 25 to 75 years (cf. Supplementary Table 1 for further characteristics of the included studies).
2.3 Data analysis
Statistical analyses were carried out in R version 3.2.2 with RStudio (R Core Team, 2013; R Studio Team, 2015) using the metafor package (Viechtbauer, 2010). Because the correlation coefficient r is bound and non-normally distributed, we Fisher’s z-transformed r before running the meta-analysis models to stabilize the variances of the estimates (Viechtbauer, 2010). We applied separate random-effects (RE) meta-analyses for each target to obtain summary correlation coefficients over the included estimates weighted by their sample sizes. In contrast to fixed-effect (FE) models, which assume that one true effect underlies all effect sizes and differences in the effect sizes are only due to random sampling variance (Borenstein et al., 2009), we expected RE models to be more appropriate for our data: The underlying true effect varies between the studies since they are not comparable in many variables (e.g., age range, female percentage, or method used). This variation is assumed to be random, so that the summary effect size can be estimated (Borenstein et al., 2009). Nevertheless, we checked for consistency of the results of both models.
To specify the regional age effects, we calculated the summary r for each target split into regions of interest. If two or more correlation coefficients from the same sample were included in one analysis (e.g., r for several brain regions in the same target), we used a multivariate RE model to allow for correlated sampling errors and/or true effects. All mentioned statistical models were fitted by Restricted Maximum Likelihood estimation.
Although the correlation coefficient provides a standardized measure of the size of the age effect, we also wanted to assess age differences in the DA targets across years or decades of life. This corresponds to an unstandardized regression slope, which was much less often reported in the studies. To quantify differences per decade, we calculated a sample-size weighted average for each target. For this we used reported percent differences per year or computed a consistent measure (unstandardized regression slope of age on kinetic measure divided by the range of kinetic measure) for each study.
We supplemented our analyses by examining the nonlinearity of age effects in different DA targets. For this, we used the ages and kinetic measures that were available for individual subjects provided either in a table or from the extracted data of a digitized graph. Due to different scales, we z-standardized the kinetic measure within each study to make them comparable between studies. We then merged the standardized raw data for each of the four DA targets over frontal and striatal regions (since the age effect did not significantly differ between regions in our previous analyses; see Results). We fitted linear, quadratic, and exponential models and calculated the corresponding slopes, the coefficient of determination, R2, as well as the adjusted R2 for each DA target separately.
Q-statistics and I2 are widely used measures of the amount of heterogeneity in the effect sizes (Borenstein et al., 2009). To identify moderators that might account for potential heterogeneity in effect sizes between studies, we integrated potential moderator variables in a multivariate mixed-effects meta-regression across all effect sizes, while controlling for the fact that some effect sizes stemmed from the same sample. Continuous variables were centered before entering them in the model for easier interpretation and the other variables were categorized (see Supplementary Methods and Supplementary Table 2). Note that the continuous variable “effective resolution of imaging data” had to be categorized into three groups, since the study corpus did not provide more detailed information.
2.4 Publicly available data and code
The data file and analysis code are publicly available on OSF (https://osf.io/6uf82/).
3. Results
3.1 Meta-analysis models
Funnel plots were created to examine potential publication biases. Funnel plots depicting the distribution of effect sizes and corresponding standard error (SE) for each target across all studies in the four examined DA targets are displayed in Supplementary Fig. 2. Studies with small sample size -corresponding to a large standard error - and an effect size close to zero were rare, whereas studies with large sample size were spread approximately symmetrically around the mean effect size. The applied rank correlation tests for funnel plot asymmetry did not indicate any publication bias in the study selection (pD1 = 0.80; pD2 = 0.27; pDAT = 0.49; pSC = 0.94).
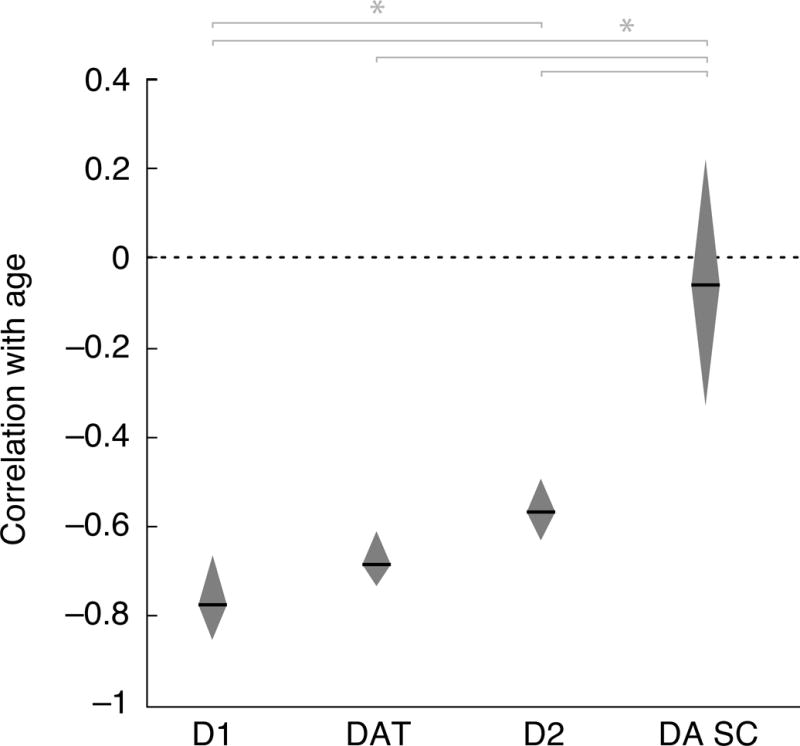
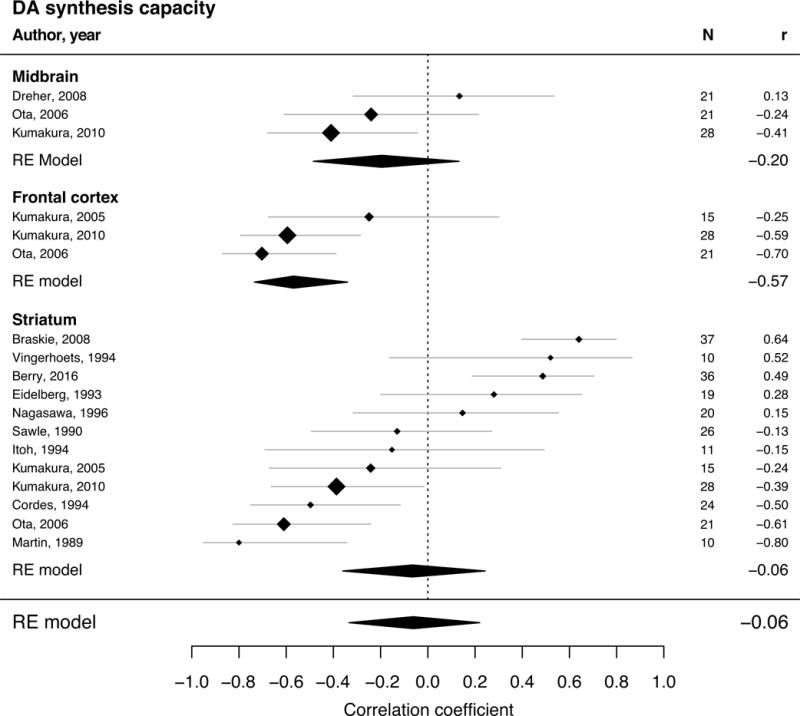
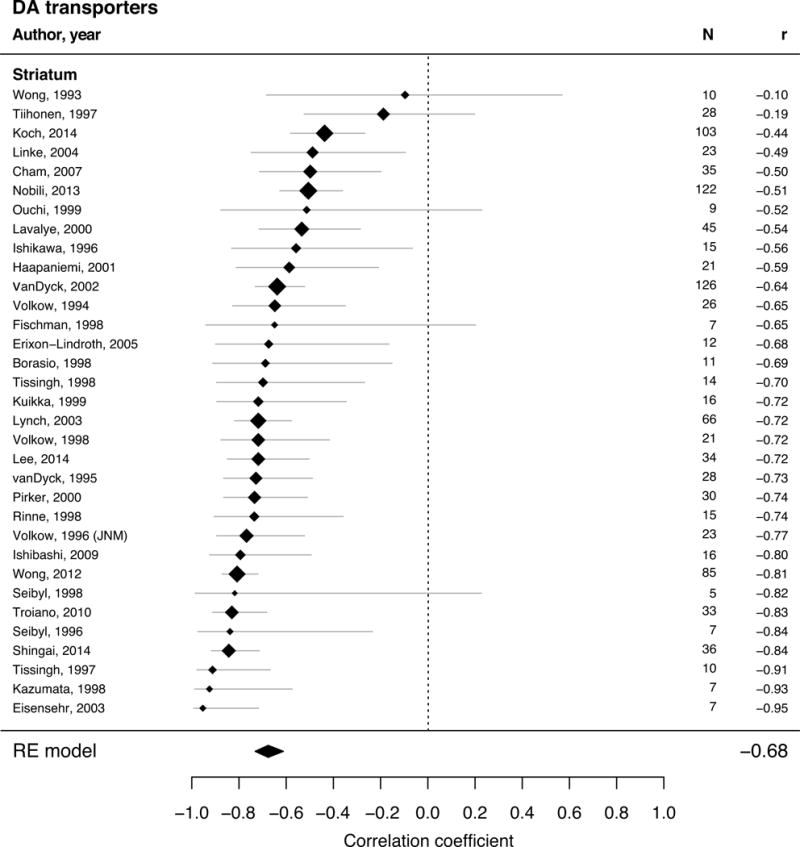
The RE meta-analysis models revealed significant moderate to large, negative mean correlations between age and striatal and frontal cortical DA receptors (rD1 = −0.77; rD2 = −0.56) and striatal DA transporters (r = −0.68) (Fig. 1–3 and Table 1). In contrast, there was a non-significant effect of age on DA synthesis capacity (r = −0.06) across the striatum, frontal cortex, and midbrain (Fig. 4 and Table 1). Figure 5 illustrates differences in summary effect sizes across the DA system comparing their 95% CIs. The negative age effect was significantly larger for D1 than for D2 receptors. The age effect on synthesis capacity was significantly smaller than the age effects on the other targets. Univariate RE models as well as FE models yielded comparable results. Largely overlapping CIs suggested that the age effects within each DA target were comparable across midbrain, striatal, and frontal regions (Table 1). Likewise, an analysis of striatal subregions did not find any differences in age effects between the putamen and caudate (Supplementary Table 3).
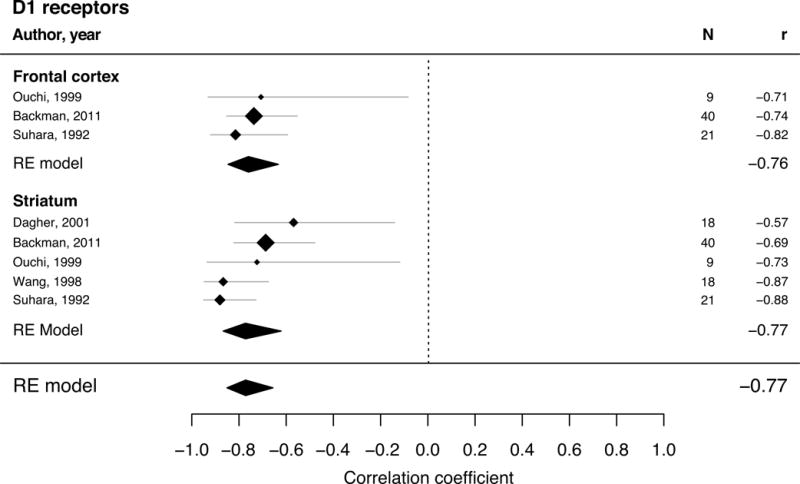
Figure 1.
Forest plot for studies describing adult age differences in D1-like receptors (multivariate REM with 5 studies and 106 individual subjects). The position of the diamond on the x-axis indicates the effect size (Pearson’s correlation coefficient) between age and kinetic measure for each study and its size corresponds to the weight each study had in the analysis. The grey bars indicate the 95% CI of the effect size. The polygons summarize the sample size weighted effect (also for subregions) with its width representing the 95% CI.
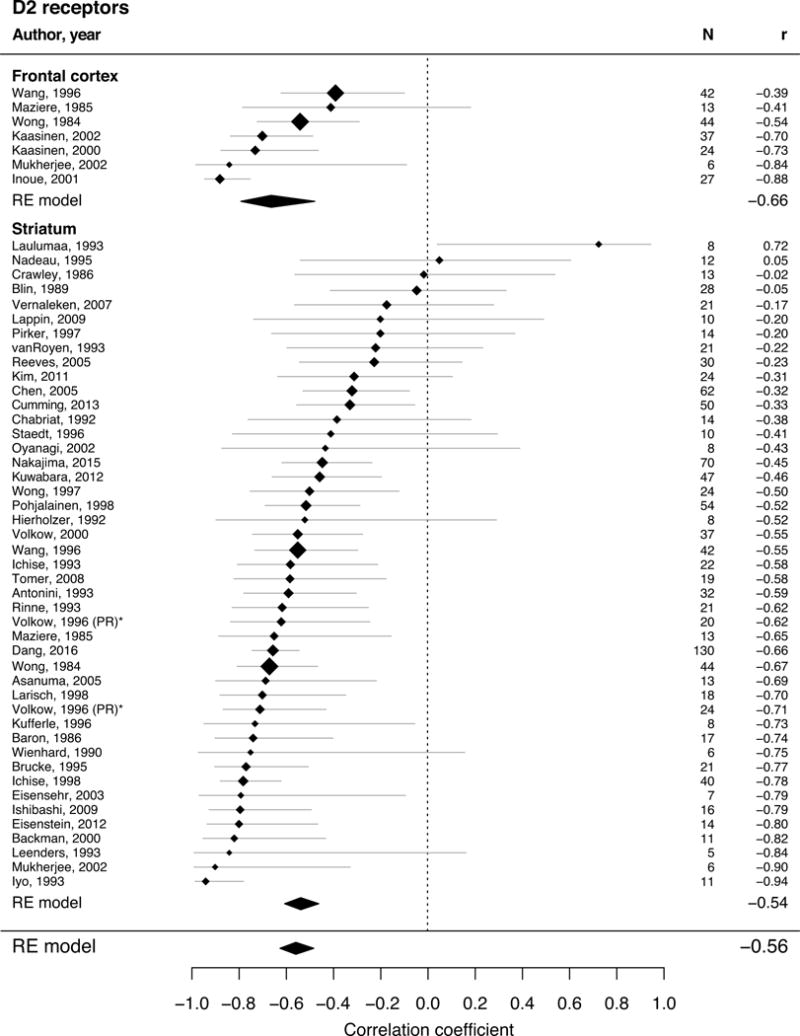
Figure 2.
Forest plot for studies describing adult age differences in D2 receptors (multivariate REM with 47 studies and 1213 single subjects). The position of the diamond on the x-axis indicates the effect size (Pearson’s correlation coefficient) between age and kinetic measure for each study and its size corresponds to the weight each study had in the analysis. The grey bars indicate the 95% CI of the effect size. The polygons summarize the sample size weighted effect (also for subregions) with its width representing the 95% CI.
Figure 3.
Forest plot for studies describing adult age differences in DA transporter (univariate REM with 33 studies and 1046 single subjects). The position of the diamond on the x-axis indicates the effect size (Pearson’s correlation coefficient) between age and kinetic measure for each study and its size corresponds to the weight each study had in the analysis. The grey bars indicate the 95% CI of the effect size. The polygons summarize the sample size weighted effect (also for subregions) with its width representing the 95% CI.
Table 1.
Results of meta-analyses for age effects on DA D1-like receptors, D2-like receptors, transporters (DAT), and synthesis capacity (SC).
| Target | r | 95% CI | # studies | # subjects |
|---|---|---|---|---|
| D1 | −0.77 | [−0.85, −0.66] | 5 | 106 |
| Frontal Cortex | −0.76 | [−0.85, −0.64] | 4 | 70 |
| Striatum | −0.77 | [−0.85, −0.62] | 5 | 106 |
|
| ||||
| D2 | −0.56 | [−0.63, −0.49] | 47 | 1213 |
| Frontal Cortex | −0.66 | [−0.79, −0.48] | 7 | 193 |
| Striatum | −0.54 | [−0.63, −0.49] | 44 | 1125 |
|
| ||||
| DAT | ||||
| Striatum | −0.68 | [−0.73, −0.61] | 33 | 1046 |
|
| ||||
| DA SC | −0.06 | [−0.33, 0.22] | 13 | 278 |
| Midbrain | −0.20 | [−0.48, 0.13] | 3 | 64 |
| Frontal Cortex | −0.57 | [−0.73, −0.34] | 3 | 70 |
| Striatum | −0.06 | [−0.36, 0.24] | 12 | 257 |
Figure 4.
Forest plot for studies describing adult age differences in DA synthesis capacity (multivariate REM with 13 studies and 278 single subjects). The position of the diamond on the x-axis indicates the effect size (Pearson’s correlation coefficient) between age and kinetic measure for each study and its size corresponds to the weight each study had in the analysis. The grey bars indicate the 95% CI of the effect size. The polygons summarize the sample size weighted effect (also for subregions) with its width representing the 95% CI.
Figure 5.
Comparison of average correlations with age (horizontal line within polygon) as well as 95% CIs (polygon height) for DA D1-like receptors, transporters (DAT), D2-like receptors, and synthesis capacity (SC). Dotted line indicates age effect of zero. * significant differences at p < .01 (Cumming, 2009).
The majority of the studies (N = 83) contained enough data to quantify the percentage differences in kinetic measure per decade, which was also sample-size weighted. The observed decline in the kinetic measure over all DA targets was 8.3% per decade ranging from 3.7% in synthesis capacity to 14.0% in D1 receptors (Table 2).
Table 2.
Percentage differences in DA D1-like receptors, D2-like receptors, transporters (DAT), and synthesis capacity (SC) per decade of adulthood.
| Target | Differences per decade in % | # studies | # subjects |
|---|---|---|---|
| D1 | −14.0 | 5 | 106 |
| Frontal Cortex | −14.1 | 3 | 70 |
| Striatum | −12.9 | 5 | 106 |
|
| |||
| D2 | −8.2 | 42 | 1067 |
| Frontal Cortex | −9.3 | 7 | 193 |
| Striatum | −8.0 | 39 | 979 |
|
| |||
| DAT | |||
| Striatum | −8.9 | 29 | 897 |
|
| |||
| DA SC | −3.7 | 10 | 222 |
| Midbrain | −9.3 | 1 | 28 |
| Frontal Cortex | −10.8 | 2 | 49 |
| Striatum | −1.4 | 10 | 222 |
|
| |||
| DA overall | −8.3 | 83 | 2236 |
3.2 Non-linear analysis of individual subject data
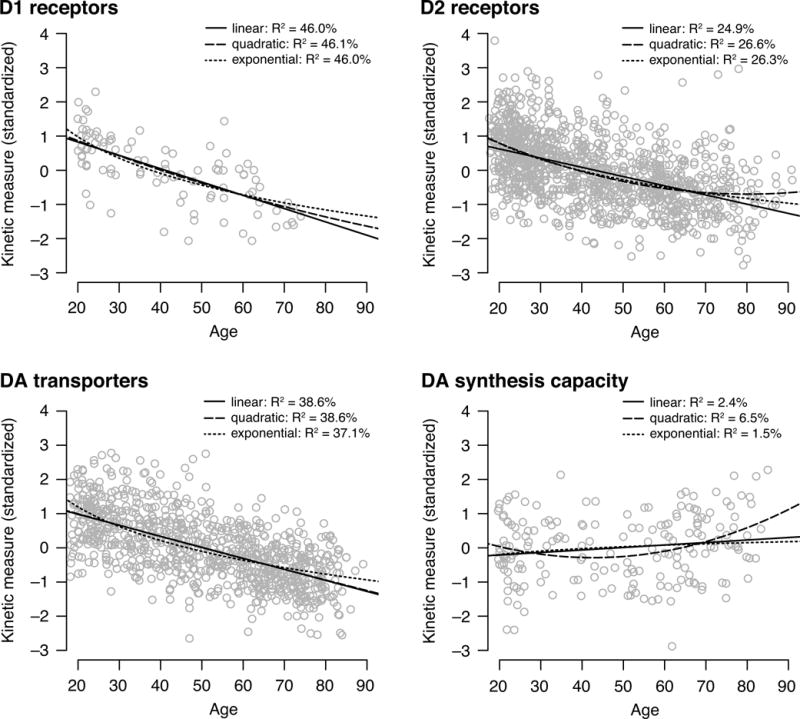
In exploratory analyses, we fit linear, quadratic, and exponential models to the individual subject data from 75 studies (Fig. 6; Supplementary Table 4). The linear model of age explained a significant amount of variance in D1 (Adj. R2 = 46.0%, p < 0.001) and D2 receptors (Adj. R2 = 24.9%, p < 0.001) and DA transporters (Adj. R2 = 38.6%, p < 0.001). In these three DA targets, the quadratic and exponential effects of age explained approximately similar amounts of variance as the linear fits according to adjusted R2 which accounts for model complexity. Although age did not account for much variance in DA synthesis capacity in any of the models, the quadratic function (Adj. R2 = 5.4%) explained more variance than the linear (Adj. R2 = 1.8%) and the exponential function (Adj. R2 = 1.0%).
Figure 6.
Scatterplots depicting the relationship between age and kinetic measure (z-standardized within study) for D1- and D2-like receptors, DA transporters (DAT), and DA synthesis capacity (SC). A linear, a quadratic, and an exponential function were fit to the data.
3.3 Meta-regression model
We used Q-statistics to test the null-hypothesis that all studies are based on the same true effect by comparing the observed between-study variation to the variance within the single studies (Borenstein et al., 2009). Significant Q-statistics in the meta-analysis of D2 receptors (Q = 117.6; p < 0.0001), DA transporters (Q = 73.4; p < 0.001), and synthesis capacity (Q = 88.9; p < 0.0001) suggested that the studies do not share a common true effect size. However, the non-significant Q-statistics in D1 receptors (Q = 7.8; p = 0.352) are not valid evidence for a common true effect within the studies, since this could be also due to the low number of D1 studies (N = 8). The I2 measure also takes into account the expected heterogeneity of the studies (random sampling variance of the effect sizes) and hence, provides the proportion of true heterogeneity in the observed between-studies variance (Borenstein et al., 2009). This proportion was 10.1% in D1 receptors, 56.4% in DA transporters, 56.6% in D2 receptors, and 80.9% in DA synthesis capacity.
To determine the source of the observed heterogeneity, we added potential moderators in a multivariate mixed-effects meta-regression over all correlation coefficients. Supplementary Table 5 presents the results of the meta-regression including 77 of the original 112 correlation coefficients, since studies lacking sufficient moderator information were omitted from the moderator analysis. The model estimated coefficients for centered continuous variables and single factor levels in contrast to their reference level as well as their corresponding standard error and 95% CI. To examine each factor as a whole, we tested the null hypothesis that the coefficients of all factor levels are equal to zero simultaneously. This revealed DA target as the only significant moderator (p < 0.001) with increasingly negative age effects for DA synthesis capacity, D2 receptors, DA transporter, and then D1 receptors. Post-hoc tests assessing differences between single factor levels found a significantly smaller age effect for DA synthesis capacity compared to all other targets (p < 0.001, significant on a Bonferroni corrected level of α = 0.017). The other tested variables did not influence the age effect, but a significant test for residual heterogeneity indicated that other unknown moderators might account for variability in the age effect. To increase the size of included studies and therefore power, we also calculated separate meta-regressions for each individual moderator variable separately. Still, no measure significantly explained the variance in age effects besides DA target.
4. Discussion
We found significant moderate to large, negative age effects on striatal DA transporters and striatal and frontal cortical DA receptors. However, DA synthesis capacity was not significantly correlated with age. The observed age difference per decade in the kinetic measures over all targets ranged between 3.7 and 14.0% and was approximately consistent with estimates of a dopaminergic decline of 5–10% per decade in prior reviews (Kaasinen and Rinne, 2002; Li et al., 2009). Critically, here we provide the first differentiated and precise quantification of age effects across distinct DA targets and brain regions. The evidence for declines in receptors and transporters and potential preservation of synthesis capacity challenges existing theories based on global declines in DA function with age (Braver and Barch, 2002; Li et al., 2001; Nieuwenhuis et al., 2002).
The large negative effects of age on D1 and D2 receptors reveals limitations in the function of the dopaminergic system with age, since transmission of the dopaminergic signal is limited through a smaller number of postsynaptic DA receptors. However, the combination of large losses in DA transporters and the lack of age effects on DA synthesis capacity might together partially compensate for fewer DA receptors at older ages. The observed reduction of DA transporters should lead to a lower reuptake rate of DA into the presynaptic neuron. Hence, DA may remain active in the synaptic cleft for a prolonged time interval and may be able to modulate signal transmission for a lengthier period of time in older age. In fact, others have suggested that up-regulated DA synthesis capacity might act as compensation mechanism for reduced DA receptors (Braskie et al., 2008). If we can assume retained DA synthesis capacity may also be associated with the potential for at least partially spared DA release, this – together with reduced DA transporters – might imply a potentially retained dopaminergic functionality with age. This combined mechanism might account for previously unexplained phenomena whereby older adults appear to use dopaminergic resources effectively, especially in socio-emotional and affective tasks (Samanez-Larkin and Knutson, 2015). A number of studies have shown that age differences in cognitive function are minimized or eliminated when using stimuli that are more personally salient (goal-relevant) and presumably more motivating (e.g., Charles et al., 2003; Gorlick and Maddox, 2015; Mather and Carstensen, 2003; Mikels et al., 2005). There is currently not a neurobiologically-based theoretical account of these findings in part because cognitive aging theories assume global decline of DA functionality.
In highly motivating situations, older adults might be able to enhance DA function through these compensatory mechanisms to achieve higher cognitive performance. However, studies have also revealed that spared or even upregulated synthesis capacity in older age can be associated with worse cognition (Braskie et al., 2008), perhaps because this measure is providing an indirect measure of losses elsewhere in the DA system.
It should be emphasized that there was great heterogeneity in age effects on synthesis capacity as indicated in the large confidence interval of the summary effect (95% CI = [−0.33; 0.22]). Although the point estimate suggests the lack of an effect, age effect sizes ranged from negative to positive. Some of this variance may be due to differences between studies in tracers and the estimated kinetic measures (Braskie et al, 2008; Kumakura and Cumming, 2009). Both studies using the tracer FMT reported positive age effects, but the majority of the studies used FDOPA and reported both positive and negative effects. Some have argued that FMT provides a purer measure of DA synthesis since measurement of FDOPA signal is more affected by postrelease metabolism (Braskie et al 2008), so the true age effect may in fact be positive. A limitation of this meta-analytic study is that we were underpowered to precisely examine how different tracers or kinetic measures (e.g., BP, Ki, DVR, SUV) impacted the results for an individual target (see Supplementary Discussion).
Importantly, the synthesis capacity tracers only measure aspects of conversion of DOPA to DA. Downstream DA release depends on packaging into vesicles and trafficking (Walker and Rodda, 2011). Very few studies provide information about age effects on vesicular storage (Bohnen et al., 2006; Frey et al., 1996; Lin et al., 2013) and there is no tracer to measure trafficking, per se. Some of these vesicular processes may decline with age even if synthesis does not (Kumakura et al., 2005, 2010). Potential age differences in these mechanisms and the lack of data on age differences in DA release (e.g., using dual-scan protocols with administration of methylphenidate or amphetamine) are important qualifiers to the view raised above that spared synthesis may facilitate spared DA release in some contexts in old age. Further studies are needed to examine if spared DA synthesis capacity is associated with spared DA release and if spared DA release in combination with reduced DA transporters acts as a compensatory mechanism for cognition in older age. These potential age-related compensatory mechanisms may require qualification of claims of global declines in the DA system, which are the foundation of many theories of cognitive aging (Braver and Barch, 2002; Li et al., 2001; Nieuwenhuis et al., 2002).
The mean correlation with age differed significantly between D1 and D2 receptors in striatum and frontal cortex. These findings may imply a stronger age-related decline in the maintenance compared to the updating function of working memory (Seamans and Yang, 2004). However, Braver and Barch (2002) have proposed the opposite effect although their theory is based more on phasic and tonic DA changes than specific receptor subtypes. Another possibility is that this differential decline explains age differences across different forms of memory. The findings are consistent with evidence that working memory and cognitive control might decline faster with age than episodic memory (Erixon-Lindroth et al., 2005), which have been associated with D1-receptor-mediated processes (Liggins, 2009) and D2-receptor-mediated processes (Nyberg et al., 2016), respectively. Future studies should examine the cognitive consequences of differential decline across receptor subtypes. A weakness of the present meta-analysis is that we did not include cognitive measures given the lack of consistency in use of measures across studies. Only 10 out of 95 studies reported associations with measures of cognitive functions and they spanned several domains such as cognitive control (Lappin et al., 2009), episodic memory (Bäckman et al., 2000), or working memory (Bäckman et al., 2011)).
The meta-regression analysis revealed DA target as the only significant moderator of the age effect. This supports the results from separate meta-analysis models in each target. Yet, we were not able to explain the observed heterogeneity with other potential moderators (e.g., brain regions, gender, age range, or nuclear imaging characteristics). These variables did not significantly moderate the age effects which is inconsistent with prior evidence from individual studies showing less steep decline in women (Pohjalainen et al., 1998; Wong et al., 1984) and steeper declines in frontal than in striatal regions (Bäckman et al., 2011; Kumakura et al., 2010; Ota et al., 2006). However, the results of the meta-regression should be interpreted with caution. Critically, comparisons between targets and regions are somewhat confounded given differential receptor subtype and transporter expression between frontal cortex and striatum. We also used some categorical moderators (like imaging method, reference region of the tracer kinetic measure, or resolution group of the scanner), which may have lacked sensitivity. Additionally, several studies were lacking moderator information, so the meta-regressions likely suffered from a lack of power (cf. Supplementary Discussion for additional limitations and suggestions for variables and methodological details to include in future studies to facilitate meta-analyses).
A limitation of the current results is that they are based exclusively on cross-sectional data. Although the term “age-related decline” is frequently used in this literature, few studies have provided limited longitudinal data from healthy control groups (e.g., Colloby et al., 2005; Jakobson Mo et al., 2013). The estimates of age differences per year or decade reported in the literature and here are based on the assumption that age effects in cross-sectional studies are representative of developmental rather than cohort effects, which has not yet been verified with longitudinal data. This is a major limitation of the current study as well as nearly all of the previous molecular imaging literature. In fact, studies of brain volume find some evidence that longitudinal age effects are even stronger than would be predicted by cross-sectional data (Raz et al., 2003). However, a relatively large longitudinal study is currently being conducted which will provide more causal evidence for age-related effects (Nevalainen et al., 2015).
Another limitation is that our regions of analysis were quite large (i.e., frontal cortex, striatum). Given the previously reported differential age-related atrophy rates within subregions of frontal cortex and striatum (Raz et al., 2010, 2005), and differential connectivity and function (Alexander et al., 1986; Alexander and Crutcher, 1990; Haber and Knutson, 2009) of ventral versus dorsal frontostriatal regions, a comprehensive subanalysis could have provided more specific implications for age differences in DA-mediated cognitive function. Some studies provided data from subregions within frontal cortex or striatum but these data were not reported consistently across studies. We were able to separately analyze age effects in the caudate and putamen within the striatum (Supplementary Table 3), but there was no evidence for differential effects of age between these structures. Given the anatomical ascending connectivity of frontostriatal regions, it would be ideal if future studies reported more functionally relevant ventromedial to dorsolateral frontostriatal subregions (Kish et al., 1992; Kumakura et al., 2010).
All meta-analytic effects reported here are based on linear effects of age. Most studies assume age effects to be linear, but some studies have reported quadratic or exponential effects (Kim et al., 2011; van Dyck et al., 2002) in line with the evidence that decline in many biological systems is more exponential than linear (Crevecoeur, 2001). Previous studies of age-related change in brain volume also reveal many non-linear age effects (Fjell et al., 2009; Raz et al., 2010, 2005). Our exploratory analyses yielded some suggestive evidence for quadratic and exponential age effects in D1 and D2 receptors and DA transporters with steeper declines in earlier adulthood. We found that DA synthesis capacity is fit best by a quadratic rather than a linear function. This could partially account for inconsistencies between prior studies that only compare younger and older adults, although it should be noted that even the best fitting exponential function revealed that very little variance in synthesis capacity is explained by age. Although these assessments of the nonlinearity of effects is potentially interesting, the combination of individual subject data across studies – even after standardization within study – should be interpreted with caution. As scientists become more open about data sharing of single-subject data, future analyses will be able to better characterize these nonlinear effects of age.
The scatterplots also suggest that between-subject variance relative to the mean may slightly increase with age. This has implications for the design of future PET/SPECT studies suggesting that statistical power may be lower in older adult groups. To address this issue in the functional neuroimaging literature, others have suggested that studies comparing younger and older groups should include a larger number of older adults (Samanez-Larkin and D’Esposito, 2008). This may be necessary for PET/SPECT studies as well. Additional recommendations for future studies are provided in the Supplementary Materials.
General limitations of meta-analyses include the dependency on the quality of included studies as well as potential bias due to lower publication rates of non-significant results. Examination of funnel plots (Supplementary Figure 2) did not reveal obvious publication bias. Despite these general limitations, it should be noted that meta-analysis is a particularly useful tool for PET/SPECT imaging studies of the DA system, which typically contain very few subjects per study. The low sample sizes (median N = 21) of the studies analysed here – likely either due to monetary costs of nuclear imaging methods or the fact that the majority of the studies did not focus on a healthy sample but rather used it as a control group – led to widespread low statistical power within most of the included studies. Many studies had fewer than 15 subjects and the vast majority of studies had fewer than 30 subjects. This may not be surprising given that radiochemistry, imaging, and medical personnel costs are typically about $3000–4000 per subject per scan. The average power over all included studies was only 65.4%, with 53.6% of the studies with statistical power below the usually recommended 80% minimum. An additional benefit of meta-analysis is that the weighted summarized effects can be used for sample size calculations for adequately powered future studies.
Using the point estimates from our significant meta-analytic results, the minimum sample sizes required to detect a linear effect of age are relatively small (D1 N = 8, D2 N = 19, DAT N = 12). It is important to note that the average age effects on which these estimates are based may be overestimated given that very few studies controlled for partial volume effects (see Supplementary Discussion). Almost none of the studies in the literature controlled for age-related atrophy, so the reported age effects are a combination of specific DA differences and non-specific age differences in brain volume (Morris et al 1999). Thus, if the true effect sizes are smaller than estimated here, more subjects may be needed to detect simple effects of age for specific DA targets.
After over 30 years of research and 95 published studies, it seems unlikely that a researcher would only be interested in testing the age effect for a specific target. Future studies will be focused more likely on correlations between DA targets and cognitive performance (for which we unfortunately were not able to provide average effects sizes) or interactions between age and other variables (e.g., age by target, age by brain region). For a linear regression model with three predictors (age main effect, other main effect, interaction term), the minimum required sample size is much larger to detect a medium-sized effect (e.g., for f2 = .15, N = 76 which would likely cost well over $250,000 for data collection alone). Making comparisons across targets was relatively simple with meta-analysis, but in a single study (e.g., interaction analysis of differential age slopes) many subjects would be exposed to higher levels of radiation. This highlights the benefit of quantitative meta-analysis to enhance statistical power and minimize human subject risk. Given the common small sample sizes in human PET imaging studies, meta-analysis will remain an essential tool for verifying and quantifying age effects across the adult life span.
At a time when many are raising concerns about the reliability and reproducibility of individual neuroimaging studies (Poldrack et al., 2017), the present results provide an example of how significant advances can be made from the systematic aggregation of incremental findings. The evidence for differential age effects across the human DA system would require extremely high monetary costs and increased radiation exposure in human research participants to comprehensively and reliably assess in a single study. Although it has been well established that DA receptors and transporters decline with age, the evidence for the lack of an age effect on synthesis capacity is highly novel, a significant advance in neuroscience, and would have been difficult to reveal without meta-analysis.
Supplementary Material
Highlights.
Meta-analyses of correlations between age and dopamine function using PET/SPECT
Large negative effect of age on D1-like (r = −.77) and D2-like receptors (r = −.56)
Significantly larger effects of age on D1-like compared to D2-like receptors
Large negative effects of age on transporters (r = −.68)
No correlation between age and dopamine synthesis capacity (r = −0.06)
Acknowledgments
Thanks to Todd Hagen and Casey McLaughlin for technical assistance in the early stages of this project. Thanks for comments on the manuscript and suggestions for improvement from Evan Morris’s lab journal club, Paul Cumming, and Kendra Seaman. TMK was supported by a scholarship from the German National Academic Foundation. GRSL was supported by US National Institute on Aging Pathway to Independence Award R00-AG042596.
Footnotes
Publisher's Disclaimer: This is a PDF file of an unedited manuscript that has been accepted for publication. As a service to our customers we are providing this early version of the manuscript. The manuscript will undergo copyediting, typesetting, and review of the resulting proof before it is published in its final citable form. Please note that during the production process errors may be discovered which could affect the content, and all legal disclaimers that apply to the journal pertain.
Conflict of interest
No authors have any actual or potential conflicts of interest including any financial, personal or other relationships with other people or organizations within three years of beginning the work submitted that could inappropriately influence (bias) their work.
The data contained in the manuscript being submitted have not been previously published, have not been submitted elsewhere and will not be submitted elsewhere while under consideration at Neurobiology of Aging.
All authors have reviewed the contents of the manuscript being submitted, approve of its contents and validate the accuracy of the data.
References
- Adermark L, Morud J, Lotfi A, Danielsson K, Ulenius L, Söderpalm B, Ericson M. Temporal rewiring of striatal circuits initiated by nicotine. Neuropsychopharmacology. 2016 doi: 10.1038/npp.2016.118. [DOI] [PMC free article] [PubMed] [Google Scholar]
- Alexander GE, Crutcher MD. Functional architecture of basal ganglia circuits: neural substrates of parallel processing. Trends Neurosci. 1990;13:266–271. doi: 10.1016/0166-2236(90)90107-l. [DOI] [PubMed] [Google Scholar]
- Alexander GE, DeLong MR, Strick PL. Parallel organization of functionally segregated circuits linking basal ganglia and cortex. Annu Rev Neurosci. 1986;9:357–381. doi: 10.1146/annurev.ne.09.030186.002041. [DOI] [PubMed] [Google Scholar]
- Bäckman L, Farde L. Dopamine and cognitive functioning: Brain imaging findings in Huntington’s disease and normal aging. Scand J Psychol. 2001;42:287–296. doi: 10.1111/1467-9450.00238. [DOI] [PubMed] [Google Scholar]
- Bäckman L, Ginovart N, Dixon RA, Wahlin TBR, Wahlin A, Halldin C, Farde L. Age-related cognitive deficits mediated by changes in the striatal dopamine system. Am J Psychiatry. 2000;157:635–637. doi: 10.1176/ajp.157.4.635. [DOI] [PubMed] [Google Scholar]
- Bäckman L, Karlsson S, Fischer H, Karlsson P, Brehmer Y, Rieckmann A, MacDonald SWS, Farde L, Nyberg L. Dopamine D1 receptors and age differences in brain activation during working memory. Neurobiol Aging. 2011;32:1849–1856. doi: 10.1016/j.neurobiolaging.2009.10.018. [DOI] [PubMed] [Google Scholar]
- Bäckman L, Lindenberger U, Li S, Nyberg L. Linking cognitive aging to alterations in dopamine neurotransmitter functioning: recent data and future avenues. Neurosci Biobehav Rev. 2010;34:670–677. doi: 10.1016/j.neubiorev.2009.12.008. [DOI] [PubMed] [Google Scholar]
- Bohnen NI, Albin RL, Koeppe RA, Wernette KA, Kilbourn MR, Minoshima S, Frey KA. Positron emission tomography of monoaminergic vesicular binding in aging and Parkinson disease. J Cereb Blood Flow Metab. 2006;26:1198–1212. doi: 10.1038/sj.jcbfm.9600276. [DOI] [PubMed] [Google Scholar]
- Borenstein M, Hedges LV, Higgins JPT, Rothstein HR. Introduction to Meta-Analysis. Chistester, We: 2009. [Google Scholar]
- Braskie MN, Wilcox CE, Landau SM, O’Neil JP, Baker SL, Madison CM, Kluth JT, Jagust WJ. Relationship of striatal dopamine synthesis capacity to age and cognition. J Neurosci. 2008;28:14320–14328. doi: 10.1523/JNEUROSCI.3729-08.2008. [DOI] [PMC free article] [PubMed] [Google Scholar]
- Braver TS, Barch DM. A theory of cognitive control, aging cognition, and neuromodulation. Neurosci Biobehav Rev. 2002;26:809–817. doi: 10.1016/s0149-7634(02)00067-2. [DOI] [PubMed] [Google Scholar]
- Charles ST, Mather M, Carstensen LL. Aging and emotional memory: the forgettable nature of negative images for older adults. J Exp Psychol. 2003;132:310–324. doi: 10.1037/0096-3445.132.2.310. [DOI] [PubMed] [Google Scholar]
- Colloby SJ, Williams ED, Burn DJ, Lloyd JJ, McKeith IG, O’Brien JT. Progression of dopaminergic degeneration in dementia with Lewy bodies and Parkinson’s disease with and without dementia assessed using 123I-FP-CIT SPECT. Eur J Nucl Med Mol Imaging. 2005;32:1176–1185. doi: 10.1007/s00259-005-1830-z. [DOI] [PubMed] [Google Scholar]
- Crevecoeur GU. A system approach modelling of the three-stage non-linear kinetics in biological ageing. Mech Ageing Dev. 2001;122:271–290. doi: 10.1016/s0047-6374(00)00233-5. [DOI] [PubMed] [Google Scholar]
- Cumming G. Inference by eye: reading the overlap of independent confidence intervals. Stat Med. 2009;28:205–220. doi: 10.1002/sim.3471. [DOI] [PubMed] [Google Scholar]
- Cumming P, Xiong G, La Fougère C, Rominger A, Bartenstein P, Buchholz HG, Piel M, Rösch F, Gründer G, Vernaleken I. Surrogate markers for cerebral blood flow correlate with [18F]-fallypride binding potential at dopamine D2/3 receptors in human striatum. Synapse. 2013;67:199–203. doi: 10.1002/syn.21630. [DOI] [PubMed] [Google Scholar]
- Dagher A, Bleicher C, Aston JA, Gunn RN, Clarke PB, Cumming P. Reduced dopamine D1 receptor binding in the ventral striatum of cigarette smokers. Synapse. 2001;42:48–53. doi: 10.1002/syn.1098. [DOI] [PubMed] [Google Scholar]
- Dreher JC, Meyer-Lindenberg A, Kohn P, Berman KF. Age-related changes in midbrain dopaminergic regulation of the human reward system. Proc Natl Acad Sci U S A. 2008;105:15106–15111. doi: 10.1073/pnas.0802127105. [DOI] [PMC free article] [PubMed] [Google Scholar]
- Eppinger E, Hämmerer D, Li SC. Neuromodulation of reward-based learning and decision making in human aging. Ann N Y Acad Sci. 2011;1235:1–17. doi: 10.1111/j.1749-6632.2011.06230.x. [DOI] [PMC free article] [PubMed] [Google Scholar]
- Erixon-Lindroth N, Farde L, Robins Wahlin TB, Sovago J, Halldin C, Bäckman L. The role of the striatal dopamine transporter in cognitive aging. Psychiatry Res Neuroimaging. 2005;138:1–12. doi: 10.1016/j.pscychresns.2004.09.005. [DOI] [PubMed] [Google Scholar]
- Fjell AM, Walhovd KB, Fennema-Notestine C, McEvoy LK, Hagler DJ, Holland D, Brewer JB, Dale AM. One-year brain atrophy evident in healthy aging. J Neurosci. 2009;29:15223–31. doi: 10.1523/JNEUROSCI.3252-09.2009. [DOI] [PMC free article] [PubMed] [Google Scholar]
- Frey KA, Koeppe RA, Kilbourn MR, Vander Borght TM, Albin RL, Gilman S, Kuhl DE, Borght VT, DE Presynaptic K. Presynaptic monoaminergic vesicles in Parkinson’s disease and normal aging. Ann Neurol. 1996;40:873–884. doi: 10.1002/ana.410400609. [DOI] [PubMed] [Google Scholar]
- Gorlick MA, Maddox WT. Social incentives improve deliberative but not procedural learning in older adults. Front Psychol. 2015;6:1–12. doi: 10.3389/fpsyg.2015.00430. [DOI] [PMC free article] [PubMed] [Google Scholar]
- Haber SN, Knutson B. The reward circuit: linking primate anatomy and human imaging. Neuropsychopharmacology. 2009;35:4–26. doi: 10.1038/npp.2009.129. [DOI] [PMC free article] [PubMed] [Google Scholar]
- Hedden T, Gabrieli JDE. Insights into the ageing mind: A view from cognitive neuroscience. Nat Rev Neurosci. 2004;5:87–96. doi: 10.1038/nrn1323. [DOI] [PubMed] [Google Scholar]
- Hoekzema E, Herance R, Rojas S, Pareto D, Abad S, Jiménez X, Figueiras FP, Popota F, Ruiz A, Torrent E, Fernandez-Soriano FJ, Rocha M, Rovira M, Victor VM, Gispert JD. The effects of aging on dopaminergic neurotransmission: A microPET study of [11C]-raclopride binding in the aged rodent brain. Neuroscience. 2010;171:1283–1286. doi: 10.1016/j.neuroscience.2010.10.012. [DOI] [PubMed] [Google Scholar]
- Huwaldt JA. Plot Digitzer (Version 2.6.6) 2001 Retrieved from http://plotdigitizer.sourceforge.net.
- Ichise M, Ballinger JR, Tanaka F, Moscovitch M, St George-Hyslop PH, Raphael D, Freedman M. Age-related changes in D2 receptor binding with iodine-123-iodobenzofuran SPECT. J Nucl Med. 1998;39:1511–1518. [PubMed] [Google Scholar]
- Ingram DK, Chefer S, Matochik J, Moscrip TD, Weed J, Roth GS, London ED, Lane MA. Aging and caloric restriction in nonhuman primates - Behavioral and in vivo brain imaging studies. Heal Aging Funct Longev. 2001;928:316–326. doi: 10.1111/j.1749-6632.2001.tb05661.x. [DOI] [PubMed] [Google Scholar]
- Innis RB, Cunningham VJ, Delforge J, Fujita M, Gjedde A, Gunn RN, Holden J, Houle S, Huang SC, Ichise M, Iida H, Ito H, Kimura Y, Koeppe RA, Knudsen GM, Knuuti J, Lammertsma AA, Laruelle M, Logan J, Maguire RP, Mintun MA, Morris ED, Wong DF, Parsey R, Price JC, Slifstein M, Sossi V, Suhara T, Votaw JR, Wong DF, Carson RE. Consensus nomenclature for in vivo imaging of reversibly binding radioligands. J Cereb Blood Flow Metab. 2007;27:1533–1539. doi: 10.1038/sj.jcbfm.9600493. [DOI] [PubMed] [Google Scholar]
- Inoue M, Suhara T, Sudo Y, Okubo Y, Yasuno F, Kishimoto T, Yoshikawa K, Tanada S. Age-related reduction of extrastriatal dopamine D2 receptor measured by PET. Life Sci. 2001;69:1079–1084. doi: 10.1016/s0024-3205(01)01205-x. [DOI] [PubMed] [Google Scholar]
- Jagust WJ, D’Esposito M. Imaging the aging brain. Oxford University Press; 2009. [Google Scholar]
- Jakobson Mo S, Linder J, Forsgren L, Holmberg H, Larsson A, Riklund K. Pre- and postsynaptic dopamine SPECT in idiopathic parkinsonian diseases: a follow-up study. Biomed Res Int. 2013;2013:1–14. doi: 10.1155/2013/143532. [DOI] [PMC free article] [PubMed] [Google Scholar]
- Kaasinen V, Rinne JO. Functional imaging studies of dopamine system and cognition in normal aging and Parkinson’s disease. Neurosci Biobehav Rev. 2002;26:785–793. doi: 10.1016/s0149-7634(02)00065-9. [DOI] [PubMed] [Google Scholar]
- Kessler RM. Imaging methods for evaluating brain function in man. Neurobiol Aging. 2003;24(Suppl 1):S21–S35. doi: 10.1016/s0197-4580(03)00047-2. [DOI] [PubMed] [Google Scholar]
- Kim JH, Son YD, Kim HK, Lee SY, Cho SE, Kim YB, Cho ZH. Effects of age on dopamine D2 receptor availability in striatal subdivisions: a high-resolution positron emission tomography study. Eur Neuropsychopharmacol. 2011;21:885–91. doi: 10.1016/j.euroneuro.2011.03.009. [DOI] [PubMed] [Google Scholar]
- Kish SJ, Shannak K, Rajput A, Deck JHN, Hornykiewicz O. Aging produces a specific pattern of striatal dopamine loss: implications for the etiology of idiopathic Parkinson’s disease. J Neurochem. 1992;58:642–648. doi: 10.1111/j.1471-4159.1992.tb09766.x. [DOI] [PubMed] [Google Scholar]
- Kish SJ, Zhong XH, Hornykiewicz O, Haycock JW. Striatal 3,4-dihydroxyphenylalanine descarboxylase in aging: disparity between postmortem and positron emission tomography studies? Ann Neurol. 1995;38:260–264. doi: 10.1002/ana.410380220. [DOI] [PubMed] [Google Scholar]
- Kumakura Y, Cumming P. PET studies of cerebral levodopa metabolism: a review of clinical findings and modeling approaches. Neurosci. 2009;15:635–650. doi: 10.1177/1073858409338217. [DOI] [PubMed] [Google Scholar]
- Kumakura Y, Vernaleken I, Buchholz HG, Borghammer P, Danielsen E, Gründer G, Heinz A, Bartenstein P, Cumming P. Age-dependent decline of steady state dopamine storage capacity of human brain: An FDOPA PET study. Neurobiol Aging. 2010;31:447–463. doi: 10.1016/j.neurobiolaging.2008.05.005. [DOI] [PubMed] [Google Scholar]
- Kumakura Y, Vernaleken I, Gründer G, Bartenstein P, Gjedde A, Cumming P. PET studies of net blood-brain clearance of FDOPA to human brain: age-dependent decline of [18F]fluorodopamine storage capacity. J Cereb Blood Flow Metab. 2005;25:807–819. doi: 10.1038/sj.jcbfm.9600079. [DOI] [PubMed] [Google Scholar]
- Lappin JM, Reeves SJ, Mehta MA, Egerton A, Coulson M, Grasby PM. Dopamine release in the human striatum: motor and cognitive tasks revisited. J Cereb Blood Flow Metab. 2009;29:554–564. doi: 10.1038/jcbfm.2008.146. [DOI] [PubMed] [Google Scholar]
- Laulumaa V, Kuikka JT, Soininen H. Imaging of D2 dopamine receptors of patients with Parkinson’s disease using single photon emission computed tomography and iodobenzamide 1 123. Arch Neurol. 1993;50:2–4. doi: 10.1001/archneur.1993.00540050059016. [DOI] [PubMed] [Google Scholar]
- Li SC, Lindenberger U, Nyberg L, Heekeren HR, Bäckman L. Dopaminergic modulation of cognition in human aging. Imaging the Aging Brain. 2009:71–91. [Google Scholar]
- Li S, Lindenberger U, Sikström S. Aging cognition: from neuromodulation to representation. Trends Cogn Sci. 2001;5:479–486. doi: 10.1016/s1364-6613(00)01769-1. [DOI] [PubMed] [Google Scholar]
- Liggins JTP. The roles of dopamine D1 and D2 receptors in working memory function. McGill Sci Undergrad Res J. 2009;4:39–45. [Google Scholar]
- Lin KJ, Weng YH, Hsieh CJ, Lin WY, Wey SP, Kung MP, Yen TC, Lu CS, Hsiao IT. Brain imaging of vesicular monoamine transporter type 2 in healthy aging subjects by 18F-FP-(+)-DTBZ PET. PLoS One. 2013;8:1–7. doi: 10.1371/journal.pone.0075952. [DOI] [PMC free article] [PubMed] [Google Scholar]
- Lipscomp CE. Medical Subject Headings (MeSH) Bull Med Libr Assoc. 2000;88:265–266. [PMC free article] [PubMed] [Google Scholar]
- Madras BK, Meltzer PC, Liang AY, Elmaleh DR, Babich J, Fischman AJ. Altropane, a SPECT or PET imaging probe for dopamine neurons: I. transporter binding in primate brain. Synapse. 1998;29:93–104. doi: 10.1002/(SICI)1098-2396(199806)29:2<93::AID-SYN1>3.0.CO;2-5. [DOI] [PubMed] [Google Scholar]
- Mather M, Carstensen LL. Aging and attentional biases for emotional faces. Psychol Sci. 2003;14:409–415. doi: 10.1111/1467-9280.01455. [DOI] [PubMed] [Google Scholar]
- Maziére B, Loch’h C, Baron J-C, Sgouropoulos P, Duquesnoy N, D’Antona R, Cambon H. In vivo quantitative imaging of dopamine receptors in human brain using positron emission tomography and [76Br]Bromospiperone. Eur J Pharmacol. 1985;114:267–272. doi: 10.1016/0014-2999(85)90369-3. [DOI] [PubMed] [Google Scholar]
- Mikels JA, Larkin GR, Reuter-Lorenz PA, Carstensen LL. Divergent trajectories in the aging mind: changes in working memory for affective versus visual information with age. Psychol Aging. 2005;20:542–553. doi: 10.1037/0882-7974.20.4.542. [DOI] [PMC free article] [PubMed] [Google Scholar]
- Morris ED, Chefer SI, Lane MA, Muzic RF, Wong DF, Dannals RF, Matochik JA, Bonab AA, Villemagne VL, Grant SJ, Ingram DK, Roth GS, London ED. Loss of D2 receptor binding with age in rhesus monkeys: importance of correction for differences in striatal size. J Cereb Blood Flow Metab. 1999;19:218–229. doi: 10.1097/00004647-199902000-00013. [DOI] [PubMed] [Google Scholar]
- Nadeau SE, Couch MW, Devane CL, Shukia SS. Regional analysis of D2 dopamine receptors in Parkinson’s disease using SPECT and Iodine-123-Iodobenzamide. J Nucl Med. 1995;36:384–393. [PubMed] [Google Scholar]
- Nevalainen N, Riklund K, Andersson M, Axelsson J, Ögren M, Lövdén M, Lindenberger U, Bäckman L, Nyberg L. COBRA: A prospective multimodal imaging study of dopamine, brain structure and function, and cognition. Brain Res. 2015;1612:83–103. doi: 10.1016/j.brainres.2014.09.010. [DOI] [PubMed] [Google Scholar]
- Nieuwenhuis S, Ridderinkhof KR, Talsma D, Coles MGH, Holroyd CB, Kok A, van der Molen MW. A computational account of altered error processing in older age: dopamine and the error-related negativity. Cogn Affect Behav Neurosci. 2002;2:19–36. doi: 10.3758/cabn.2.1.19. [DOI] [PubMed] [Google Scholar]
- Nyberg L, Karalija N, Salami A, Andersson M, Wåhlin A, Kaboovand N, Köhncke Y, Axelsson J, Rieckmann A, Papenberg G, Garrett DD, Riklund K, Lövdén M, Lindenberger U, Bäckman L. Dopamine D2 receptor availability is linked to hippocampal–caudate functional connectivity and episodic memory. Proc Natl Acad Sci. 2016;113:7918–7923. doi: 10.1073/pnas.1606309113. [DOI] [PMC free article] [PubMed] [Google Scholar]
- Ota M, Yasuno F, Ito H, Seki C, Nozaki S, Asada T, Suhara T. Age-related decline of dopamine synthesis in the living human brain measured by positron emission tomography with L-[β-11C]DOPA. Life Sci. 2006;79:730–736. doi: 10.1016/j.lfs.2006.02.017. [DOI] [PubMed] [Google Scholar]
- Ouchi Y, Kanno T, Okada H, Yoshikawa E, Futatsubashi M, Nobezawa S, Torizuka T, Sakamoto M. Presynaptic and postsynaptic dopaminergic binding densities in the nigrostriatal and mesocortical systems in early Parkinson’s disease: A double-tracer positron emission tomography study. Ann Neurol. 1999;46:723–731. doi: 10.1002/1531-8249(199911)46:5<723::aid-ana7>3.0.co;2-r. [DOI] [PubMed] [Google Scholar]
- Pohjalainen T, Rinne JO, Någren K, Syvälahti E, Hietala J. Sex differences in the striatal dopamine D2 receptor binding characteristics in vivo. Am J Psychiatry. 1998;155:768–773. doi: 10.1176/ajp.155.6.768. [DOI] [PubMed] [Google Scholar]
- Poldrack RA, Baker CI, Durnez J, Gorgolewski KJ, Matthews PM, Munafò MR, Nichols TE, Poline JB, Vul E, Yarkoni T. Scanning the horizon: towards transparent and reproducible neuroimaging research. Nat Rev Neurosci. 2017;18:115–126. doi: 10.1038/nrn.2016.167. [DOI] [PMC free article] [PubMed] [Google Scholar]
- R Core Team. R: A language and environment for statistical computing. Vienna: R Foundation for Statistical Computing; 2013. Retrieved from http://www.R-project.org/ [Google Scholar]
- R Studio Team. RStudio: Integrated Development for R. Boston, MA: RStudio, Inc; 2015. Retrieved from http://www.rstudio.com/ [Google Scholar]
- Raz N, Ghisletta P, Rodrigue KM, Kennedy KM, Lindenberger U. Trajectories of brain aging in middle-aged and older adults: regional and individual differences. Neuroimage. 2010;51:501–511. doi: 10.1016/j.neuroimage.2010.03.020. [DOI] [PMC free article] [PubMed] [Google Scholar]
- Raz N, Lindenberger U, Rodrigue KM, Kennedy KM, Head D, Williamson A, Dahle C, Gerstorf D, Acker JD. Regional brain changes in aging healthy adults: general trends, individual differences and modifiers. Cereb Cortex. 2005;15:1676–1689. doi: 10.1093/cercor/bhi044. [DOI] [PubMed] [Google Scholar]
- Raz N, Rodrigue KM. Differential aging of the brain: patterns, cognitive correlates and modifiers. Neurosci Biobehav Rev. 2006;30:730–748. doi: 10.1016/j.neubiorev.2006.07.001. [DOI] [PMC free article] [PubMed] [Google Scholar]
- Raz N, Rodrigue KM, Kennedy KM, Head D, Gunning-Dixon F, Acker JD. Differential aging of the human striatum: longitudinal evidence. Am J Neuroradiol. 2003;24:1849–1856. [PMC free article] [PubMed] [Google Scholar]
- Samanez-Larkin GR, D’Esposito M. Group comparisons: Imaging the aging brain. Soc Cogn Affect Neurosci. 2008 doi: 10.1093/scan/nsn029. [DOI] [PMC free article] [PubMed] [Google Scholar]
- Samanez-Larkin GR, Knutson B. Decision making in the ageing brain: Changes in affective and motivational circuits. Nat Rev Neurosci. 2015;16:278–289. doi: 10.1038/nrn3917. [DOI] [PMC free article] [PubMed] [Google Scholar]
- Seamans JK, Yang CR. The principal features and mechanisms of dopamine modulation in the prefrontal cortex. Prog Neurobiol. 2004;74:1–57. doi: 10.1016/j.pneurobio.2004.05.006. [DOI] [PubMed] [Google Scholar]
- Seibyl JP, Laruelle M, Van Dyck CH, Wallace E, Baldwin RM, Zoghbi S, Zea-ponce Y, Neumeyer JL, Charney DS, Hoffer PB, Innis RB. Reproducibility of Iodine-123-β-CIT SPECT Brain Measurement of Dopamine Transporters. J Nucl Med. 1996;37:222–228. [PubMed] [Google Scholar]
- Silver NC, Dunlap WP. Averaging correlation coefficients: should Fisher’s z transformation be used? J Appl Psychol. 1987;72:146–148. [Google Scholar]
- Sossi V, Doudet DJ, Holden JE. A reversible tracer analysis approach to the study of effective dopamine turnover. J Cereb Blood Flow Metab. 2001;21:469–476. doi: 10.1097/00004647-200104000-00015. [DOI] [PubMed] [Google Scholar]
- Subramaniyan M, Dani JA. Dopaminergic and cholinergic learning mechanisms in nicotine addiction. Ann N Y Acad Sci. 2015;1349:46–63. doi: 10.1111/nyas.12871. [DOI] [PMC free article] [PubMed] [Google Scholar]
- Suhara T, Nakayama K, Inoue O, Fukuda H, Shimizu M, Mori A, Tateno Y. D1 dopamine receptor binding in mood disorders measured by positron emission tomography. Psychopharmacology (Berl) 1992;106:14–18. doi: 10.1007/BF02253582. [DOI] [PubMed] [Google Scholar]
- Tiihonen J, Kuikka J, Bergström K, Lepola U, Koponen H, Leinonen E. Dopamine reuptake site densities in patients with social phobia. Am J Psychiatry. 1997;154:239–242. doi: 10.1176/ajp.154.2.239. [DOI] [PubMed] [Google Scholar]
- van Dyck CH, Seibyl JP, Malison RT, Laruelle M, Wallace E, Zoghbi SS, Zea-Ponce Y, Baldwin RM, Charney DS, Hoffer PB. Age-related decline in dopamine transporters: Analysis of striatal subregions, nonlinear effects, and hemispheric asymmetries. Am J Psychiatry. 2002;10:36–43. [PubMed] [Google Scholar]
- Viechtbauer W. Conducting meta-analyses in R with the metafor package. J Stat Softw 2010 [Google Scholar]
- Walker Z, Rodda J. Dopaminergic imaging: clinical utility now and in the future. Int Psychogeriatrics. 2011;23:32–40. doi: 10.1017/S1041610211000883. [DOI] [PubMed] [Google Scholar]
- Warner TT, Schapira AHV. Genetic and environmental factors in the cause of Parkinson’s disease. Ann Neurol. 2003;53:61–70. doi: 10.1002/ana.10487. [DOI] [PubMed] [Google Scholar]
- Wong D, Wagner H, Dannals R, Links J, Frost J, Ravert H, Wilson A, Rosenbaum A, Gjedde A, Douglass K, Et A. Effects of age on dopamine and serotonin receptors measured by positron tomography in the living human brain. Science (80−) 1984;226:1393–1396. doi: 10.1126/science.6334363. [DOI] [PubMed] [Google Scholar]
- Wong DF, Young D, Wilson PD, Meltzer CC, Gjedde A. Quantification of neuroreceptors in the living human brain: III. D2-like dopamine receptors: theory, validation, and changes during normal aging. J Cereb Blood Flow Metab. 1997;17:316–330. doi: 10.1097/00004647-199703000-00009. [DOI] [PubMed] [Google Scholar]
- Wong KK, Müller MLTM, Kuwabara H, Studenski SA, Bohnen NI. Gender differences in nigrostriatal dopaminergic innervation are present at young-to-middle but not at older age in normal adults. J Clin Neurosci. 2012;19:183–184. doi: 10.1016/j.jocn.2011.05.013. [DOI] [PubMed] [Google Scholar]
Associated Data
This section collects any data citations, data availability statements, or supplementary materials included in this article.