

Abstract
Anatomical studies conducted in neurological conditions have developed our understanding of the causal relationships between brain lesions and their clinical consequences. The analysis of lesion patterns extended across brain networks has been particularly useful in offering new insights on brain–behavior relationships. Here we applied multiperturbation Shapley value Analysis (MSA), a multivariate method based on coalitional game theory inferring causal regional contributions to specific behavioral outcomes from the characteristic functional deficits after stroke lesions. We established the causal patterns of contributions and interactions of nodes of the attentional orienting network on the basis of lesion and behavioral data from 25 right hemisphere stroke patients tested in visuo‐spatial attention tasks. We calculated the percentage of damaged voxels for five right hemisphere cortical regions contributing to attentional orienting, involving seven specific Brodmann Areas (BA): Frontal Eye Fields, (FEF‐BA6), Intraparietal Sulcus (IPS‐BA7), Inferior Frontal Gyrus (IFG‐BA44/BA45), Temporo‐Parietal Junction (TPJ‐BA39/BA40), and Inferior Occipital Gyrus (IOG‐BA19). We computed the MSA contributions of these seven BAs to three behavioral clinical tests (line bisection, bells cancellation, and letter cancelation). Our analyses indicated IPS as the main contributor to the attentional orienting and also revealed synergistic influences among IPS, TPJ, and IOG (for bells cancellation and line bisection) and between TPJ and IFG (for bells and letter cancellation tasks). The findings demonstrate the ability of the MSA approach to infer plausible causal contributions of relevant right hemisphere sites in poststroke visuo‐spatial attention and awareness disorders. Hum Brain Mapp 38:3454–3471, 2017. © 2017 Wiley Periodicals, Inc.
Keywords: game theory, lesion inference, brain–behavior relationships, visuo‐spatial attention, stroke, neglect, multiperturbation Shapley value analysis (MSA)
INTRODUCTION
One of the overarching goals of research in the cognitive neurosciences is to characterize the causal contributions of specific brain regions to brain functions. Historically, the identification of structures subserving cognitive functions was based on the confrontation of a clinical deficit in neurological patients with the postmortem analysis of lesions present in their brains. In this context, the advent of functional neuroimaging and noninvasive brain stimulation has allowed the characterization of cognitive functions in healthy participants. Notwithstanding, the study of patients with naturally occurring focal lesions, such as those observed in stroke patients, remains highly relevant and keeps providing valuable causal insights on brain and cognition relationships.
Different neuroimaging approaches allow the investigation of brain–behavior relationships in humans presenting cerebral focal lesions. For instance, the maximal lesion overlap approach proposes the substraction of lesion patterns of patients presenting a given functional deficit from lesion patterns of patients without deficit [Karnath et al., 2001; Mort et al., 2003], in the absence of computing further statistics. This approach assumes that voxels found in the maximum lesion overlap correspond to areas contributing to the pathological behavior. Unfortunately, overlap methods fail to distinguish redundantly damaged regions (which happen to be affected by a cerebral injury, but are not involved in the considered functions) from those actually causally contributing to impaired functions, hence mostly reflecting the heterogeneity in shape and distribution of cerebrovascular lesions and their vulnerability to ischemia [Godefroy et al., 1998; Husain and Nachev, 2007]. As an alternative approach, voxel‐based lesion‐symptom mapping (VLSM) [Bates et al., 2003] employs voxel‐based neuroimaging procedures to determine which brain areas have the strongest relation to the scores of a given behavioral or clinical test. A t‐statistic is computed between the scores of patients with or without lesions for each voxel of the brain, highlighting which voxels are most likely associated with a particular deficit. This univariate method has been criticized for a hidden bias displacing inferred critical lesions from their true locations [Mah et al., 2014]. The limitations of these approaches suggest that novel and more adequate multivariate techniques are required to map brain functions. In response to this need, Smith et al. [2013] introduced an inference approach based on machine learning, multivariate pattern analysis (MVPA), that employs linear and nonlinear support vector machines (SVMs) to predict the presence or absence of attentional deficits, such as occurring in spatial neglect, based on brain injury maps. Similarly, Zhang et al. [2014] developed a multivariate lesion symptom mapping approach using a machine learning‐based multivariate regression algorithm and demonstrated its higher sensitivity compared to VLSM for identifying the lesion‐behavior relations, on both synthetic and real datasets.
In contrast to these approaches based on machine learning, multiperturbation Shapley value Analysis (MSA) provides a potential alternative for the analysis of behavioral effects resulting from multilesion patient patterns [Keinan et al., 2004a]. MSA is a rigorous multivariate game‐theory‐based method to infer causal regional contributions from behavioral performance, treating brain regions as interacting players in a coalition game. The approach has already found a wide range of applications in neuroscience [Keinan et al., 2004bb; Kaufman et al., 2009; Zavaglia et al., 2015, Zavaglia & Hilgetag, 2016aa] as well as biochemistry and genetics [Kaufman et al., 2005]. It can also compute redundancy in the functional interactions of the brain as well as synergistic interactions between different brain regions.
In a pilot study, Kaufman et al. [2009] used the MSA method together with a machine learning technique (specifically, a standard K‐nearest neighbor predictor) to analyze in a group of 23 stroke patients the contributions of a set of anatomical regions (CT lesion data) to specific neuropsychological scores. Following this example, we here used a similar approach to infer causal contributions of a set of selected injured sites to visuo‐spatial attentional deficits observed in a cohort of 25 poststroke patients, diagnosed with visuo‐spatial neglect, and presenting, among other issues, a directional bias towards the right side of space when perceiving and acting in their environment [Bartolomeo and Chokron, 1999]. At difference with Kaufman et al. [2009], we used an improved model of prediction to analyze the degree of damage of a set of regions of interest, which were also combined with a larger number of well‐standardized behavioral tasks characterizing visuo‐spatial and attention domains. More specifically, to characterize our dataset, we employed a predictive model built by a support vector machine where the model parameters were chosen to obtain the most accurate and reliable predictions (for details, see Zavaglia et al. [2016b]). By using the MSA approach in this study, we were able to explore brain–behavior relationships at different levels of complexity (including individual positive and negative causal contributions of brain regions, as well as combined contributions reflecting interactions between areas), and quantitatively characterize the distributed cortical network underlying a specific cognitive function, such as spatial attention. The analyses provide multivariate maps of causal contributions and interactions of the involved cortical regions. Moreover, the findings open new perspectives in human brain mapping and neurostimulation projects, aiming to manipulate specific network nodes and induce patterns of activity to facilitate functional restitution in neurological patients.
MATERIALS AND METHODS
Patient Recruitment Demographics and Consent Form
We analyzed anonymized MRI and clinical behavioral data of 25 right‐handed patients (17 men, mean age 55.96 years, SD 10.63, range 35–79), who suffered a first‐time stroke in the right hemisphere and were clinically evaluated in the chronic stage, at 2 or more months following the stroke event. Patients were recruited for a multicentric double blind clinical trial in human chronic stroke patients, ultimately aiming at evaluating the efficacy and safety of repetitive Transcranial Magnetic Stimulation (rTMS) regimes for improving visuo‐spatial neglect (PHRC Regional NEGLECT) and supplemented by cases of the CAC (Center for Cognitive Anatomy) anonymized database at the Pitié‐Salpêtrière‐ICM. Patients provided informed consent according to the local ethics committee regulations (CCP Ile de France IV or Ile de France I).
Table 1 reports the demographic and clinical characteristics of the study cohort. Brain damage constrained to the right hemisphere and right‐handedness assessed by the Edinburgh inventory [Oldfield, 1971] constituted inclusion criteria, whereas the presence of bilateral lesions or a history of neuropsychiatric conditions were exclusion criteria. The mean time of testing after cerebral damage onset was ∼5 months poststroke (212.48 ± 269.01 days, range 64–1434 days).
Table 1.
Demographical and clinical characteristics of the 25 patients included in our analyses
| Patient | Sex, age | Onset of illness (days) | Etiology | Visual field | Line bisection (% deviation) | Bells cancellation (left/right found target, max 15/15) | Letter cancellation (left/right found targets, max 30/30) |
|---|---|---|---|---|---|---|---|
| 1 | M, 59 | 452 | Ischemic | Left extinction | +3.8 | 14/15 | 28/29 |
| 2 | M, 43 | 81 | Ischemic | Left extinction | +18.2 | 11/10 | – |
| 3 | F, 62 | 227 | Ischemic | Normal | −5.6 | 8/11 | 19/29 |
| 4 | M, 55 | 95 | Ischemic | Left extinction | +2.72 | 12/11 | 29/29 |
| 5 | M, 61 | 83 | Ischemic | Left extinction | −4.8 | 14/11 | 29/21 |
| 6 | F, 35 | 118 | Hemorrhagic | Normal | −0.4 | 15/15 | 21/23 |
| 7 | M, 53 | 64 | Ischemic | Normal | – | 15/15 | – |
| 8 | M, 57 | 82 | Ischemic | Normal | −1.8 | 15/10 | 29/30 |
| 9 | M, 41 | 308 | Hemorrhagic | Left hemianopia | +10.4 | 11/13 | 30/30 |
| 10 | M, 37 | 142 | Hemorrhagic | Left hemianopia | +63.6 | – | – |
| 11 | M, 46 | 209 | Ischemic | Normal | +1 | 15/15 | – |
| 12 | F, 68 | 208 | Ischemic | Normal | – | 15/15 | – |
| 13 | F, 66 | 207 | Ischemic | Left extinction | +8.2 | 7/14 | 6/24 |
| 14 | M, 66 | 137 | Ischemic | Normal | −6 | 12/15 | 27/28 |
| 15 | M, 66 | 74 | Hemorrhagic | Normal | +4.7 | 15/13 | – |
| 16 | M, 58 | 187 | Hemorrhagic | Normal | +0.8 | 14/13 | 20/24 |
| 17 | F, 60 | 103 | Hemorrhagic | Left hemianopia | +7.9 | 14/15 | 25/29 |
| 18 | M, 57 | 228 | Hemorrhagic | Left hemianopia | +19.5 | 3/13 | 17/27 |
| 19 | F, 62 | 194 | Hemorrhagic | Left extinction | +2.8 | 12/15 | 10/30 |
| 20 | F, 49 | 150 | Hemorrhagic | Left hemianopia | +38.2 | 0/13 | 6/29 |
| 21 | M, 44 | 1434 | Ischemic | Left hemianopia | +20 | 12/13 | 27/27 |
| 22 | M, 56 | 202 | Ischemic | Left extinction | +6.1 | 14/13 | 30/30 |
| 23 | M, 66 | 151 | Ischemic | Left extinction | −7.4 | 13/13 | 29/30 |
| 24 | F, 79 | 98 | Ischemic | Normal | +3.9 | 11/12 | 30/27 |
| 25 | M, 53 | 78 | Ischemic | Normal | +0.4 | 14/14 | 28/30 |
Positive values indicate rightward shift; negative values indicate leftward shift. “–” indicate missing data.
Neuropsychological Clinical Evaluation Tests
Visual neglect was assessed at 2 or more months after the stroke event with at least one of the following three neuropsychological clinical tests: (a) the line bisection test [Schenkenberg et al., 1980), (b) the bells cancellation test [Gauthier et al., 1989], and (c) the letter cancellation test [Mesulam, 1985]. Generally, the evaluation of the patients included all three tests. Nonetheless, several patients either refused or, given their state of fatigue, felt unable to perform all the tests. Out of 25 patients, 23 completed the line bisection test. The extent of rightward deviation of the indicated midpoint from the actual midpoint was measured. Scores larger than + 6.5 mm (showing a deviation to the right) or smaller than −7.3 mm (showing a deviation to the left) were considered pathological [Rousseaux et al., 2001]. Out of 25 patients, 24 completed the bells cancellation test. The computed score represented the difference between the bells cancelled on the right side (maximum of 15) of the sheet relative to the left side (maximum of 15). Scores larger than two in absolute value were considered pathological [Rousseaux et al., 2001]. The letter cancellation test [Mesulam, 1985] was completed in 19 out of 25 patients. A laterality score was calculated as the number of omitted “A” targets on the right side relative to the left side of the page. For ages above 50 but not higher than 80 years old, the omission of one target in each field was considered normal [Mesulam, 1985]. Consequently, scores larger than two in absolute value were considered pathological.
Previous studies reported specific anatomical correlates for each of the tests used in our study. Pathological deviations in line bisection were linked to lesions in the superior and inferior parietal lobes [Azouvi et al., 2002; Binder et al., 1992; Rorden et al., 2006] and to the disruption of frontoparietal white matter bundles during neurosurgery [Thiebaut de Schotten et al., 2005]. Visual search tasks such as bells and letter cancellation involved predominantly middle and inferior frontal gyri [Binder et al., 1992; Verdon et al., 2010].
Selection of Regions of Interest
Five main regions of interest (ROIs) localized in the right hemisphere were selected for the study, based on their key anatomical role in attention orienting networks, according to prior fMRI or TMS mapping studies investigating the neural basis of attentional function in healthy human participants. These five ROIs comprised: the Frontal Eye Fields (FEF), the Intraparietal Sulcus (IPS), the Inferior Frontal Gyrus (IFG), the Temporo‐Parietal Junction (TPJ), and the Inferior Occipital Gyrus (IOG). The ROIs were associated with corresponding Brodmann Areas (BAs), for which the quantitative analyses were conducted.
The inclusion of the FEF as one of the five ROIs was based on findings from functional magnetic resonance imaging (fMRI) [Corbetta et al., 2008], identifying FEF as part of the dorsal attentional orienting network, as well as findings from noninvasive neurostimulation studies highlighting FEF's ability to enhance the conscious detection of visual stimuli [Chanes et al., 2012, 2013; Chica et al., 2014, Quentin et al., 2015, 2016; see Vernet et al., 2014 for review]. The inclusion of the IPS as a ROI was based on fMRI findings by Kincade et al. [2005], reporting activations of this region when participants oriented their attention endogenously, whereas other studies have emphasized a causal role for this region in both endogenous and exogenous attentional orienting [Chica et al., 2011]. A further included ROI, the temporal–parietal junction (TPJ), is considered part of the ventral attentional network [Corbetta et al., 2008]. This region is recruited for exogenous attentional orienting, only when stimuli are behaviorally relevant for the task at hand [Kincade et al., 2005; Chica et al., 2011]. Moreover, the IFG, another included ROI, is also considered part of the ventral attentional network. This region allows the reorientation of attention to unexpected but task‐relevant events [Corbetta et al., 2008] and contributes also to directing exogenous shifts of attention [Kincade et al., 2005]. Finally, the fifth ROI was the Inferior Occipital Gyrus (IOG), part of a circuit comprising regions of the extrastriate visual cortex that may mark a location [Kincade et al., 2005] and contribute to attentional orienting tasks such as line bisection judgments, involving the estimation of horizontal lengths [Fink et al., 2002; Waberski et al., 2008].
To conduct the MSA analyses described in the sections below, we estimated the percentage of injury in each anatomical region of interest. To this purpose, we considered Talairach coordinates of the activation peaks specific to each anatomical ROI, as reported in previous studies and characterized functionally by methods such as fMRI and TMS. Using a Brodmann template, we then identified the correspondence between the ROIs coordinates and Brodmann areas. These coordinates corresponded either to a single BA, or to two of them when Talairach space coordinates were located at the border between two adjacent BA regions. As a result, seven Brodmann Areas, specifically BA6, BA7, BA39/BA40, BA44/BA45, and BA19, were associated with the five ROIs described above (Table 2).
Table 2.
Brodmann areas (BAs) regions corresponding to each of the five regions of interest and the associated Talairach coordinates (x, y, z)
| Regions | BA | Talairach coordinates | ||
|---|---|---|---|---|
| x | y | z | ||
| FEF | BA6 | 31 | −2 | 47 |
| IFG | BA44/BA45 | 34 | 47 | −4 |
| IPS | BA7 | 16 | −63 | 47 |
| TPJ | BA39/BA40 | 51 | −51 | 26 |
| IOG | BA19 | 46 | −62 | 4 |
FEF, frontal eye field; IFG, inferior frontal gyrus; IPS, intraparietal sulcus; TPJ, temporoparietal junction; IOG, inferior occipital gyrus.
The coordinates of the right frontal eye field (FEF) (x = 31, y = −2, z = 47 in Talairach space) [Paus, 1996] were associated with BA6. This association, which challenges alternative views of the FEF as part of BA8 (see Vernet et al. [2014] for further discussion of this issue) was based on the localization of the human FEF in Talairach coordinates as ventral and rostral to the crossing of the precentral sulcus with the caudal part of the superior frontal sulcus, reported in an influential meta‐analysis [Paus, 1996], and was validated in causal brain stimulation studies [Chanes et al., 2012, 2013; Quentin et al., 2015, 2016, see also Vernet et al. [2014] for a review on FEF localization]. The coordinates of the right intraparietal sulcus (IPS) (Talairach, x = 16, y = −63, z = 47) [Kincade et al., 2005] were localized in BA7. The right temporoparietal junction (TPJ) (Talairach, x = 51, y = −51, z = 26) [Kincade et al., 2005] was identified as part of BA39 and BA40. The right inferior frontal gyrus (IFG) (Talairach, x = 34, y = 47, z = −4) was associated with BA44 and BA45. Finally, the inferior occipital gyrus (IOG) (x = 46, z = −62, z = 4 in Talairach coordinates) was associated with BA19.
Lesion Mask Delineation and Estimation of the Extent of Injuries
MRI scans included high‐resolution T1‐weighted images obtained for each patient on a 3T GE scanner with a standard head signal reception coil. Brain MRI scans included T1 3D anatomical SPGR (spoiled gradient recalled) images (RT [repetition time] = 7164 ms; TE [echo time] = 3124 ms; inversion time = 380 ms; flip angle = 15°; acquisition matrix = [0, 288, 256, 0]; voxel resolution = 0.5 × 0.5 × 1.2 mm3; slice thickness = 1.2 mm; spaces between slices = 1.2 mm).
Lesions masks were delineated and segmented manually on the original 3D T1 images of each patient using MRIcro software [Rorden and Brett, 2000] with a graphic tablet (WACOM Intuos A6) by expert personnel trained in clinical neuroimaging and neuroanatomy (MT). Variable lesion patterns were observed across our cohort of stroke patients; 8 patients (out of 25) presented cortical lesions, whereas 17 patients showed damage that also involved subcortical structures. The mean lesion volume in the tested sample was 66045 mm3. Nine patients presented small focal lesions with a mean volume of 5763 mm3. Anatomical T1 images were normalized using the segment function implemented in the Statistical Parametric Mapping 8 software (SPM8 http://www.fil.ion.ucl.ac.uk/spm/software/spm8/) running in Matlab (Mathworks). Then the inverse transform function was used to transform each ROI into each patient native space. FSL software (http://www.fmrib.ox.ac.uk/fsl/) was used to perform subtraction analyses (on the Brodmann template) to estimate for seven BAs of interest (BA6, BA7, BA39/BA40, BA44/BA45, and BA19, associated respectively to FEF, IPS, TPJ, IFG, and IOG) the percentage of lesioned voxels within each BA (calculated as the absolute number of voxels within each BA that were also part of the lesion mask, divided by the total absolute number of voxels present in each BA, and multiplied by one hundred). Importantly, a further ROI representing the “rest of the brain” (referred to as RB) was added, to take into account the total size of the lesion affecting other regions than those primarily included (i.e., FEF, IPS, TPJ, IFG, and IOG). Thus, the RB ROI was included not to miss potential significant contributions from ROIs not considered in the described set. The percentage of lesioned voxels for the additional ROI was computed as the sum of the absolute lesion volumes for the BAs not considered, divided by the sum of the absolute volumes of these regions.
Multiperturbation Shapley Value Analysis (MSA)
The MSA approach is a rigorous method for assessing causal function localization from multiple perturbation data, based on coalitional game theory [Shapley, 1953]. In general, the system elements (here, the selected seven BAs involved in attentional orienting and the “rest of the brain”) can be seen as players in a coalition game. The coalition of players is represented by the group of BAs which are left intact (uninjured). For each configuration, the performance of the system is measured. Then, the aim of the analysis is to assign values, representing the BAs' contribution to, or importance for, overall (neural) function. The contribution value of a player, formalized as the Shapley value [Shapley, 1953], represents the difference between the worth of coalitions which contain the element and the worth of coalitions which do not contain it.
More formally, in a system composed of elements performing a task, it is possible to define a coalition , where , and a performance score , which is a real number representing the performance measured for the perturbation configuration in which all the elements in are intact and the rest perturbed. The definite value in game theory and economics for this type of coalitional game is the Shapley value [Shapley, 1953]. The marginal importance of player to a coalition , with , is represented as . The Shapley value of each player is defined with Eq. (1), where is the set of all orderings of and is the set of players preceding in the ordering .
| (1) |
If we consider that all the players are arranged in some order (all orders being equally likely), the Shapley value can be seen as the marginal importance of a player to the set of players who precede it. Here, a configuration is a binary vector of length , with ci = 1 if or ci = 0 if , that is, an indicator vector for the unperturbed elements. For a more detailed description of the MSA, see Keinan et al. [2004a].
When all possible binary 2n perturbation configurations and corresponding performance scores are known, the Shapley value can be computed using Eq. (1), or as a summation over all 2n configurations, weighted by the number of possible ordering of the elements (Full Information MSA). Frequently, the complete set of performance scores for all combinations of the binary states of a set of regions required for MSA is not available, due to the difficulty of experimentally accessing all perturbation configurations. In those cases, a prediction model (see section “Data preparation for MSA: From original‐graded dataset to complete‐predicted dataset”) trained on the available set of configurations and performance scores can be used to predict the performance scores corresponding to all 2n binary configurations (Predicted MSA).
Regional Interactions: Redundancies and Synergies
In addition to identifying the contributions of individual elements, lesion inferences may also be used to investigate interactions among elements. In particular, such interactions can reveal redundancies between regions that indicate functional overlap, as well as synergistic relations. To describe the functional interactions between neural elements within the framework of MSA, we defined the following quantities. The Shapley value of element i in the subgame of all elements without j is given by . Intuitively, this represents the average marginal importance of element i when element j is lesioned. In the same way, we defined the Shapley value of element j in the subgame of all elements without i by . If we jointly consider the two elements i and j, as if they form a unique, joint element, it is possible to define the average marginal importance of this element by . Then, the two‐dimensional interaction between elements i and j can be defined as
| (2) |
which quantifies how much the average marginal importance of the two joined elements is larger or smaller than the sum of the average marginal importance of each of them when the other one is perturbed. This is a symmetric definition, . Thus, the interaction value indicates how much the whole (i.e., the contribution of the joint pair of regions) is greater than the sum of the parts (i.e., the sum of the individual functional contributions computed when the other region is lesioned).
If the interaction is 0 it means that the two elements are functionally independent from each other, while a negative interaction indicates redundancy or (partial) functional overlap between the two elements. By contrast, when the interaction is positive, the two elements jointly contribute more to the tested function than individually, implying a synergistic interaction and non‐overlapping contributions. These relations also provide an indication on the choice of regions of interest in the lesion analysis, because regions with redundant interactions (overlapping contributions) could be merged or reshaped, while independent or synergistically interacting regions should be kept separate.
Data Preparation for MSA: From Original‐Graded Dataset to Complete‐Predicted Dataset
The dataset used for further computations was derived from line bisection test data available for 23 patients, bells cancellation test data available for 24 patients, and letter cancellation test data available for 19 patients. For each patient, the graded measure of relative lesion size (i.e., % of lesioned voxels within each of the regions, seven BAs and the RB) was associated with the binarized performance score representing the two binary outcomes of the respective test (where 0 indicates “normal” and 1 indicates “pathological”). As mentioned above (see section “Neuropsychological clinical evaluation tests” for details), specific clinical standardized cutoffs were used to binarize behavioral scores: scores larger than two in absolute value for bells and letter cancellation (for ages above 50 years), and scores larger than +6.5 mm or smaller than −7.3 mm for the line bisection task [Rousseaux et al., 2001]. As the binary scores represent the severity of neurologic deficit and MSA requires a score representing behavioral ability, we used the inverse of each score as an indicator of functional performance.
The dataset, composed of ∼25 graded lesion configurations (describing relative lesion size) for seven areas and the “rest of the brain” together with the corresponding performance scores, was far from representing the full set of all possible combination of binary states of the eight areas of interest, as is typical for opportunistic samples (original‐graded dataset). In this study, a total number of 2n = 256 binary lesion configurations were generated as following: as each area could be considered as either lesioned, “0”, or intact, “1”, and n = 8 was the number of areas; correspondingly, 256 binary performance scores were required for the MSA (see section “Multi‐perturbation Shapley value analysis (MSA)”). To predict the binary performance scores of all possible 2n = 256 binary lesion configurations, we implemented in Matlab (Mathworks) a machine learning model for binary classification, more specifically, a support vector machine, SVM, trained on the available input original‐graded dataset (training dataset) of ∼25 clinical cases, each characterized by a unique graded lesion pattern, spanning from 0 to 1, (“0” indicating a completely damaged region and “1” a completely intact region), and the corresponding binary scores for each clinical test (training labels).
We first assessed the statistical power of the binary predictor by computing a classification (prediction) accuracy applying a “leave‐one‐out” cross‐validation on the original‐graded dataset for every test, using in turn each single case from the training data as the validation data and all the remaining cases as the training data. Specifically, classification accuracy was computed by counting the number of successful predictions (i.e., the number of times that the real binary score was predicted correctly) in the “leave‐one‐out” cross‐validation. In this procedure, a value of 100% indicated that the SVM predicted correctly the scores for all the ∼25 clinical cases. The SVM method used to find the separating hyperplane was the Sequential Minimal Optimization (SMO). The parameter representing the box‐constraint factor for the SVM was set to default value (c = 1). Whereas a SVM with polynomial kernel (order 3) was used for the bells and letter cancellation tests, a SVM with linear kernel was implemented for line bisection. This choice was taken after a sensitivity analysis on the SVM's kernel parameter to maximize classification accuracy for each individual test. For line bisection, classification accuracy was lower with the linear kernel than with a polynomial kernel, even though the mean values of the contributions were very similar to each other (albeit with larger standard deviation for the polynomial kernel). The result of this process yielded classification accuracies of 65%, 63%, and 84% for line bisection, bells cancellation, and letter cancellation, respectively. These accuracy levels were considerably higher than their respective statistical chance levels (52%, 55%, and 49%), computed as the classification accuracies (i.e., leaving out in turn each single case), but using randomly permutated scores instead of predicted scores. To statistically support our comparison, we performed a z‐test on the chance levels accuracy across 1000 simulations. Specifically, for each task we rejected the null hypothesis stating that the chance levels accuracy across 1000 simulations came from a normal distribution with mean value equal to the classification accuracy (i.e., p‐value <0.001 for line bisection, bells cancellation, and letter cancellation, respectively). As an additional measure of the performance of the binary prediction, we computed the Youden index [Youden, 1950]. This estimate is computed as Sensitivity + Specificity − 1 and its value ranges from −1 to 1. A value of 1 indicates that there are no false positives or false negatives in the prediction. The Youden index for our battery of clinical scores was 0.2, 0.3, and 0.7 for line bisection, bells cancellation, and letter cancellation, respectively. These values were considerably higher than the respective Youden indices computed with the randomly permutated scores (∼0 for the three clinical tests). As done for chance levels accuracy, we also performed a z‐test on the Youden index across 1000 simulations to statistically support our comparison. Specifically for each task, we rejected the null hypothesis that the Youden index at chance level across 1000 simulations came from a normal distribution with mean value equal to the classification Youden index (i.e., p‐value <0.001 for line bisection, bells cancellation, and letter cancellation, respectively).
We subsequently used the leave‐one‐out technique to estimate the variability of the prediction, by iteratively excluding each individual case from the prediction of the 2n behavioral scores corresponding to the complete set of binary configurations as required by MSA (complete‐predicted dataset), resulting in 23 separate predictions for line bisection, 24 predictions for bells cancellation, and 19 predictions for letter cancellation. We summarize the entire methodological process in Figure 1.
Figure 1.
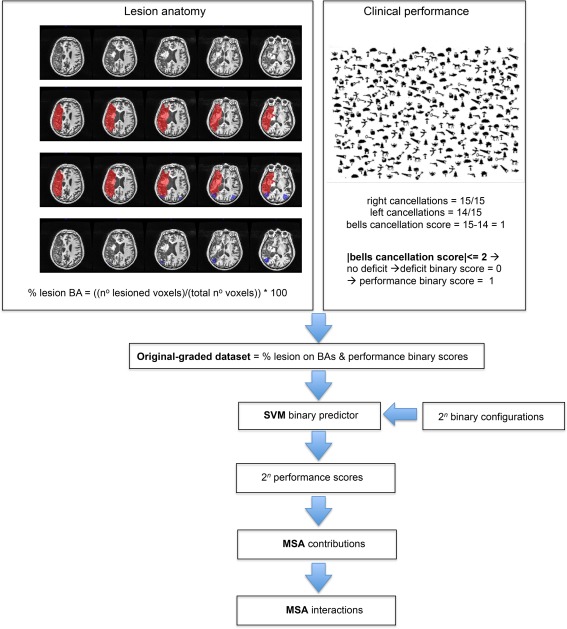
Schematic representation of the methodological process of the study in a given patient. The lesion anatomy section shows how lesions masks (in red) were segmented manually in the native space on the 3D T1 images. A Brodmann template (in blue, representing here the Brodmann area 39) was then overlapped on the lesion mask to perform subtraction analyses. The result shows only the lesioned voxels of Brodmann area 39. The percentage of lesioned voxels within each BA was computed as the absolute number of voxels within the analyzed BA that were also part of the lesion mask, divided by the total number of voxels present in each BA, and multiplied by one hundred. The clinical performance section shows the behavioral performance of the analyzed patient in the bells test and the binarization of the score (deficit = 0, normal performance = 1). The MSA approach was conducted and included the following steps: the generation of the original‐graded dataset, the application of the support vector machine and the computation of the performance scores, the computation of each Brodmann area contributions and interactions between the Brodmann areas. BA, Brodmann area; SVM, support vector machine; MSA, multiperturbation Shapley value analysis. [Color figure can be viewed at http://wileyonlinelibrary.com]
RESULTS
We first computed the relative lesion size (graded from 0 to 100% of lesion) for the seven BAs of interest (BA6, BA7, BA19 BA39/BA40, and BA44/BA45) corresponding to the large‐scale ROIs (FEF, IPS, IOG, TPJ, and IFG), and the “rest of the brain” (RB). These values are associated (Fig. 2) with binarized scores (from 0, “normal or absence of deficit” shown in black, to 1, “pathological level of impairment” shown in white), respectively, for the three clinical tests (line bisection, bells cancellation, and letter cancellation). These calculations showed that deficit scores were associated with different sizes of lesions in the set of selected BAs. Specifically, patients with large lesions as well as patients with small lesions in a given BA presented pathological scores according to the cutoff levels used to classify the tests (see “Materials and Methods” section). Particularly for the line bisection and letter cancellation tests, pathological scores were spread widely in patients with and without large lesions in the analyzed areas.
Figure 2.
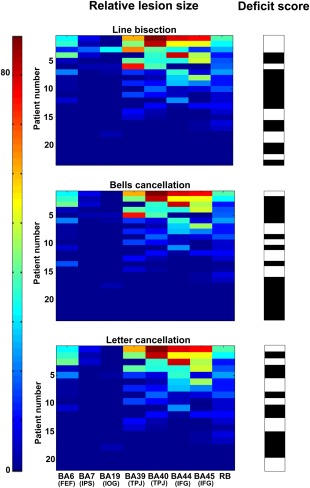
Patterns of relative lesion sizes of BA regions and associated binary clinical scores across patients. Panels represent the relative lesion size (in % of damaged voxels with respect to the total number of voxels for a region) for each of the seven BAs (BA6, BA7, BA19, BA39, BA40, BA44, and BA45) relevant for visuo‐spatial attention, plus one additional region representing the “rest of the brain”, RB. The three panels correspond to data of the patients evaluated with each of the three clinical tests of the study: line bisection (n = 23 patients), bells cancellation (n = 24 patients), and letter cancellation (n = 19 patients). Relative lesion patterns are associated with binary deficit scores. For each of the three clinical tests, patient cases are shown sorted in descending order from largest to smallest lesion sizes. The color‐coded scale displays the relative lesion size (from 0, in blue hues, to 88% of lesioned voxels in red hues), whereas the binary deficit score values of the clinical tests are represented in black (0: “normal”) or white (1: “pathological”). [Color figure can be viewed at http://wileyonlinelibrary.com]
We then computed pairwise Pearson correlation coefficients (Fig. 3) for the relative regional lesion patterns (i.e., correlations between all pairs of relative lesion sizes), across the selected sets of BAs for the patients (n = 23, n = 24, and n = 19), evaluated separately for each of the three clinical tests (line bisection, bells cancellation, and letter cancellation). These results allowed us to assess the covariance of lesion patterns across BAs, which could be caused by their dependence on a common source of blood supply (i.e., co‐localization within the same vascular territory). The results obtained for regions that have largely independent lesion patterns (i.e., with correlation between lesion sizes lower than 0.5), are important for the interpretation of genuine functional overlap indicated by redundant functional interactions. Statistically significant correlations (p < 0.05) are represented in graded colors, whereas nonsignificant correlations were blacked out (see more details in Figs. 6 and 7).
Figure 3.
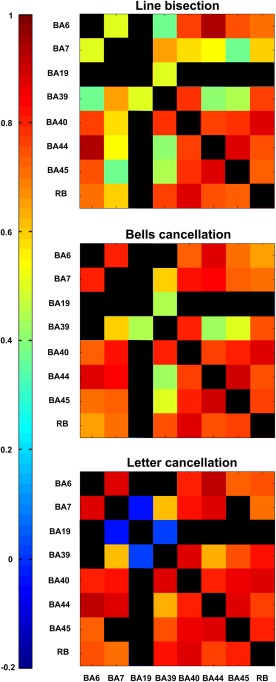
Correlations of lesion patterns across BA regions for patient samples corresponding to the three clinical tests. Correlations of the regional damage patterns across the eight areas of interest, calculated separately for the cohorts of patients evaluated by the three clinical tests (line bisection, n = 23 patients; bells cancellation, n = 24 patients; and letter cancellation, n = 19 patients). The strength of the correlation of pairs of ROIs is color‐coded from low (blue) to high (red). The color scale is the same for all panels. Statistically significant correlations (p < 0.05) are represented in color, while the other entries are left black. [Color figure can be viewed at http://wileyonlinelibrary.com]
Figure 6.
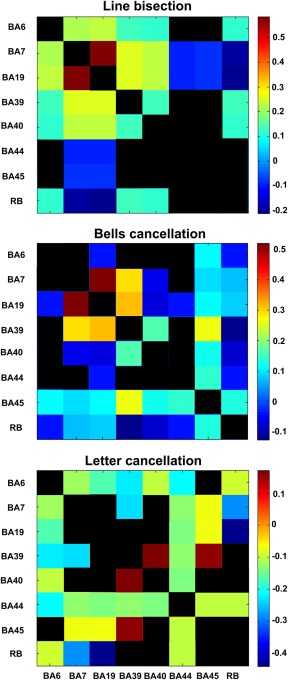
Regional interactions of pairs of ROIs contributing to attentional functions. Matrix of (symmetrical) mean functional interactions among the seven BAs (BA6, BA7, BA19, BA39, BA40, BA44, and BA45) as well as the “rest of the brain” (RB) for the three clinical tests. Positive (synergistic) interactions indicate that two regions jointly perform better than individually, whereas negative (redundant) interactions show that two regions have a (partial) functional overlap. For each of the three panels, inter‐regional interactions that are not significantly different from 0 (after Bonferroni correction, adjusted p‐value <0.0018) are presented in black. [Color figure can be viewed at http://wileyonlinelibrary.com]
Figure 7.
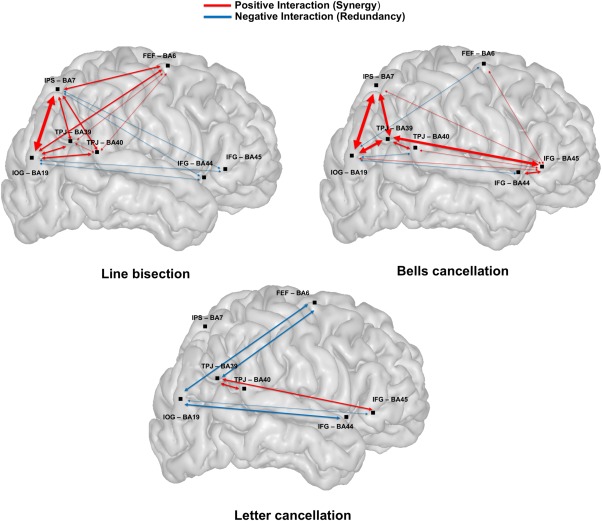
Map of regional functional interactions for the three clinical tests. Schematic representation of a representative brain volume and functional interactions between pairs of ROIs (BA6/FEF, BA7/IPS, BA19/IOG, BA39/BA40/TPJ, and BA44/BA45/IFG) involved in visuo‐spatial attention. Positive interactions (Synergy) shown in red arrows indicate that two regions jointly perform better than individually. Negative interactions (Redundancy) shown by blue arrows indicate that two regions have a (partial) functional overlap. The thickness of the arrow between two nodes is proportional to the computed strength of the nodes' functional interaction. To ensure that the functional overlap indicated by a redundant functional interaction was not primarily caused by lesion pattern covariance, the figure shows only redundancies between regions with independent lesion patterns, (i.e., Pearson correlation coefficients <0.5 or nonsignificant coefficients, represented in black, see Fig. 3). [Color figure can be viewed at http://wileyonlinelibrary.com]
To characterize the contribution of each BA in the three evaluated clinical tests, we computed the normalized mean MSA contribution values (Fig. 4). By applying the leave‐one‐out approach, we computed the average MSA contributions across 23 (line bisection), 24 (bells cancellation), or 19 (letter cancellation) predictions of the 256 behavioral scores. Standard deviation bars were derived from the leave‐one‐out technique during the prediction of performance scores (see section “Data preparation for MSA: From original‐graded dataset to complete‐predicted dataset”). MSA contribution values were all significantly different from 0 (except for BA40 in the bells cancellation test), according to a t‐test against the alternative of 0 mean (after Bonferroni correction, adjusted p < 0.0063). Positive contributions indicate that a region or a set of regions contributes to the performance in a given clinical test. Thus, if such regions were injured, performance would decrease. By contrast, a negative contribution indicates that a region hinders performance and implies that damage of the region may actually improve performance scores.
Figure 4.
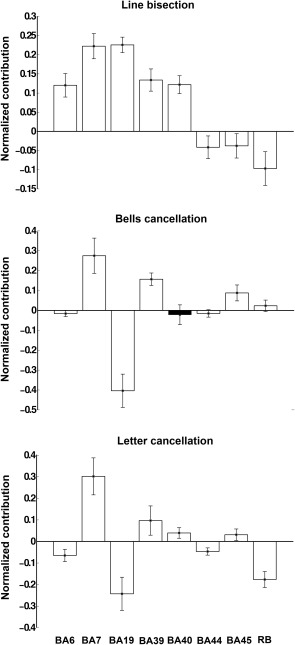
Regional MSA functional contributions to attentional function. Normalized mean MSA contribution values (± standard deviation, SD) for line bisection, bells cancellation, and letter cancellation, respectively, computed using the original‐graded dataset based on the machine‐learning prediction of performance scores corresponding to the complete set of 256 configurations. Positive values indicate positive contributions (hence injury of the respective regions leads to decreased performance) whereas negative values indicate negative contributions (injury of the respective regions results in increased performance). All contributions, except that of BA40/IFG in the bells cancellation test (shown in black), were statistically significant, after Bonferroni correction (adjusted p‐value <0.0063).
For the three clinical test scores, our analyses showed that BA7/IPS and frequently also BA39/TPJ tended to provide the strongest contributions. Focusing on the positive contributions in each individual clinical test, for the line bisection, BA19/IOG and BA7/IPS provided the largest positive contributions; BA39/TPJ, BA40/TPJ, and BA6/FEF were also positive contributors. Differently, for bells cancellation, BA7/IPS, BA39/TPJ, and BA45/IFG had the greatest positive contributions to performance. Similarly to the bells cancellation, for the letter cancellation, the strongest positive contributors were BA7/IPS and BA39/TPJ, as well as BA40/TPJ and BA45/IFG.
The single negative contribution common to all tests was by BA44/IFG; the other negative contributors were different from one test to another. Specifically for line bisection, the other negative contributors were RB and BA45/IFG; for bells cancellation BA19/IOG and BA6/FEF; and for letter cancellation BA19/IOG, BA6/FEF, and RB.
Interestingly, several BAs showed double‐dissociated contributions, with positive contributions to one clinical test and negative contributions to another. For instance, whereas region BA19/IOG made a strong negative contribution to outcomes in the bells and letter cancellation tests, it had a positive contribution to line bisection scores, demonstrating that the same area could facilitate and hinder different aspects of a multifaceted cognitive function, such as spatial attention. Similarly, BA6/FEF had a strong positive contribution for the line bisection test, but a negative contribution for both bells and letter cancellation tests. Moreover, BA45/IFG had a negative contribution for line bisection, but a positive contribution to both the letter and bells cancellation tests.
In sum, we can distinguish ROIs always making a positive contribution (BA7/IPS and BA39/TPJ), ROIs always making a negative contribution (BA44/IFG) and BAs having alternating task‐dependent contributions (BA19/IOG, BA6/FEF, and BA45/IFG). In this context, Figure 5, which displays the normalized mean MSA contribution values for the three tests (same quantities as in Fig. 4) in a color‐coded matrix, is helpful for comparing the strength of positive or negative contributions for a given brain region across the three tests. This representation also allows the interpretation of the results in terms of “localization of function” in a particular area (along the columns) and “specialization of regions” (along the rows). The matrix indicates that the cancellation tasks (bells and letter cancellation tests) share a similar pattern of positive/negative contributions (i.e., the same localization of function, mainly in BA7), differently from the line bisection task, which comprises more widely distributed regional contributions (e.g., also including BA19).
Figure 5.
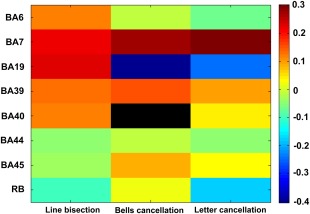
Matrix of relative MSA contributions. The matrix displays the normalized mean MSA contribution values for the line bisection test, bells cancellation test, and letter cancellation test, respectively. The color‐coded scale indicates the relative strength of the MSA contributions: positive contributions are represented in hot colors, whereas negative contributions are represented in cold hues. Contributions that are not statistically significant after Bonferroni correction (adjusted p‐value <0.0063) are represented in black (BA40/IFG for bells cancellation). The color map scale is the same for all three clinical tests. [Color figure can be viewed at http://wileyonlinelibrary.com]
We also computed the functional interactions between pairs of ROIs (Fig. 6) as described in the section on “Materials and Methods.” These interactions, which express the difference between the joint contributions of two areas versus the sum of their individual contributions, are based on the mean contribution values computed via the leave‐one‐out approach. One can distinguish between positive (synergistic) interactions indicating that two regions have a larger joint contribution compared to the sum of their individual contributions, and negative (redundant) interactions showing that two regions have a (partial) functional overlap.
We first focused on the strongest positive (synergistic) inter‐regional interactions that were significantly different from 0 (after Bonferroni correction, adjusted p < 0.0018) for each individual clinical test. For the line bisection, the strongest positive interactions occurred between BA19/IOG and BA7/IPS, between BA19/IOG and BA39/TPJ, and between BA39/TPJ and BA7/IPS. For bells cancellation, similar to line bisection, the strongest positive interactions occurred between BA19/IOG and BA7/IPS, between BA19/IOG and BA39/TPJ and between BA39/TPJ and BA7/IPS; additional positive inter‐regional interactions were found between BA45/IFG and BA39/TPJ. For the letter cancellation, the strongest positive interactions were found between BA39/TPJ and BA40/TPJ and between BA39/TPJ and BA45/IFG.
We then focused on negative (redundant) inter‐regional interactions for each test. For line bisection, we observed the most negative interactions between BA7/IPS and RB and between BA19/IOG and RB. Additional negative interactions were observed between BA44/BA45/IFG and BA19/IOG and between BA44/BA45/IFG and BA7/IPS. For the bells cancellation, the most negative interactions were observed between BA40/TPJ and BA19/IOG, between BA19/IOG and BA6/FEF, between RB and BA39/TPJ, between BA40/TPJ and BA7/IPS, and between BA19/IOG and BA44/IFG. For the letter cancellation, negative interactions were observed between RB and BA19/IOG, between RB and BA7/IPS, between BA39/TPJ and BA6/FEF, between BA39/TPJ and BA7/IPS, between BA19/IOG and BA6/FEF, between BA19/IOG and BA44/BA45/IFG, and between BA44/IFG and BA6/FEF.
Interestingly, some interactions between two areas showed diverging contributions being positive for a given test and negative for another. For instance, whereas the interaction between BA19/IOG and BA6/IFG was positive for the line bisection, it was negative for the bells and letters cancellation. Also, the interaction between BA19/IOG and BA40/TPJ was negative for the bells cancellation, but positive for the line bisection. Indirectly, these diverging contributions have the potential to shine light on the functional anatomy of the human brain, by supporting the existence of cortical circuits simultaneously comprising nodes that interact positively (involving two anatomical areas with complementary functions, contributing more when joined together) with respect to a given cognitive function and nodes interacting negatively (grouping areas with overlapping functions) for another component of the same cognitive function.
A schematic representation of the brain and the significant functional interactions between pairs of BAs associated to specific ROIs (BA6/FEF, BA7/IPS, BA19/IOG, BA39/BA40/TPJ, and BA44/BA45/IFG) is shown in Figure 7. The interactions can be described as synergies and redundancies. Importantly, note that the interactions represented in Figure 7 are the same as in Figure 6, but focused on a subset of interactions. Specifically, while we included all synergistic interactions, we focused only on redundancies between regions with independent lesion patterns, as indicated by an absence of a substantial correlation (i.e., Pearson correlation coefficient <0.5 or nonsignificant coefficients, represented in black) (Fig. 3). This approach ensured that the functional overlap indicated by redundant functional interactions (shown in blue in Fig. 7) was not just caused by a lesion pattern covariance (potentially induced by the sharing of the same infarct territory), but reflected a genuine functional overlap. The strongest redundant interactions reflecting functional overlap were found between BA19/IOG and BA6/FEF (for the bells and letter cancellation tests), also between BA19/IOG and BA40/TPJ (for the bells cancellation test), between BA39/TPJ and BA6/FEF (for the letter cancellation test), and between BA19/IOG and BA44/BA45/IFG for all the tasks (except for BA19/IOG and BA45/IFG in the bells cancellation test). In the line bisection task, redundant interactions were revealed between BA7/IPS and BA44/BA45/IFG.
DISCUSSION
The aim of this study was to explore causal contributions of different right‐hemispheric cortical regions of interest to visuo‐spatial attentional performance, based on clinical deficits after stroke, by using a new lesion inference approach based on game theory. To characterize attentional impairments, we investigated behavioral and anatomical data from 25 poststroke right‐brain‐damaged patients presenting chronic clinical signs of visuo‐spatial neglect, and studied a set of anatomical regions that are considered critical by models of attentional orienting and its disorders, as well as an auxiliary ROI covering the “rest of the brain” (RB).
By using the MSA approach, we inferred the main contributions and interactions for each attentional test considered in the study. The main contributor to performance in all three clinical tests we evaluated (line bisection, letter cancellation, and bells cancellation) was BA7/IPS. Synergistic influences, suggesting complementary functions of two given areas in contributing to a given test, were observed between BA7/IPS and BA39/TPJ, BA7/IPS and BA19/IOG, BA39/TPJ and BA19/IOG (for bells cancellation and line bisection), between BA39/TPJ and BA45/IFG, and between BA39/TPJ and BA40/TPJ (for bells cancellation and letter cancellation).
Positive Contributions
For each neuropsychological test used, we first considered positive contributions, indicating regions that facilitate performance of a given task in healthy individuals (or said otherwise, regions whose injury in patients results in decreases of performance). We demonstrated that BA7/IPS and BA39/TPJ regions were responsible for visuo‐spatial performance in all three clinical tests considered in our analyses. It should be noted that these tests characterize only a small portion of the symptoms of the patients, and, thus, the involvement of BA7/IPS and BA39/TPJ cannot be generalized to the entire visuo‐spatial complex of attention. The location of these sites in the caudal end of the dorsal (frontoparietal) attentional network, subtended by the branches of the Superior Longitudinal Fasciculus (SLF), is relevant, given that frontoparietal interactions have been repeatedly emphasized as being crucial for endogenous and exogenous attentional orienting [Corbetta and Shulman, 2002; Bartolomeo et al., 2007, Chica et al., 2011] and the facilitation of visual performance [Chanes et al., 2012, Quentin et al., 2015]. More specifically, BA7/IPS is located at the projection site (in its cranial portion at the level of the supramarginal gyrus) of the second branch of SLF (SLF II) toward the FEF/BA6/BA8 [Thiebaut de Schotten et al., 2011] and B39/TPJ is located at the projection site of the third branch of SLF (SLF III) toward BA44/BA45/IFG [Thiebaut de Schotten et al., 2011].
Specific positive contributions of ROIs were observed for each test considered in our analyses. Specifically, the line bisection test score, involving a perceptual component of line length estimation and a motor component of manual bisection, was principally related to lesions of BA19/IOG and BA7/IPS. Interestingly, for this clinical test, additional regions localized on the trajectory of the SLF, such as BA6/FEF, BA39/TPJ, and BA40/TPJ, also emerged in our analyses as positive contributors. The second branch of the SLF (SLF II) connects the FEF (BA6 and BA8) with the angular gyrus (BA39) [Petrides & Pandya, 2002] and its role in line bisection has been repeatedly emphasized through different methodological approaches [Thiebaut de Schotten et al., 2011, 2005].
Similar contributions of BA19/IOG to line bisection outcomes have been reported in EEG [Waberski et al., 2008] and fMRI [Fink et al., 2002] studies. In our study, this region was specifically associated with line bisection, but not with the remaining tests. Given BA19/IOG's involvement in visual stimuli processing, this result suggests that the perceptual component involved in the line bisection task could explain the main contribution of this area. Accordingly, activations of BA19/IOG have been also observed [Fink et al., 2002] for the so‐called “landmark task” (judging whether or not a transection mark is at the center of a line) and also in the length comparison of lines (i.e., whether or not line segments on each side of a transection mark are of equal length).
Cancellation tests involve a specific spatial exploration component, including selection and processing of target stimuli scattered among distractors, and a working memory component to remember targets that have already been processed. The main positive contributors to these tests were BA7/IPS, BA39/TPJ, and BA45/IFG. The role of BA45/IFG in cancellation tests has been previously emphasized by other authors [Husain et al., 2001 and Wojciulik et al., 2001]. Moreover Urbanski et al. [2011] found that signs of neglect in cancellation tests mainly occurred after damage in the territory of the SLF III, hence supporting a role for BA39/TPJ in these tests. It should also be noted that the contribution of the “rest of the brain” (RB) ROI was positive for the bells cancellation. In this case, a small positive contribution shows that other ROIs (that were not specifically considered in the current analysis) could be involved and may facilitate performance in this test. Thus, alternative sets of ROIs should be considered to characterize more precisely the set of regions important for this task.
Negative Contributions
In addition to positive facilitatory contributions to attentional performance, negative contributions of regions that in healthy individuals appear to hinder performance (or said otherwise, regions whose injury in patients results in increases of clinical performance) provide crucial insights into the functional organization of visuo‐spatial attentional networks. We demonstrated that the BA44/IFG region hindered performance in all three clinical tests considered in our analyses. However, as for positive contributions, given that the present evaluation characterized only a small portion of the symptoms of the patients, negative contributions of BA44/IFG cannot be generalized to the entire complex of visuo‐spatial attentional function.
Specific negative contributions were observed for each of the clinical tests included in our analyses. For the line bisection test, BA44/BA45/IFG and the RB (“rest of the brain”) appeared as strong negative contributors to task performance. This implies that in the given coalition of ROIs, damage in BA44/BA45/IFG might paradoxically improve performance of line bisection. On the other hand, for the cancellation test, the strongest negative contribution came from BA19/IOG, BA6/FEF, and BA44/IFG, indicating that in a given coalition, these areas could lower performance for the cancellation test.
With regard to negative contributions, it should be noted that several studies investigating spatial attention in animals and humans have reported a paradoxical cancelation of visuo‐spatial orienting deficits resulting from earlier lesions following the permanent or reversible deactivation of spared cortical or subcortical regions [Rushmore et al., 2006; Sprague, 1966; Vuilleumier et al., 1996] or often the induction of better than normal visual detection performance in intact individuals [Chanes et al., 2012, 2013; Hilgetag et al., 2001; Quentin et al., 2015; Thut et al., 2005]. In this context, a detailed consideration of the positive and negative contributions revealed by MSA approaches in post‐right‐hemisphere stroke neglect patients could prove highly interesting, to guide neurological rehabilitation protocols based on focal manipulation of cortical sites and their associated networks through noninvasive brain stimulation technologies (such as rTMS, Transcranial Direct Current Stimulation (tDCS), or transcranial alternating current stimulation (tACS)).
Synergistic Interactions
Synergies represent relationships existing between areas accomplishing complementary functions and contributing more to a particular function as a joint region than when acting separately. Our analyses of the line bisection test revealed specific synergistic interactions between areas localized along cortical regions encompassing the origin or destination of the SLF white matter fibers connecting frontal and parietal sites, such as between BA6/FEF and BA7/IPS, but also between BA7/IPS and BA39/BA40/TPJ, BA7/IPS and BA19/IOG, and between BA6/FEF and BA19/IOG, arguing for complementary contributions by these areas to line bisection performance. In favor of this hypothesis, BA6/FEF is hosted in the premotor/prefrontal cortex, and it is considered an important area for the planning and control of movement (either manual or saccadic), essential for motor operations required in line bisection. Additionally, BA7/IPS and BA19/IOG have been associated with the perceptual visuo‐spatial component of the line bisection task. The synergistic interaction between BA7/IPS and BA39/BA40/TPJ is compatible with the neuroanatomical model of attentional control proposed by Corbetta and Shulman [2002]. According to these authors, BA7/IPS would provide BA39/BA40/TPJ with information concerning the behavioral relevance of novel stimuli and, thus, this positive interaction would be essential for the circuit‐breaking function of attention, allowing the processing of novel and important information.
Analyses of both the bells and letter cancellation tasks revealed synergistic interactions between BA39/TPJ and BA40/TPJ. Damage in the BA39/BA40/TPJ region has been considered the best predictor of attentional impairments such as the visuo‐spatial neglect syndrome [Heilman et al., 1983; Mort et al., 2003; Vallar & Perani, 1986]. Our MSA approach identified synergistic interactions also between BA39/TPJ and BA45/IFG for both tests, both regions representing projection areas for branches of the SLF (SLF II and SLF III). The synergistic interaction between BA19/IOG and BA7/IPS was only relevant for the bells cancellation test. Synergies between BA39/TPJ and BA40/TPJ and between BA39/TPJ and BA19/IOG for the bells cancellation test suggest the involvement of a local parieto‐occipital network in such tasks.
As RB was also involved in synergistic interactions (such as, for instance, between RB and BA39/BA40/TPJ), one might speculate that other areas than those considered in the analysis could be complementary to the TPJ for accomplishing the visual search task.
Redundant Interactions
In our analyses, redundant interactions indicate the existence of areas accomplishing overlapping functions, that is, areas that joined together have a smaller contribution than individually. Importantly, redundant functional interactions are not just caused by a lesion pattern covariance that arises by the sharing of the same infarct territory, but reflect a genuine functional overlap. This issue is particularly relevant for our study, given that other methods used to infer brain–behavior relationship, such as lesion symptom mapping [Bates et al., 2003] might suffer from such covariance bias [Mah et al., 2014].
Our analyses revealed redundant interactions between BA44/BA45/IFG and BA7/IPS and between the former and BA19/IOG, indicating overlapping functional contributions of these three regions to performance in the line bisection task. Such overlap could be mediated by the second and the third branches of the SLF (the anterior projection being localized at the level of BA6/FEF and BA44/IFG) [Petrides & Pandya, 2002; Thiebaut de Schotten, 2011] and the inferior fronto‐occipital fasciculus (IFOF), connecting the ventrolateral prefrontal cortex and medial orbitofrontal cortex to the occipital lobe [Catani et al., 2002]. This finding appears to be in favor of a partial functional overlap between the frontoparietal network (SLF) and the fibers of the IFOF, hence calling for further studies and considering merging these two tracts into more appropriate functional parcels.
A pioneer study using MSA to analyze line bisection performance [Kaufman et al., 2009] concluded that the regions contributing the most to this specific test were the Supramarginal Gyrus and the Angular Gyrus, the Superior Parietal Lobule, the rostral portion of the TPJ, and the thalamus. These results are consistent with our current results, and, taken together with prior evidence, further emphasize the contribution of posterior cortical areas to line bisection performance.
Furthermore, we note redundant interactions between BA6/FEF and BA7/IPS for letter cancellation test, both situated on the trajectory of the SLF I and the SLF II. We also found two interactions that were either redundant or synergistic depending on the task. For instance, the interaction between BA6/FEF and BA19/IOG was redundant for both the cancellation tests, whereas it was synergistic for line bisection. A redundant interaction was also observed between BA19/IOG and BA40/TPJ for the bells cancellation task, whereas the same interaction was synergistic for the line bisection task. These results indicate the need to evaluate further task‐specific contributions of local networks in the orienting of attention. The auxiliary territory of the “rest of the brain” was also involved in negative interactions, for instance, with BA7/IPS in the line bisection task. This negative interaction shows that other ROIs not considered in the present analysis could have similar functions as those in the vicinity of the IPS.
Implications for Rehabilitation Approaches
This study was based on anatomical models proposed for the healthy brain to describe positively and negatively contributing areas, as well as interactions between different anatomical regions, in the context of spatial attention. We used human pathology data (one post‐stroke visuospatial neglect) to test the proposed model and verify the MSA method. Positive and negative contributions and synergistic and redundant interactions emerging from the MSA analysis proved plausible anatomically and physiologically and compatible with the known organization of visuospatial attention networks in the human brain.
The current work opens the way to several new approaches in rehabilitation. For instance, after having described anatomical maps of spatial attention, several nodes of the network could be stimulated in an inhibitory or excitatory fashion, to design neurological rehabilitation approaches in visuospatial neglect patients. Given that BA7/IPS and BA39/TPJ were always positive contributors and specific synergistic relationships were observed between these two regions, one can imagine approaches of specific noninvasive stimulation (e.g., by TMS or tDCS) of these areas in the ipsilesional hemisphere of neglect patients. A precise anatomical mapping also allows adaptations of stimulation interventions depending on the patient profile (presenting visuospatial search deficits or deficits in the estimation of horizontal lengths, or both). An inhibitory stimulation approach could also be considered, by inhibiting ipsilateral areas such as BA19/IOG or BA44/IFG (that were indicated as negative contributors in coalitions considered in this study), to allow the restitution of activity patterns in intact brain areas involved in the tested function. Adapted noninvasive stimulation interventions should be planned in this case, taking into account the coalition of intact and damaged nodes and the role of such areas in other cognitive functions. Until now, such therapeutic approaches were pursued by using combined TMS‐fMRI or TMS‐EEG methods, which have the ability to manipulate anatomical networks, but are theoretically and methodologically challenging. In this context, the MSA approach could be used to improve guidance of TMS interventions to provide a viable solution for rehabilitation.
Advantages and Limitations of the MSA
The MSA approach represents a novel, mathematically rigorous method for the objective, multivariate computation of causal contributions of specific brain regions to brain function. The approach considers brain regions as players in a coalition game and takes into account the behavioral impact (for a given task or clinical test) of each possible configuration of intact and lesioned states of a set of brain regions. The method requires a preconditioning of the raw neuroimaging and neuropsychological datasets (including the use of a prediction algorithm, based on machine learning) to estimate a final dataset of 2n behavioral scores associated with the 2n binary lesion states for each task.
In comparison with traditional univariate approaches, the MSA approach has the advantage of being a multivariate method accounting for inherent dependencies of regions of interest. Such an approach can circumvent biases of collinearity (i.e., several lesions that are correlated because of sharing the same vascular territory) [Godefroy et al., 1998] and also problems related to the mislocalization of critical areas, that, as recently shown for VLSM approaches, could displace the inference of critical regions from their true location [Mah et al., 2014]. A direct comparison of MSA with other lesion inference approaches is of essence, nonetheless outside the scope of the present work. Results of such a comparison, which can only be conducted for a priori defined ground‐truth data, but not actual clinical data, will hence be reported elsewhere.
Moreover, the MSA technique also allows characterizing redundant versus synergistic contributions of each area considered in the analysis, and thus distinguishes areas that have complementary functions from areas which are superposed functionally. The maps of contributions of anatomical areas and interactions between them emerging from this method could be used to plan focal interventions with neurostimulation methods to manipulate specific network locations and induce patterns of activity throughout and thus facilitate functional restitution in neurological patients. These features make the MSA approach a good choice for exploring specific contributions of brain regions to cognitive functions.
Nonetheless, the necessary choice of the best‐suited predictor for the complete dataset and the consequent prediction bias coming from the machine‐learning estimation represents one of the limitations of the MSA method [Zavaglia et al., 2015]. In fact, a substantial disadvantage arises from the necessary preparation of the complete dataset of 2n (here 256) scores using an empirical dataset of only 25 subjects (which were the ones available to us for this study) potentially resulting in a prediction bias from the SVM estimation. Indeed, the low number of patients of the present sample (in this study, between ∼19 and 24 patients depending on each of the three clinical tests) to estimate the complete dataset represents a practical restriction that needs to be considered. Specifically, the Youden index (which takes into account both false positives and negatives) is rather low for two of the tests, but considerably higher than the Youden values at chance level. It is, however, important to mention that the SVM results could be biased by the fact that we selected the kernels that produced the best classification accuracies for each task. Accordingly, better results could be obtained from a MSA analysis with a more generalizable SVM, trained on a higher number of patients who exhibit lesions across more of the examined regions [Zavaglia et al., 2016b]. We should also note that in the present patients cohort, several regions were impacted by very small lesions, which occurred only in a few patients (e.g., BA19 and BA7). Hence, to better explain causal interactions underlying the visuo‐spatial attention in human, the current results should be contrasted with further studies with different and more varied lesion patterns. Moreover, the reliability of the conclusions derived from MSA would be strengthened by increasing the number of included cases relative to the number of analyzed regions (ideally, there would be empirical data for all 2n performance scores required by the analysis). For future studies, we aim to consider a larger sample, which will permit more accurate (in terms of both prediction accuracy and Youden index) and detailed (in terms of including a large number of regions) analyses.
Another limitation of this study, and also more generally of anatomopathological analyses performed on chronic neurovascular patients, concerns the variability of time intervals after the stroke onset, ranging in this study from several months to several years. Given that lesion location and functional deficits are influenced by the dynamic process of stroke recovery, homogeneity of time periods since stroke onset is important. Generally, images acquired several months after the stroke onset reflect the real extent of the lesion. However, the functional outcome may evolve depending on the employed rehabilitation program.
Moreover, concerning our selection of Brodmann areas, it is possible that a function depends only on a portion of a given BA or on areas located astride two BAs. However, it is unlikely that this point represents a substantial limitation in this study, as it should have resulted in nonsignificant results, which were not observed here. Furthermore, given that the distribution of main contributors and the interactions depend on the set of chosen regions, it remains important to investigate the anatomical correlates subtending alternative visuo‐spatial tests and alternative sets of ROIs based on a further growing visuo‐spatial attentional orienting literature. Particularly, alternative sets of ROIs could include a combination of cortical and subcortical structures. It should be noted that in this study, the selection of ROIs was based on several preliminary analyses confirming that the contributions of other anatomical regions were minimal. Along the same line of thought, one should also note that our current results showed a low contribution of the “rest of the brain” for each neuropsychological test used in the analysis. As a further matter, given the new hodological perspective in clinical‐anatomical correlation studies of attention that highlights the crucial role of the white matter connections and their disconnections in neglect [Thiebaut de Schotten et al., 2005; Doricchi et al., 2008], future studies ought to analyze the functional contribution of white matter bundles. However, this point was beyond the scope of the present study that focused on the role of cortical gray matter structures.
CONCLUSION
In summary, we successfully tested the use of a game theory‐based lesion inference approach for studying brain–behavior relationships and exploring the network‐wide functional anatomy patterns underlying a specific cognitive process in the human brain. We particularly applied this approach to characterize the functional anatomy subtending spatial attention. Similar methods could also be appropriate for examining cognitive processes in a large variety of brain disorders inducing monofocal or multifocal brain damage. Moreover, applying this method to different pathologies holds the potential for improving our understanding of complex brain networks and contributing to the rehabilitation of specific cognitive deficits in neurological patients.
ACKNOWLEDGMENTS
Study funded in part by FP6 (EU VIth Frame Program) & EU project eraNET‐NEURON 2009 “BEYONDVIS” and NIH‐NINDS‐CDI, R21 NS062317 Recovering localized brain damage by tDCS to AV‐C and CCH; ANR Appel Génerique 2015 “OSCILLOSCOPUS”, IHU‐A‐ICM Translationnel 2011 to AV‐C, and PHRC Regional “NEGLECT” 2009, to AV‐C and PP‐D as well as German Research Council (DFG) projects SFB 936/A1, Z3, and TRR 169/A2 to CCH. We are thankful to Dr B. Dubois for scientific and logistic support, Dr B. Batrancourt and E. Volle for managing the CAC database, Dr P. Bartolomeo for advice with the selection and scoring approaches of clinical neglect tests, and A. Kaglik for help in managing patients' data. Finally, we thank the EFRAD foundation for providing equipment funds and the Naturalia & Biologia Foundation for providing travel grants for some of the co‐authors. The authors declare no competing financial interests.
Contributor Information
Antoni Valero‐Cabré, Email: antoni.valerocabre@icm-institute.org, Email: avalerocabre@gmail.com.
Claus C. Hilgetag, Email: c.hilgetag@gmail.com.
REFERENCES
- Azouvi P, Samuel C, Louis‐Dreyfus A, Bernati T, Bartolomeo P, Beis JM, Chokron S, Leclercq M, Marchal F, Martin Y, De Montety G, Olivier S, Perennou D, Pradat‐Diehl P, Prairial C, Rode G, Sieroff E, Wiart L, Rousseaux M (2002): Sensitivity of clinical and behavioural tests of spatial neglect after right hemisphere stroke. J Neurol Neurosurg Psychiatry 73:160–166. [DOI] [PMC free article] [PubMed] [Google Scholar]
- Bartolomeo P, Chokron S (1999): Left unilateral neglect or right hyperattention?. Neurology 53:2023–2027. [DOI] [PubMed] [Google Scholar]
- Bartolomeo P, Thiebaut de Schotten M, Doricchi F (2007): Left unilateral neglect as a disconnection syndrome. Cereb Cortex 17:2479–2490. [DOI] [PubMed] [Google Scholar]
- Bates E, Wilson SM, Saygin AP, Dick F, Sereno MI, Knight RT, Dronkers NF (2003): Voxel‐based lesion‐symptom mapping. Nat Neurosci 6:448–450. [DOI] [PubMed] [Google Scholar]
- Binder J, Marshall R, Lazar R, Benjamin J, Mohr JP (1992): Distinct syndromes of hemineglect. Arch Neurol 49:1187–1194. [DOI] [PubMed] [Google Scholar]
- Catani M, Howard RJ, Pajevic S, Jones DK (2002): Virtual in vivo interactive dissection of white matter fasciculi in the human brain. Neuroimage 17:77–94. [DOI] [PubMed] [Google Scholar]
- Chanes L, Chica AB, Quentin R, Valero‐Cabre A (2012): Manipulation of pre‐target activity on the right frontal eye field enhances conscious visual perception in humans. PLoS One 7:e36232. [DOI] [PMC free article] [PubMed] [Google Scholar]
- Chanes L, Quentin R, Tallon‐Baudry C, Valero‐Cabré A (2013): Causal frequency‐specific contributions of frontal spatiotemporal patterns induced by non‐invasive neurostimulation to human visual performance. J Neurosci 1333:5000–5005. [DOI] [PMC free article] [PubMed] [Google Scholar]
- Chica AB, Bartolomeo P, Valero‐Cabré A (2011): Dorsal and ventral parietal contributions to spatial orienting in the human brain. J Neurosci 31:8143–8149. [DOI] [PMC free article] [PubMed] [Google Scholar]
- Chica AB, Valero‐Cabre A, Paz‐Alonso PM, Bartolomeo P (2014): Causal contributions of the left frontal eye field to conscious perception. Cereb Cortex 24:745–753. [DOI] [PubMed] [Google Scholar]
- Corbetta M, Patel G, Shulman GL (2008): The reorienting system of the human brain: From environment to theory of mind. Neuron 58:306–324. [DOI] [PMC free article] [PubMed] [Google Scholar]
- Corbetta M, Shulman GL (2002): Control of goal‐directed and stimulus‐driven attention in the brain. Nat Rev Neurosci 3:201–215. [DOI] [PubMed] [Google Scholar]
- Doricchi F, Thiebaut de Schotten M, Tomaiuolo F, Bartolomeo P (2008): White matter (dis)connections and gray matter (dys)functions in visual neglect: Gaining insights into the brain networks of spatial awareness. Cortex 44:983–995. [DOI] [PubMed] [Google Scholar]
- Fink GR, Marshall JC, Weiss PH, Toni I, Zilles K (2002): Task instructions influence the cognitive strategies involved in line bisection judgements: Evidence from modulated neural mechanisms revealed by fMRI. Neuropsychologia 40:119–130. [DOI] [PubMed] [Google Scholar]
- Gauthier L, Dehaut F, Joanette Y (1989): The bells test: A quantitative and qualitative test for visual neglect. Int J Clin Neuropsychol 11:49–53. [Google Scholar]
- Godefroy O, Duhamel A, Leclerc X, Saint Michel T, Henon H, Leys D (1998): Brain‐behaviour relationships. Some models and related statistical procedures for the study of brain‐damaged patients. Brain. 121: 1545–1556. [DOI] [PubMed] [Google Scholar]
- Heilman KM, Watson FL, Bowers D, Valenstein E (1983): Right hemisphere dominance for attention. Revue Neurologique 139:416–419. [PubMed] [Google Scholar]
- Hilgetag CC, Theoret H, Pascual‐Leone A (2001): Enhanced visual spatial attention ipsilateral to rTMS‐induced 'virtual lesions' of human parietal cortex. Nat Neurosci 4:953–957. [DOI] [PubMed] [Google Scholar]
- Husain M, Mannan S, Hodgson T, Wojciulik E, Driver J, Kennard C (2001): Impaired spatial working memory across saccades contributes to abnormal search in parietal neglect. Brain 124:941–952. [DOI] [PubMed] [Google Scholar]
- Husain M, Nachev P (2007): Space and the parietal cortex. Trends Cognit Sci 11:30–66. [DOI] [PMC free article] [PubMed] [Google Scholar]
- Karnath H‐O, Ferber S, Himmelbach M (2001): Spatial awareness is a function of the temporal not the posterior parietal lobe. Nature 411:950–953. [DOI] [PubMed] [Google Scholar]
- Kaufman A, Keinan A, Meilijson I, Kupiec M, Ruppin E (2005): Quantitative analysis of genetic and neuronal multi‐perturbation experiments. PLoS Comput Biol 1:e64. [DOI] [PMC free article] [PubMed] [Google Scholar]
- Kaufman A, Serfaty C, Deouell LY, Ruppin E, Soroker N (2009): Multiperturbation analysis of distributed neural networks: The case of spatial neglect. Hum Brain Mapp 30:3687–3695. [DOI] [PMC free article] [PubMed] [Google Scholar]
- Keinan A, Sandbank B, Hilgetag CC, Meilijson I, Ruppin E (2004a): Fair attribution of functional contribution in artificial and biological networks. Neural Comput 16:1887–915. [DOI] [PubMed] [Google Scholar]
- Keinan A, Kaufman A, Sachs N, Hilgetag CC, Ruppin E (2004b): Fair localization of function via multi‐lesion analysis. Neuroinformatics 2:163–8. [DOI] [PubMed] [Google Scholar]
- Kincade JM, Abrams RA, Astafiev SV, Shulman GL, Corbetta M (2005): An event‐related functional magnetic resonance imaging study of voluntary and stimulus‐driven orienting of attention. J Neurosci 25:4593–604. [DOI] [PMC free article] [PubMed] [Google Scholar]
- Mah YH, Husain M, Rees G, Nachev P (2014): Human brain lesion‐deficit inference remapped. Brain 137:2522–2531. [DOI] [PMC free article] [PubMed] [Google Scholar]
- Mesulam MM (1985): Principles of Behavioral Neurology, F.A. Davis, Philadelphia, PA. 405 p. [Google Scholar]
- Mort DJ, Malhotra P, Mannan SK, Rorden C, Pambakian A, Kennard C, Husain M (2003): The anatomy of visual neglect. Brain 126:1986–1997. [DOI] [PubMed] [Google Scholar]
- Oldfield RC (1971): The assessment and analysis of handedness: The Edinburgh Inventory. Neuropsychologia 9:97–113. [DOI] [PubMed] [Google Scholar]
- Paus T (1996): Location and function of the human frontal eye‐field: A selective review. Neuropsychologia 34:475–483. [DOI] [PubMed] [Google Scholar]
- Petrides M, Pandya DN (2002): Association pathways of the prefrontal cortex and functional observations In: Stuss DT, Knight RT, editors. Principles of Frontal Lobe Function. Oxford; New York: Oxford University Press; p 31–50. [Google Scholar]
- Quentin R, Chanes L, Vernet M, Valero‐Cabré A (2015): Fronto‐parietal anatomical connections influence the modulation of conscious visual perception by high‐beta frontal oscillatory activity. Cereb Cortex 25:2095–2101. [DOI] [PMC free article] [PubMed] [Google Scholar]
- Quentin R, Elkin Frankston S, Vernet M, Toba MN, Bartolomeo P, Chanes L, Valero‐Cabré A (2016): Visual contrast sensitivity improvement by right frontal high‐beta activity is mediated by contrast gain mechanisms and influenced by fronto‐parietal white matter microstructure. Cereb Cortex 26:2381–2390. [DOI] [PMC free article] [PubMed] [Google Scholar]
- Rorden C, Brett M (2000): Stereotaxic display of brain lesions. Behav Neurol 12:191–200. [DOI] [PubMed] [Google Scholar]
- Rorden C, Fruhmann Berger M, Karnath HO (2006): Disturbed line bisection is associated with posterior brain lesions. Brain Res 1080:17–25. [DOI] [PubMed] [Google Scholar]
- Rousseaux M, Beis JM, Pradat‐Diehl P, Martin Y, Bartolomeo P, Bernati T, Chokron S, Leclercq M, Louis‐Dreyfus A, Marchal F, Perennou D, Prairial C, Rode G, Samuel C, Sieroff E, Wiart L, Azouvi P Azouvi P (2001): Presenting a battery for assessing spatial neglect. Norms and effects of age, educational level, sex, hand and laterality. Rev Neurol (Paris) 157:1385‐1400. [PubMed] [Google Scholar]
- Rushmore RJ, Valero‐Cabre A, Lomber SG, Hilgetag CC, Payne BR (2006): Functional circuitry underlying visual neglect. Brain 129:1803–1821. [DOI] [PubMed] [Google Scholar]
- Schenkenberg T, Bradford DC, Ajax ET (1980): Line bisection and unilateral visual neglect in patients with neurologic impairment. Neurology 30:509–517. [DOI] [PubMed] [Google Scholar]
- Shapley LS (1953): Stochastic games. Proc Natl Acad Sci USA 39:1095–1100. [DOI] [PMC free article] [PubMed] [Google Scholar]
- Smith DV, Clithero JA, Rorden R, Karnath HO (2013): Decoding the anatomical network of spatial attention. Proc Natl Acad Sci USA 110:1518–1523. [DOI] [PMC free article] [PubMed] [Google Scholar]
- Sprague JM (1966): Interaction of cortex and superior colliculus in mediation of visually guided behavior in the cat. Science 153:1544–1547. [DOI] [PubMed] [Google Scholar]
- Thiebaut de Schotten M, Dell'Acqua F, Forkel SJ, Simmons A, Vergani F, Murphy DG, Catani M (2011): A lateralized brain network for visuospatial attention. Nat Neurosci 14:1245–1246. [DOI] [PubMed] [Google Scholar]
- Thiebaut de Schotten M, Urbanski M, Duffau H, Volle E, Levy R, Dubois B, Bartolomeo P (2005): Direct evidence for a parietal‐frontal pathway subserving spatial awareness in humans. Science 309:2226–2228. [DOI] [PubMed] [Google Scholar]
- Thut G, Nietzel A, Pascual‐Leone A (2005): Dorsal posterior parietal rTMS affects voluntary orienting of visuospatial attention. Cereb Cortex 15:628–638. [DOI] [PubMed] [Google Scholar]
- Urbanski M, Thiebaut de Schotten M, Rodrigo S, Oppenheim C, Touzé E, Méder JF, Moreau K, Loeper‐Jeny C, Dubois B, Bartolomeo P (2011): DTI‐MR tractography of white matter damage in stroke patients with neglect. Exp Brain Res 208:491–505. [DOI] [PubMed] [Google Scholar]
- Vallar G, Perani D (1986): The anatomy of unilateral neglect after right‐hemisphere stroke lesions. A clinical/CT‐scan correlation study in man. Neuropsychologia 24:609–622. [DOI] [PubMed] [Google Scholar]
- Verdon V, Schwartz S, Lovblad KO, Hauert CA, Vuilleumier P (2010): Neuroanatomy of hemispatial neglect and its functional components: A study using voxel‐based lesion‐symptom mapping. Brain 133:880–894. [DOI] [PubMed] [Google Scholar]
- Vernet M, Quentin R, Chanes L, Mitsumasu A, Valero‐Cabre A (2014): Frontal eye field, where art thou? Anatomy, function, and non‐invasive manipulation of frontal regions involved in eye movements and associated cognitive operations. Front Integr Neurosci 22:8–66. [DOI] [PMC free article] [PubMed] [Google Scholar]
- Vuilleumier P, Hester D, Assal G, Regli F (1996): Unilateral spatial neglect recovery after sequential strokes. Neurology 46:184–189. [DOI] [PubMed] [Google Scholar]
- Waberski TD, Gobbele R, Lamberty K, Buchner H, Marshall JC, Fink GR (2008): Timing of visuo‐spatial information processing: Electrical source imaging related to line bisection judgements. Neuropsychologia 46:1201–1210. [DOI] [PubMed] [Google Scholar]
- Wojciulik E, Husain M, Clarke K, Driver J (2001): Spatial working memory deficit in unilateral neglect. Neuropsychologia 39:390–396. [DOI] [PubMed] [Google Scholar]
- Youden WJ (1950): Index for rating diagnostic tests. Cancer 3:32–35. [DOI] [PubMed] [Google Scholar]
- Zavaglia M, Forkert ND, Cheng B, Gerloff C, Thomalla G, Hilgetag CC (2015): Mapping causal functional contributions derived from the clinical assessment of brain damage after stroke. Neuroimage Clin 9:83–94. [DOI] [PMC free article] [PubMed] [Google Scholar]
- Zavaglia M, Hilgetag CC (2016a): Causal functional contributions and interactions in the attention network of the brain: An objective multi‐perturbation analysis. Brain Struct Funct 221:2553–2568. [DOI] [PubMed] [Google Scholar]
- Zavaglia M, Forkert ND, Cheng B, Gerloff C, Thomalla G, Hilgetag CC (2016b): Technical considerations of a game‐theoretical approach for lesion symptom mapping. BMC Neurosci 17:40. [DOI] [PMC free article] [PubMed] [Google Scholar]
- Zhang Y, Kimberg DY, Coslett HB, Schwartz MF, Wang Z (2014): Multivariate lesion‐symptom mapping using support vector regression. Hum Brain Mapp 35:5861–5876. [DOI] [PMC free article] [PubMed] [Google Scholar]