Abstract
Purpose
To compare the apparent diffusion coefficient (ADC) of hyperpolarized (HP) [13C, 15N]urea to the ADC of endogenous water in healthy and fibrotic mouse liver.
Materials and Methods
ADC measurements for water and [13C]urea were made in agarose phantoms at 14.1T. Next, the ADC of water and injected HP [13C, 15N]urea were measured in eight CD1 mouse livers before and after induction of liver fibrosis using CCl4. Liver fibrosis was quantified pathologically using the modified Brunt fibrosis score and compared to the measured ADC of water and urea.
Results
In cell-free phantoms with 12.5% agarose, water ADC was nearly twice the ADC of urea (1.93×10⁻³ mm2/s vs. 1.00×10⁻³ mm2/s). The mean ADC values of water and [13C, 15N]urea in healthy mouse liver (±SD) were nearly identical [(0.75± 0.11)× 10−3 mm2/s and (0.75 ±0.22)×10−3 mm2/s, respectively]. Mean water and [13C,15N]urea ADC values in fibrotic liver (±SD) were (0.84± 0.22)×10−3 mm2/s and (0.75± 0.15)× 10−3 mm2/s, respectively. Neither water nor urea ADCs were statistically different in the fibrotic livers compared to baseline (P = 0.14 and P = 0.99, respectively). Water and urea ADCs were positively correlated at baseline (R2 = 0.52 and P = 0.045) but not in fibrotic livers (R2 = 0.23 and P = 0.23).
Conclusion
ADC of injected hyperpolarized urea in healthy liver reflects a smaller change as compared to free solution than ADC of water. This may reflect differences in cellular compartmentalization of the two compounds. No significant change in ADC of either water or urea were observed in relatively mild stages of liver fibrosis.
Diffusion-weighted magnetic resonance imaging (DWI-MRI) techniques produce image intensities related to the Brownian motion of molecules. In the presence of strong magnetic field gradients, molecules that move freely lose signal more rapidly than molecules whose motions are restricted. Therefore, DWI contains information about the local environments of the molecules being imaged. Conventionally, DWI is performed using endogenous water molecules. In clinical and preclinical settings, DWI has been used to measure molecular movement of water in order to study tissue microstructure.1–ô8
Recently, hyperpolarized (HP) 13C-MRI has emerged as a tool for monitoring perfusion and metabolism in vivo. Using dynamic nuclear polarization (DNP), carbon-containing compounds are prepared outside of the MRI scanner to achieve an MR signal enhancement greater than 50,000-fold compared to standard conditions.9 HP 13C substrates have been previously used to image perfusion10,11 and metabolism.12,13 Recently, there has been considerable interest in measuring the diffusion properties of exogenously administered HP compounds.14–ô17 Because HP compounds have different chemical interactions with tissue and different compartmentalization than water, diffusion measurements using these compounds provide potentially novel biophysical information about tissues.
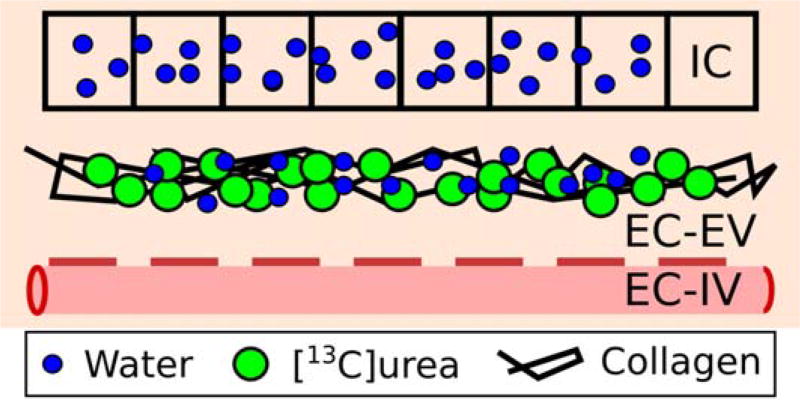
The goal of this study was to compare the apparent diffusion coefficient (ADC) of an injected HP probe, [13C,15N]urea, with the ADC of water within the mouse liver. Although water is both intracellular and extracellular, urea is potentially largely extracellular on the time scales and concentration of the HP experiment18,19 (Fig. 1). Our hypothesis is that this difference in compartmentalization would be reflected in differences in ADC values, both in healthy and fibrotic liver.
FIGURE 1.
Diagram of the liver spaces: intracellular space (IC), extracellular extravascular space (EC-EV), and extracellular intravascular space (EC-IV). Endogenous water is found both in the intra- and extracellular space, while exogenously injected hyperpolarized urea is mainly extracellular. Fibrosis is characterized by collagen deposition in the EC-EV space.
Materials and Methods
All experiments were performed using a Varian 14.1 T vertical bore preclinical MR scanner (Agilent, Palo Alto, CA) equipped with high-performance gradients (maximum gradient strength =100 G/ cm, maximum slew-rate= 556 G/cm/ms) and a dual-tuned volume coil for 13C and 1H imaging.
1H and 13C DWI in Agarose Phantoms
Two sets of agarose phantoms were prepared: one with [13C]urea (Sigma Aldrich, Miamisburg, OH) dissolved in it, the other without. Approximately 0.61 g of [13C]urea was added to 10 ml of water with 0%, 2.5%, 5%, and 12.5% w/w agarose (AllStar Scientific, Sunnyvale, CA), for a final concentration of 1M [13C]urea in each solution. Urea-free phantoms were prepared at the same agarose concentrations.
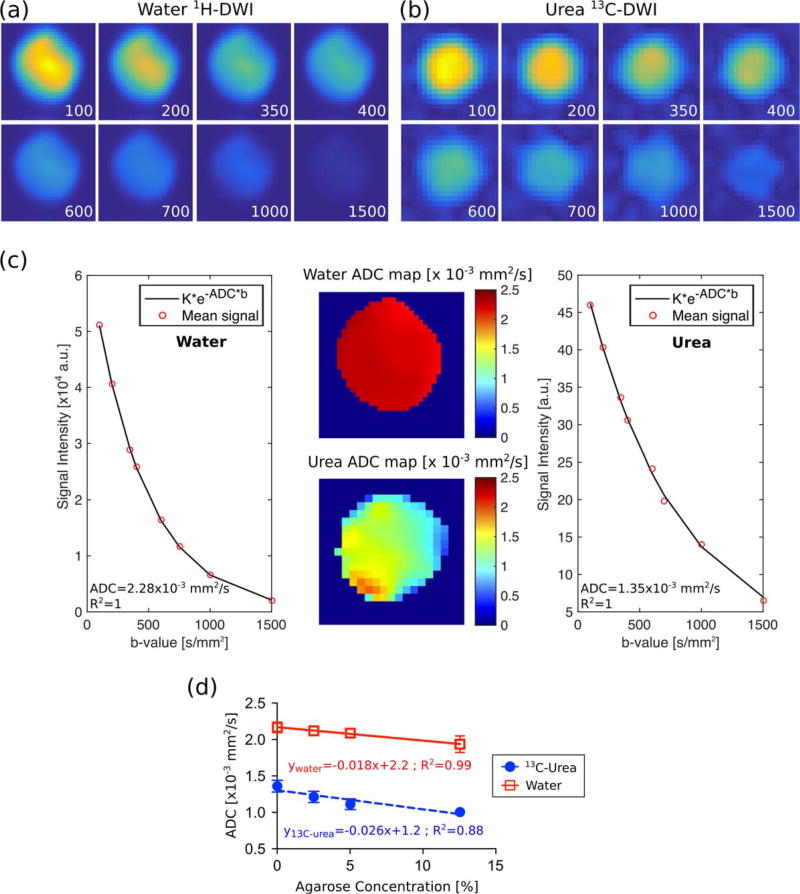
1H-DW images for agarose phantoms (Fig. 2a) were acquired using a double spin echo (SE) sequence with a single shot, flyback echo-planar imaging (EPI) readout15 with the following parameters: 16×16 matrix, 40mm field of view (FOV), 5 mm slice with a constant slice-select gradient, b = {1500, 1000, 750, 600, 400, 350, 200, 100} s/mm2, flip angle = 60° for all b-values, diffusion time = 20 msec, TR = 15 sec to allow for full recovery of the magnetization (T1 of water protons was about 3 sec), and one average for each b-value.
FIGURE 2.
DWI and ADC measured in cell-free agarose phantoms. Representative dataset (0% agarose) for (a) water 1H-DWI and (b) urea 13C-DWI with b-value factors displayed on each image in units of s/mm2. (c) ADC maps and fit of the mean of the signal intensity for the dataset in (a,b). (d) The ADC decreased with increased agarose concentration. Error bars for the first three water experiments and the fourth urea experiment are smaller than the marker.
The same SE-EPI acquisition was performed to obtain 13C-DW images in agarose phantoms with added [13C]urea (Fig. 2b) changing the following parameters: 80mm FOV, 10mm slice with a constant slice-select gradient, TR = 150 sec (T1 of [13C]urea in solution was about 35 sec), and 1 average for each b-value.
DWI experiments were performed at room temperature. Acquisition was started 60 minutes after the phantom tubes had been inserted into the magnet to allow the gel to reach a stable temperature. In order to ensure that the repetition time was long enough for full signal recovery, the T1 relaxation time constant of each agarose phantom was measured using an inversion recovery sequence, with TR > 5 × T1.
Hyperpolarized [13C, 15N]urea Sample Preparation
A stock solution was prepared containing 6.3M [13C, 5N]urea (Sigma Aldrich), glycerol, 19mM trityl radical OX063 (Oxford Instruments, Abingdon, UK) and 0.2 mM gadolinium chelate (Guerbet, Roissy France). A 90-mg aliquot of this solution was inserted into an Oxford HyperSense DNP polarizer operating at 3.35 T and 1.3 K. The frozen sample was irradiated for 1.5 hours with 25 mW microwaves at ~94 GHz. The sample was then rapidly dissolved in 4.5 g of a solution containing 10mM phosphate-buffered saline (neutral pH) to obtain a final urea concentration of ~100mM.
In Vivo MRI Protocol
For anatomic localization, axial and coronal T2-weighted images with fat saturation and respiratory gating were obtained with the following parameters: TR = 1200 msec, TE ~11 msec, 1 mm slice thickness, 256 × 256 matrix (axial) or 256 × 192 matrix (coronal), 32 mm × 32 mm FOV (axial) or 40 mm × 30 mm FOV (coronal).
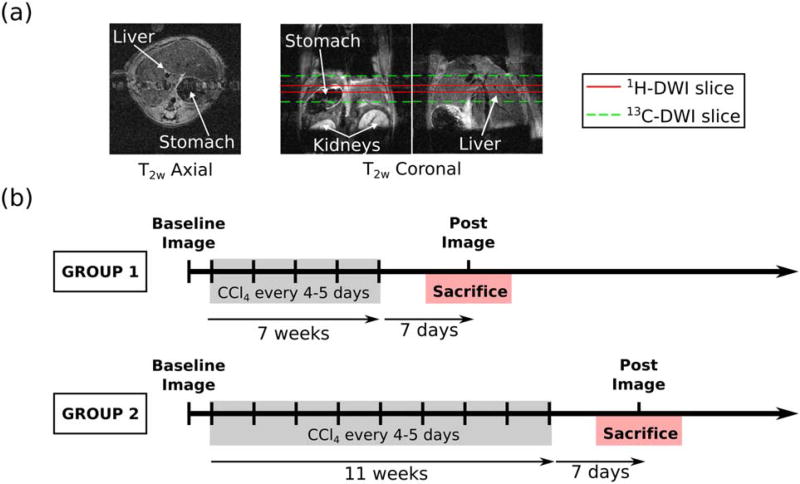
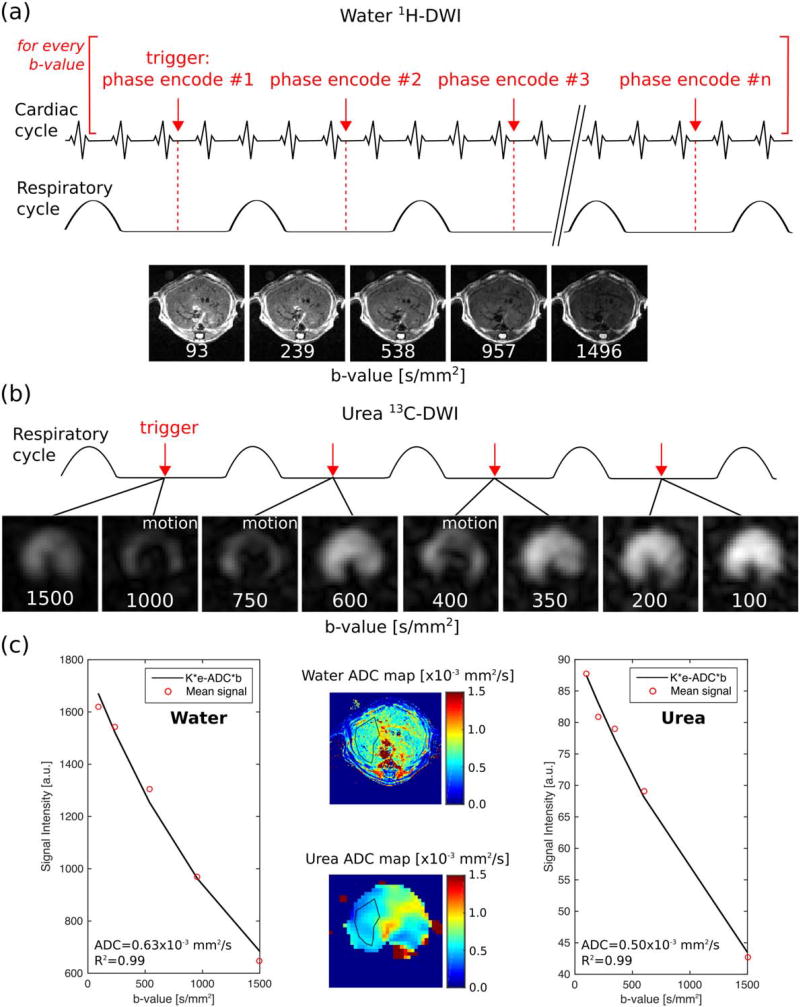
For proton and carbon DWI, single central axial slices were chosen through the liver (Fig. 3a). 1H-DWI were acquired using a diffusion-weighted spin echo sequence with the following parameters: 128 × 128 matrix, 32 mm FOV, 2 mm slice, flip angle = 90° for all b-values, and diffusion time =13 msec (Fig. 4a). The choice of b-values for each set of experiments is detailed in the sections below. Combined cardiac and respiratory triggering was employed. Each acquisition was triggered to occur at the middle of the respiratory cycle and the beginning of the cardiac R-wave to minimize motion artifacts from the heart and diaphragm, with a minimum TR of 1.2 sec (dependent on the coincidence of respiratory and cardiac triggering signals). A single phase encode line was measured during each acquisition, leading to a total acquisition time of ~4 minutes for every b-value.
FIGURE 3.
(a) Representative T2-weighted abdominal anatomic axial and coronal images of a mouse with the slab boundaries for the DWI experiments shown in red for 1H-DWI and green for 13C-DWI. (b) Timeline for liver fibrosis studies. MR images were acquired prior to the first CCl4 treatment and 1 week following the final CCl4 treatment. Mice were sacrificed on the same day of the final imaging session.
FIGURE 4.
DWI acquisition scheme and representative 1H- and 13C-DWI dataset. (a) Schematic representation of the trigger time-points for acquisition and 1H-DWI. (b) 13C-DWI and acquisition scheme: two images were acquired during each respiratory cycle. (c) 1H and 13C ADC maps with a typical ROI drawn on them (middle) and fits of the data excluding images corrupted by motion (sides).
13C-DWI studies were performed following injection of 350 µL of HP [13C, 15N]urea through the mouse tail vein over 15 sec. The concentration of urea that was injected, once diluted by the blood volume of the mouse, was similar to the endogenous plasma urea concentration (~8mM). The imaging acquisition began 20 sec after the beginning of the injection. 13C-DWI were acquired using the SE-EPI readout described for phantom data acquisition in the section above, with the following parameters: 16×16 matrix, 32 mm FOV, 8 mm effective slice thickness, and diffusion time = 20 msec. A thicker slab was chosen compared to proton imaging due to signal-to-noise (SNR) limitations. A nonselective adiabatic RF pulse (HS-AFP, 15 msec duration) was used for refocusing. A variable flip angle schedule was used to compensate for magnetization utilization and gradient scaling to achieve a similar image SNR in each b-value.17 The b-value and flip angle scheme used in each set of experiments is described in the sections below.
The slice-select gradient was scaled to account for the expected signal deviation due to slice-profile effects.20 Respiratory triggering was used to minimize signal loss due to bulk motion, leading to the acquisition of two b-values per respiratory cycle (Fig. 4b). With an acquisition time of 100 msec/b-value and respiratory rate of ~60 breaths/min, the total acquisition time was ~4 sec. Cardiac gating was not employed for 13C imaging because the MR acquisition caused excessive electronic interference with the gating unit, making triggering unreliable. A possible reason for the excessive electronic interference was the increased peak B1 power levels required for 13C acquisition. Therefore, 13C-DWI images were acquired with respiratory gating alone. Images that were severely corrupted due to cardiac motion were discarded prior to performing ADC fits (see below).
A comparatively slower spin echo acquisition scheme was used for proton imaging because EPI acquisitions at the higher proton frequency (600 MHz, compared to 150 MHz for 13C) suffered from extensive artifacts, eg, increased susceptibility observed at higher frequencies.
Animal Preparation
The study was performed using male CD1 mice (weight=45–55 g, Charles River Laboratories, Wilmington, MA) under a protocol approved by the local Institutional Animal Care and Use Committee (IACUC). Each mouse was anesthetized immediately prior to the MRI experiments by administration of inhalational isoflurane. A tail vein cannula was inserted for HP agent administration, and its patency maintained with heparin mixed in normal saline (4–8 U/ml). Each animal was placed on a warm pad inside the dual-tuned coil to maintain its body temperature at 37°C. Cardiac and respiratory rates were monitored throughout the experiment. Two sets of animal experiments were performed: 1) test–retest variability of liver diffusion measurements in healthy mice (n = 3), and 2) diffusion measurements in a mild liver fibrosis model (n = 8).
Test–Retest Variability
In order to establish the test–retest variability of proton and carbon diffusion measurements in the liver, the two MR diffusion protocols described above were performed on 3 different days in three different healthy CD1 mice.
The b-values used for the 1H-DWI acquisitions here were {62, 111, 173, 250, 563, 695} s/mm2, flip angle = 90° for all b-values, and a single average for each b-value. For 13C-DWI measurements, eight b-values were acquired in decreasing order: b = {700, 600, 500, 400, 300, 200, 50, 50} s/mm2, with their corresponding flip angles = {31°, 32°, 33°, 34°, 37°, 41°, 45°, 90°}, and a single average for each b-value.
The mean and standard deviation (SD) of the three measurements for each animal were computed.
Liver Fibrosis Model
Liver fibrosis was induced in eight male CD1 mice by administering 1 µL/g of a 1:7 mixture of carbon tetrachloride (CCl4) and olive oil via intraperitoneal injection once every 4–5 days.21 Images were acquired at baseline and either 7 weeks (n = 4) or 11 weeks (n = 4) after the start of the CCl4 injections using the same imaging protocol described above (Fig. 3b). Imaging was performed 1 week after the final CCl4 dose in order to minimize acute inflammatory effects. Based on the ADC measured in the initial variability studies (see Results), higher b-values were used in liver fibrosis studies, with b ={1500, 1000, 750, 600, 400, 350, 200, 100} s/mm2, number of averages = {1, 1, 2, 4, 4}, and flip angle = 90° for all b-values for 1H-DWI. For 13C-DWI, b = {93, 239, 538, 957, 1496} s/mm2 and their corresponding flip angles = {39°, 33°, 32°, 33°, 34°, 40°, 47°, 90°} with a single average for each b-value.
Histology
At the end of the post-CCl4 treatment imaging session, each mouse was sacrificed. Each of the liver lobes was harvested for different types of analysis including histology. Four large entire cross-sections of liver were taken at separate depths at least 40 sections apart and from two different liver lobes. Hematoxylin and eosin-stained slides were examined and graded according the following factors: presence of necrosis, centrizonal inflammation grade (grade 1 up to 33%, grade 2 up to 66%, grade 3 maximum), number of centrizonal pigmented macrophages per high-power field, and number of Councilman bodies per high-power field.
All sections of liver were stained for collagen using trichrome and Sirius red and were blindly examined by a board-certified pathologist with expertise in clinical and research liver pathology. The histologic findings in this study were fairly homogeneous. Scoring was performed by reviewing 10 high-power fields. Given the centrizonal nature of CCl4-induced fibrosis, a fibrosis score was assigned based on Zhao et al22 (modified Brunt staging: a score of 0 given to healthy liver and a score of 6 given for complete cirrhosis). Since ADCs were taken from an axial slide through the middle of the liver, the histology observations of the central cross-section of the liver were used to understand the DWI results.
Data Analysis
Raw data from all images were corrected for the RF flip angle applied. 13C-DWI were zero-filled in the scanner from a 16 × 16 to a 32×32 matrix and then resized to match the 1H-DWI matrix size (128 × 128) using nearest-neighbor interpolation in MatLab (MathWorks, Natick, MA). Because the acquisition of 13C-DW images was short (3–4 sec) compared to the T1 of the HP com-pound (T1 of [13C, 15N]urea in solution at 14T is ~35 sec), signal loss from T1 decay was neglected during the ADC fit.
For analysis, a region-of-interest (ROI) was drawn manually over the thickest part of the liver from the high-resolution 1H spin-echo images and applied to 13C data. The ROI included 300–600 voxels on average (ie, 5–10 voxels of the coarse 16 × 16 matrix).
In order to calculate ADC values, voxels with low SNRs were discarded (below 5% of the maximum signal for 1H-DWI or below 15% of the maximum signal for 13C-DWI, using the low b-value image as reference). Images corrupted by motion, which had obvious artifacts when compared visually with the other images, were excluded from the calculations (as shown in Fig. 4b). In order to prevent bias, the decision to discard images based on motion artifact was made before any ADC fitting was performed. The average signal intensity was calculated from the ROI placed on each of the DW images and the results fitted to a monoexponential decay. This method was chosen to be robust against voxels with low SNR and the coefficient of determination of the fit (R2) provided qualitative information on the overall quality of exponential fitting. The mean ADC value of the set of eight mice was computed along with the standard deviation of the mean (SD). Paired t-tests were performed on the baseline and post-CCl4 administration groups to determine statistical significance of the results. P < 0.05 was considered significant. 95% confidence intervals (95% CI) were also computed.
Results
ADCs in Agarose Phantoms
Figure 2 displays the dataset for 0% agarose solution (Fig. 2a – c) as an example of the DWI and ADC maps acquired, and the ADCs measured at different agarose concentrations (Fig. 2d). Both water and [13C]urea ADC decreased as the agarose concentration increased. Comparing the results in agarose-free with those in 12.5% agarose solutions, ADC values (mean ± SD) of water and [13C]urea decreased by 11% – (2.16±0.07)×10−3 mm2/s vs. (1.93 ± 0.11)×10−3 mm2/s – and 26% – (1.36±0.08) × 10−3 mm2/s vs. (1.00 ± 0.04) × 10−3 mm2/s, respectively. The T1 of water decreased by 11% between the agarose-free and the 12.5% agarose solution (2.90 sec vs. 2.58 sec), while the T1 of [13C]urea dropped by 25% (34.75 sec vs. 26.13 sec).
Test–Retest Variability of 1H-DWI and Hyperpolarized 13C-DWI Acquisitions
On average, the standard deviations (variability) for 1H-DWI and 13C-DWI measurements performed across separate days were similar: 0.08 × 10⁻³ mm2/s for 13C-DWI measurements and 0.10×10⁻³ mm2/s for 1H-DWI measurements. The individual results for each mouse are shown in Table 1.
TABLE 1.
Test–Retest Variability
| Test–retest ADC measurements [×10−3 mm2/s]
|
|||
|---|---|---|---|
| Animal 1 (n = 3) | Animal 2 (n = 3) | Animal 3 (n = 3) | |
| [1H]water | 0.79±0.10 | 0.99±0.10 | 0.83±0.11 |
|
| |||
| [13C, 15N]urea | 0.79±0.017 | 0.64±0.10 | 1.57±0.12 |
[1H]water and [13C, 15N]urea ADCs measurements in three different animals, each of which was scanned on 3 different days. Each entry in the table represents the mean ADC ± standard deviation for a set of three measurements in the same animal.
Baseline ADCs of Healthy Mouse Liver In Vivo
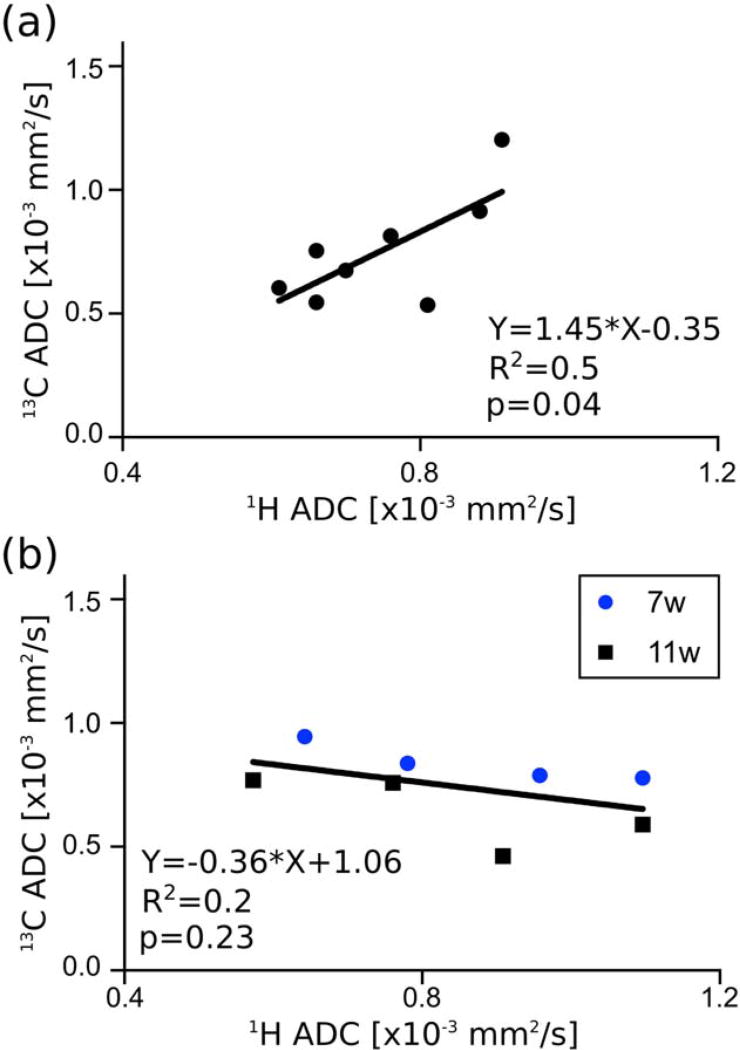
The mean (±SD) water ADC in the liver of the eight animals was (0.75±0.11)×10−3 mm2/s, and the [13C,15N]urea ADC was (0.75±0.22)×10−3 mm2/s. No significant difference was observed between water and [13C,15N]urea ADCs (P = 0.97; mean of the pairwise difference in the ADC values for each animal = 0.0025 ×10⁻³ mm2/s; 95% CI = (–0.135 to 0.14)×10−3 mm2/s). Individual results for each mouse are given in Table 2. Moreover, the ADC of HP [13C,15N]urea and water in the liver were positively correlated across animals, with R2 = 0.52 and P = 0.045 (Fig. 5a).
TABLE 2.
Baseline and Post-CCl4 Treatment Apparent Diffusion Coefficients (ADC) for Each CD1 Mouse
| BASELINE ADC [×(10−3mm2/s] |
POST-CCl4 ADC [×(10−3 mm2/s] |
Pathology | ||||||||
|---|---|---|---|---|---|---|---|---|---|---|
|
|
|
|
||||||||
| ID | [1H] water |
[13C,15N] urea |
Treatment Duration [weeks] |
[1H] water |
[13C,15N] urea |
Fibrosis pattern |
Modified Brunt staging |
Centrizonal inflammation grade |
Centrizonal pigmented macrophages per HPF |
Councilman bodies per 10 HPF |
| 1 | 0.66 | 0.54 | 7 | 0.78 | 0.85 | Early centrizonal | 1–2 | 0–1 | 4 | 1 |
| R2 = 0.93 | R2 = 0.89 | R2 = 0.97 | R2 = 0.98 | |||||||
|
| ||||||||||
| 2 | 0.76 | 0.81 | 7 | 0.96 | 0.80 | Centrizonal pericellular | 2 | 0–1 | 3 | 3 |
| R2 = 0.80 | R2=1 | R2 = 0.89 | R2 = 0.95 | |||||||
|
| ||||||||||
| 3 | 0.91 | 1.2 | 7 | 1.10 | 0.79 | Centrizonal with early septal | 2–3 | 1–2 | 4 | 4 |
| R2 = 0.97 | R2 = 0.96 | R2 = 0.86 | R2 = 0.93 | |||||||
|
| ||||||||||
| 4 | 0.81 | 0.53 | 7 | 0.64 | 0.96 | Centrizonal pericellular | 2 | 0–1 | 12 | 0 |
| R2 = 0.97 | R2 = 0.98 | R2 = 0.65 | R2 = 0.81 | |||||||
|
| ||||||||||
| 5 | 0.66 | 0.75 | 11 | 0.91 | 0.47 | Centrizonal pericellular | 2 | 0–1 | 6 | 2 |
| R2 = 0.99 | R2 = 0.99 | R2 = 0.91 | R2 = 0.99 | |||||||
|
| ||||||||||
| 6 | 0.61 | 0.60 | 11 | 0.57 | 0.78 | Centrizonal with early septal | 2–3 | 1 | 8 | 3 |
| R2 = 0.85 | R2 = 0.96 | R2 = 0.84 | R2 = 0.83 | |||||||
|
| ||||||||||
| 7 | 0.88 | 0.91 | 11 | 1.10 | 0.60 | Centrizonal with early septal | 2–3 | 1 | 8 | 2 |
| R2 = 0.99 | R2 = 0.97 | R2 = 0.93 | R2 = 0.64 | |||||||
|
| ||||||||||
| 8 | 0.70 | 0.85 | 11 | 0.76 | 0.77 | Centrizonal pericellular | 2 | 1–2 | 2–3 | 4 |
| R2=l | R2 = 0.98 | R2 = 0.73 | R2 = 0.75 | |||||||
|
| ||||||||||
| Mean | 0.75 ±0.11 | 0.75 ± 0.22 | 0.84 ± 0.22 | 0.75 ±0.15 | ||||||
Values shown are the ADC measured in units of 10−3 mm2/s, along with R2 , which is the coefficient of variation for the exponential fit. Mice 1–4 were treated with CCl4 for 7 weeks and mice 5–8 were treated with CCl4 for 11 weeks. The last row displays the mean ± standard deviation of the eight measurements. Centrizonal inflammation grade: 1 < 33%, 2 < 66% and 3 < 100%. All inflammation demonstrated a lymphocyte-predominant pattern.
FIGURE 5.
(a) Correlation of 13C and 1H ADC measured in each mouse at baseline and (b) after 7 or 11 weeks of treatment with CCl4. See also Table 2.
ADCs in the Mouse Liver In Vivo After CCl4 Treatment
The mean (±SD) water ADC in the liver of the eight animals was (0.84±0.22)× 10−3 mm2/s. The mean (6SD) [13C,15N]urea ADC in the liver of the eight animals was (0.75 ± 0.15) × 10−3 mm2/s. Individual results for each mouse are given in Table 2.
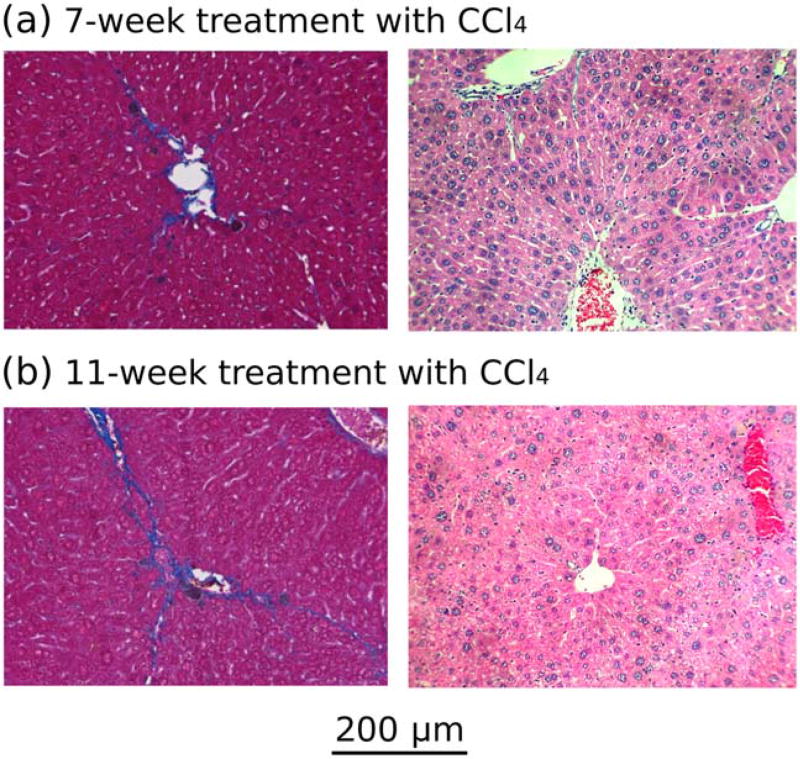
All of the animals developed moderate fibrosis with a modified Brunt stage between 1 and 3 out of a maximum score of 6 (Table 2, right-hand column). The pattern of fibrosis was uniform. Example histologic images are shown in Fig. 6. None of the animals that received CCl4 died or experienced weight loss.
FIGURE 6.
Trichrome (left) and H&E (right) images of the livers of a representative mouse from (a) group 1 (7 weeks of CCl4 treatment) and (b) group 2 (11 weeks of CCl4 treatment). Based on a modified Brunt staging system, (a) developed fibro-sis stage 2 with centrizonal pericellular fibrosis, and (b) developed fibrosis stage 2–3 with centrizonal early septal fibrosis.
On histologic examination, no necrosis was observed in any of the animals’ livers. The mild lympho-histiocytic inflammation seen in our experimental animals with the presence of scattered dead hepatocytes (Councilman bodies) was indicative of mild chronic injury. The significant presence of centrizonal macrophage was congruent with the prior treatment (7 days earlier) and signified a reparative cleanup process. As carbon tetrachloride damage was mostly centrizonal, this cleanup process was consistent with our injury model.
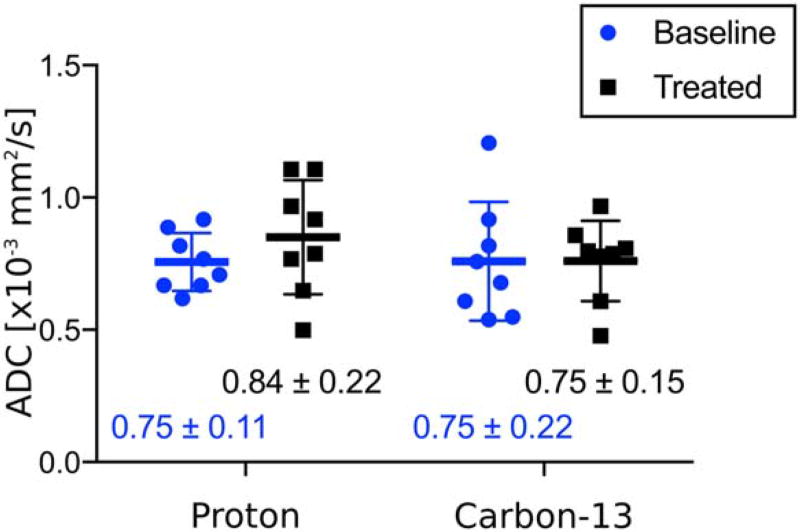
Figure 7 compares the baseline ADCs (blue dots) with the post-CCl4 treatment ADCs (black squares). The average change in water ADC following treatment for each animal was +0.094×10⁻³ mm2/s, with 95% CI = (−0.04 to 0.23) × 10−3 mm2/s. Average change in [13C,15N]urea ADC was + 0.0012×10⁻³ mm2/s, with 95% CI = (−0.26 to 0.26) × 10−3 mm2/s. Neither change was statistically significant (water: P = 0.14; urea: P = 0.99).
FIGURE 7.
Comparison of baseline and post-CCl4 treatment ADCs of the right lobe of the liver for water (proton) and [13C, 15N]urea (carbon). The mean (±SD) of each group is displayed under each dataset.
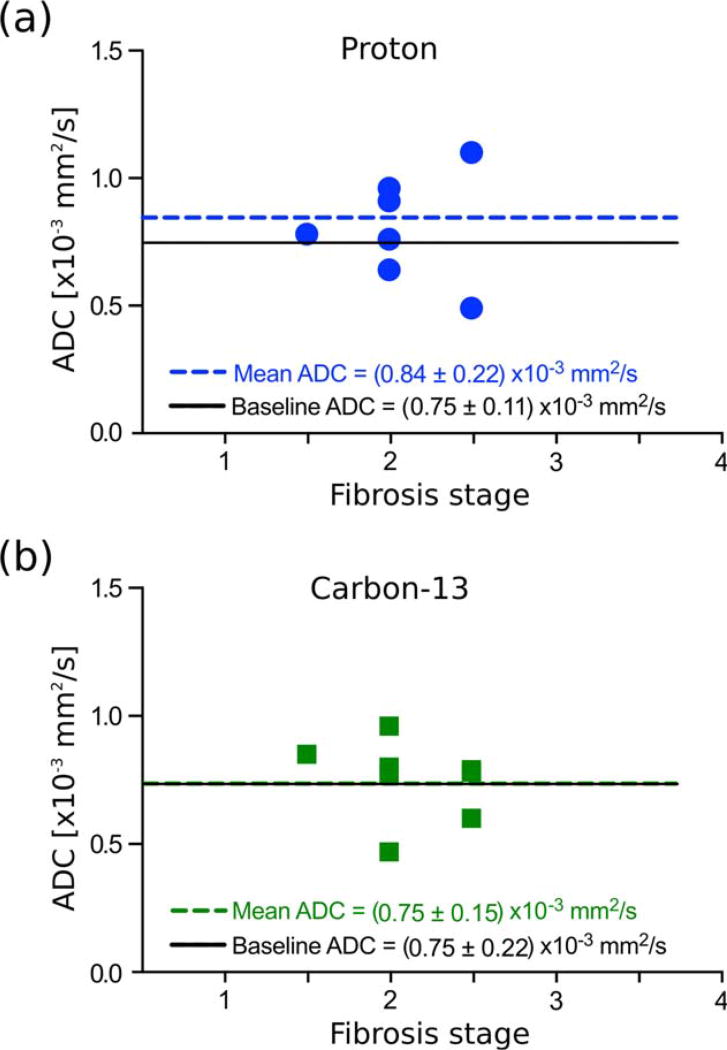
No significant correlation was observed between either ADC of HP [13C,15N]urea or water and liver fibrosis grade (urea: R2 50.06 and P = 0.56; water: R2 = 0.04 and P =0.62) (Fig. 8). Furthermore, although HP [13C, 15N]urea and water ADC correlated with each other in healthy liver, no such correlation was observed in fibrotic liver (R2 = 0.23 and P = 0.23, Fig. 5b).
FIGURE 8.
Post-CCl4 treatment ADCs of the right lobe of the liver for different stages of fibrosis (a) for water (proton) and (b) [13C, 15N]urea (carbon). These data are also shown in Fig. 7. The mean ADC across all fibrosis stages is shown with a dashed line, and the baseline ADC is shown with a solid black line.
Discussion
Diffusion measurements for both water and [13C]urea were acquired in cell-free phantoms with different concentrations of agarose gel, which were used to model movement restriction in tissue. In an agarose-free solution at room temperature, the ADC of water was 1.6 times larger than the ADC 3 of [13C]urea. This result agrees with theory, given that the molecular weight of urea is ~3 times higher than water. Using Arnold’s equation, which states that diffusivity is inversely proportional to the square root of the molecular weight and the square of the molecular diameter (eq. 40 in Ref. 23), the larger size of urea should make the diffusivity 2.1 times smaller than it is for water (parameters used: molecular weight of water =18, molecular weight of urea = 61, diameter of water = 2.75 Å,24 diameter of urea = 4.4 Å25).
In this study we compared the ADC of an exogenously injected HP probe, [13C, 15N]urea, in the mouse liver, with the ADC of water, which is an endogenous compound. [13C, 15N]urea, rather than [13C]urea, was chosen for in vivo experiments because it suffers from less low-field quadrupolar T1 relaxation than [13C]urea at low magnetic fields, minimizing polarization loss during transport of the sample from the polarizer to the MR spectrometer. In addition, the SE-EPI pulse sequence used for in vivo acquisition benefited from the longer T2 relaxation time of [13C, 15N]urea.26 For the thermally polarized experiments performed in phantoms at 14.1, low-field relaxation was not an issue, so [13C]urea was used in order to minimize expense.
DWI of the mouse liver is technically challenging due to the small liver size as well as rapid respiratory and cardiac motion. Using a combination of respiratory triggering and fast imaging enabled by high-performance gradients, we were able to achieve robust and reproducible HP 13C diffusion measurements acquired from the same animals over several days, with a standard deviation for repeated measurements of each animal of ~0.10 × 10⁻³ mm2/s. Although water and HP [13C, 15N]urea DWI measurements were performed with different slice thicknesses, by choosing an ROI over the thickest part of the liver and using ROIs containing over 300 voxels we attempted to minimize discrepancies. In our test–retest variability measurements, one animal had a much higher [13C, 15N]urea ADC in healthy liver compared to any other animal we measured. The origin of this anomalously high ADC is uncertain. However, despite the abnormally high value, the test-retest standard deviation was similar to all other experiments.
In healthy liver, [13C, 15N]urea and water ADCs were similar (~0.75 × 10⁻³ mm2/s). Although the measured ADC of urea and water within the healthy liver were numerically similar, the liver water ADC reflected a much larger change from its free solution value (65% decrease) than the ADC of urea (44% decrease). The larger relative decrease in water ADC compared to urea ADC in tissue when compared to solution suggests that urea is in a relatively less restricted environment than water. One possible explanation for a larger restriction of water compared to urea is that endogenous water is contained within both intracellular and extracellular spaces, while the injected HP urea is chiefly extracellular. Urea has a low permeability across lipid bilayers, despite being a small molecule, and its transport across cell membrane occurs by facilitated diffusion.27 Because mammals excrete nitrogen mainly as urea, intracellular concentrations of urea are generally low, with a rapid transport out of the cell.18 In fact, Effros et al reported that higher concentrations of intracellular urea caused swelling of the hepatocytes.18 In our experiments, the estimated average concentration of injected HP [13C, 15N]urea was ~8.2mM (assuming dilution into a total blood volume of 1.7mL for every 20g of body weight).28 The injection of exogenous urea, added to the endogenous urea, approximately doubles the normal plasma urea concentration.29 Although the consequences of this concentration increase have not been studied, we did not observe any toxicity effects after injection. A moderate transient increase in the urea concentration probably does not produce any adverse effects, since the normal physiologic urea concentration in mouse blood has been reported to range between 8.5 and 5mM, 50–90 mg/dl.29
Although the net transport of urea is expected to remain from the intracellular space to the extracellular space, over time labeled urea can be expected to exchange into the intracellular pool.30 However, the unexpectedly high measured ADC of urea suggests that a significant portion of urea possibly remains extracellular on the time scale of our experiment (ie, 20 sec after injection). Further studies are required to confirm this possibility.
Cellular compartmentalization is only one potential explanation for the larger relative change in ADC for water compared to free solution. Another potential explanation we considered is that water might have stronger interactions (eg, hydrogen bonding) with extracellular matrix proteins than urea and, therefore, would experience more relative motion restriction than urea in tissue. In order to assess the effects of differential interactions with the extracellular matrix, we made measurements of urea and water ADC in cell-free agarose phantoms. In a gel containing 12.5% aga-rose, [13C]urea ADC was only 34% higher than that in the liver. Conversely, water ADC in 12.5% agarose only decreased by 11% from solution value, and remained about 2.6 times higher than the ADC measured in the liver. The observation that urea ADC remained much lower than water ADC in an acellular phantom suggests that differential matrix interactions alone are not sufficient to explain our in vivo results. However, because agarose does not completely mimic the composition of the extracellular matrix in the liver, it remains possible that altered interactions of water with the extracellular proteins plays a role in our observations.
Our results for ADC measurements of water and urea in solution agree with those of prior studies,15,31 as do the results for the water ADC of normal mouse liver.7,8 Using a spectroscopic DW sequence, Sogaard et al14 observed a similar compartmentalization effect in muscle with HP [1-13C]pyruvate as the extracellular agent, and H [1-13C]lactate as the intracellular compound. The ADC of the extracellular substrate was measured to be similar to the ADC in solution, while the ADC of the intracellular compound in the muscle was measured to be half of that in solution.
As a potential biomedical application of the differential compartmentalization of injected HP urea and endogenous water, we measured HP [13C, 15N]urea and water ADC in a mouse model of liver fibrosis. Our expectation was that because fibrosis mainly occurs in the extracellular extravascular space,32 HP urea ADC would be more sensitive to fibrosis than water ADC. However, after induction of liver fibrosis, no significant changes in urea or proton ADC were observed. Using the value for standard deviation determined in our test–retest variability measurements and a paired t-test with four animals, we expect an 80% chance of detecting a change of at least 0.2 × 10⁻³ mm2/s. Therefore, based on our results, we are confident the actual change in ADC for moderate fibrosis (if any) is less than 0.2 × 10⁻³ mm2/s.
Other than liver fibrosis, we did not observe any other significant liver pathology that could explain the ADC outcomes. Significant hepatocellular necrosis was not observed. We did observe a mild lymphocytic infiltrate as well as the presence of scattered dead hepatocytes, indicative of mild injury. It is uncertain what effect these factors would have on measured ADC. The lack of sinusoidal fibrosis mostly excludes the possibility of a hepatic vascular flow defect. One possible reason that we did not detect a change with progression of fibrosis is that there was not severe enough liver fibrosis in this mouse model to detect a significant change (maximum fibrosis grade was 3 on a scale from 0 to 6). This possibility is supported by the fact that we did not observe a decrease even in the proton ADC, which has been observed by other researchers using similar but more severe animal models of liver fibrosis4,7,8 and in humans with advanced fibrosis.33,34 In a study performed in a CCl4 rat model of liver fibrosis, 1H ADC decreased from ~(1.5 ± 0.3) × 10−3 mm2/s in healthy livers to ~(1.0 ± 0.2) × 10−3 mm2/s in fibrotic livers with 14% fibrosis volume density.4 Similarly, in another study where CCl4 was administered to rats for up to 8 weeks, the ADC decreased when compared to baseline, although there was also a large variability of the results: ADCs at baseline ranged between 0.6 and 1.1 (×10−3 mm2/s); ADCs in stage 2–3 fibrotic livers (4 weeks post-treatment) were between 0.4 and 1.0 (×10−3 mm2/s); and ADCs in cirrhotic livers (8 weeks post-treatment) ranged between 0.5 and 0.9 (×10−3 mm2/s).8 In all these studies, and also in ours, measurements were performed at least 2 days after the final CCl4 injection to exclude acute toxicity and inflammation effects in the results. The proton ADC decrease has also been observed in a C57BL/6 mouse model of diet-induced fibrosis,7 with a baseline ADC of ~0.85 × 10⁻³ mm2/s, a stage 2 fibrosis ADC of ~0.80 × 10⁻³ mm2/s, and a stage 3 fibrosis ADC of ~0.65 × 10⁻³ mm2/s. In mice, the sensitivity of the liver to CCl4-induced injury is known to be highly strain-specific,21,35 and future experiments with a more sensitive mouse strain will allow for comparison of HP urea and proton ADC in the setting of more severe liver fibrosis. Also, a larger rodent model with more advanced fibrosis may increase the sensitivity in detecting ADC changes and reduce measurement errors associated with high heart rates.
In addition to a lack of animals with advanced fibrosis, this study had several technical limitations. Because of EPI-related image artifacts at 14T, water diffusion images were acquired with a spin echo acquisition rather than a conventional EPI acquisition. For SNR reasons, 13C-DWI acquisitions were performed with thicker slices than water diffusion acquisitions, although we do not expect this to have a large effect on the average ADC. Cardiac gating might have been helpful in terms of the 13C acquisitions for reducing extra motion effects and artifacts, but is not currently possible for these acquisitions on our system. Finally, although the histologic section was chosen through the center of the liver to match as closely as possible the image plane used in the ADC measurements, it was not possible to achieve exact correspondence due to inevitable distortions occurring in the liver resection and histologic preparation.
Although no significant change in ADC was observed in the liver fibrosis model used in this work, we did observe a potential change in the relationship between HP urea and water ADC. At baseline, urea and water ADC were correlated, while after induction of fibrosis, no such correlation was observed. Although not definitive, this result suggests that HP urea and water ADC potentially did respond differently to liver fibrosis, justifying further studies.
In conclusion, we acquired HP [13C, 15N]urea ADC maps in healthy mouse liver and compared them to ADC maps measured using water. We achieved robust measurements, which showed repeatability on acquisitions performed on different days. To our knowledge, this is the first systematic comparison of water ADC maps to those of an exogenously injected substance in the liver, particularly in the context of a disease model. The results in healthy liver were consistent with differing compartmentalization of water and urea. Initial studies in a mouse model of liver fibrosis did not show changes in either HP urea or water ADC, potentially due to insufficient amounts of induced fibrosis. However, changes in the correlation between water and urea ADC before and after liver fibrosis is a new result and motivates future studies.
Acknowledgments
Contract grant sponsor: RSNA Research and Education Foundation; Contract grant sponsor: UCSF Liver Center; contract grant number: P30DK026743; Contract grant sponsor: National Institutes of Health (NIH); contract grant number: P41EB013598; R01EB016741.
We thank Dr. Peng Cao and Dr. Cornelius von Morze for fruitful discussions, and Mark Van Criekinge for technical support.
References
- 1.Han C, Huang S, Guo J, Zhuang X, Han H. Use of a high b-value for diffusion weighted imaging of peritumoral regions to differentiate high-grade gliomas and solitary metastases. J Magn Reson Imaging. 2015;42:80–86. doi: 10.1002/jmri.24747. [DOI] [PubMed] [Google Scholar]
- 2.Sun J-H, Jiang L, Guo F, Zhang X-S. Diagnostic significance of apparent diffusion coefficient values with diffusion weighted MRI in breast cancer: a meta-analysis. Asian Pac J Cancer Prev. 2014;15:8271–8277. doi: 10.7314/apjcp.2014.15.19.8271. [DOI] [PubMed] [Google Scholar]
- 3.Freiman M, Voss SD, Mulkern RV, Perez-Rossello JM, Callahan MJ, Warfield SK. In vivo assessment of optimal b-value range for perfusion-insensitive apparent diffusion coefficient imaging. Med Phys. 2012;39:4832–4839. doi: 10.1118/1.4736516. [DOI] [PMC free article] [PubMed] [Google Scholar]
- 4.Annet L, Peeters F, Abarca-Quinones J, Leclercq I, Moulin P, Van Beers BE. Assessment of diffusion-weighted MR imaging in liver fibro-sis. J Magn Reson Imaging. 2007;25:122–128. doi: 10.1002/jmri.20771. [DOI] [PubMed] [Google Scholar]
- 5.Wollin DA, Deng F-M, Huang WC, Babb JS, Rosenkrantz AB. Conventional and diffusion-weighted MRI features in diagnosis of metastatic lymphadenopathy in bladder cancer. Can J Urol. 2014;21:7454–7459. [PubMed] [Google Scholar]
- 6.Uchida Y, Yoshida S, Kobayashi S, et al. Diffusion-weighted MRI as a potential imaging biomarker reflecting the metastatic potential of upper urinary tract cancer. Br J Radiol. 2014;87:20130791. doi: 10.1259/bjr.20130791. [DOI] [PMC free article] [PubMed] [Google Scholar]
- 7.Anderson SW, Jara H, Ozonoff A, O’Brien M, Hamilton JA, Soto JA. Effect of disease progression on liver apparent diffusion coefficient values in a murine model of NASH at 11.7 Tesla MRI. J Magn Reson Imaging. 2011;33:882–888. doi: 10.1002/jmri.22481. [DOI] [PubMed] [Google Scholar]
- 8.Zhou IY, Gao DS, Chow AM, et al. Effect of diffusion time on liver DWI: An experimental study of normal and fibrotic livers. Magn Reson Med. 2014;72:1389–1396. doi: 10.1002/mrm.25035. [DOI] [PubMed] [Google Scholar]
- 9.Ardenkjaer-Larsen JH, Fridlund B, Gram A, et al. Increase in signal-to-noise ratio of >10,000 times in liquid-state NMR. Proc Natl Acad Sci U S A. 2003;100:10158–10163. doi: 10.1073/pnas.1733835100. [DOI] [PMC free article] [PubMed] [Google Scholar]
- 10.von Morze C, Bok RA, Reed GD, Ardenkjaer-Larsen JH, Kurhanewicz J, Vigneron DB. Simultaneous multiagent hyperpolarized 13C perfusion imaging. Magn Reson Med. 2014;72:1599–1609. doi: 10.1002/mrm.25071. [DOI] [PMC free article] [PubMed] [Google Scholar]
- 11.von Morze C, Larson PEZ, Hu S, et al. Imaging of blood flow using hyperpolarized [(13)C]urea in preclinical cancer models. J Magn Reson Imaging. 2011;33:692–697. doi: 10.1002/jmri.22484. [DOI] [PMC free article] [PubMed] [Google Scholar]
- 12.Dzien P, Kettunen MI, Marco-Rius I, et al. 13C magnetic resonance spectroscopic imaging of hyperpolarized [1-13C, U-2H5] ethanol oxidation can be used to assess aldehyde dehydrogenase activity in vivo. Magn Reson Med. 2015;73:1733–1740. doi: 10.1002/mrm.25286. [DOI] [PubMed] [Google Scholar]
- 13.Nelson SJ, Kurhanewicz J, Vigneron DB, et al. Metabolic imaging of patients with prostate cancer using hyperpolarized [1-13C]pyruvate. Sci Transl Med. 2013;5:198ra108. doi: 10.1126/scitranslmed.3006070. [DOI] [PMC free article] [PubMed] [Google Scholar]
- 14.Søgaard LV, Schilling F, Janich MA, Menzel MI, Ardenkjær-Larsen JH. In vivo measurement of apparent diffusion coefficients of hyperpolarized 13C–labeled metabolites. NMR Biomed. 2014;27:561–569. doi: 10.1002/nbm.3093. [DOI] [PubMed] [Google Scholar]
- 15.Koelsch BL, Keshari KR, Peeters TH, Larson PEZ, Wilson DM, Kurhanewicz J. Diffusion MR of hyperpolarized 13C molecules in solution. Analyst. 2013;138:1011–1014. doi: 10.1039/c2an36715g. [DOI] [PMC free article] [PubMed] [Google Scholar]
- 16.Schilling F, Duöwel S, Köllisch U, et al. Diffusion of hyperpolarized 13C–metabolites in tumor cell spheroids using real-time NMR spectroscopy. NMR Biomed. 2013;26:557–568. doi: 10.1002/nbm.2892. [DOI] [PubMed] [Google Scholar]
- 17.Koelsch BL, Reed GD, Keshari KR, et al. Rapid in vivo apparent diffusion coefficient mapping of hyperpolarized 13C metabolites. Magn Reson Med. 2015;74:622–633. doi: 10.1002/mrm.25422. [DOI] [PMC free article] [PubMed] [Google Scholar]
- 18.Effros RM, Jacobs E, Hacker A, Ozker K, Murphy C. Reversible inhibition of urea exchange in rat hepatocytes. J Clin Invest. 1993;91:2822–2828. doi: 10.1172/JCI116525. [DOI] [PMC free article] [PubMed] [Google Scholar]
- 19.von Morze C, Bok RA, Reed GD, Ardenkjaer-Larsen JH, Kurhanewicz J, Vigneron DB. Simultaneous multiagent hyperpolarized (13)C perfusion imaging. Magn Reson Med. 2014;72:1599–1609. doi: 10.1002/mrm.25071. [DOI] [PMC free article] [PubMed] [Google Scholar]
- 20.Gordon JW, Milshteyn E, Marco-Rius I, Ohliger MA, Vigneron DB, Larson PE. Mis-estimation and bias of hyperpolarized ADC measurements due to slice-profile effects; Proc 24th Annual Meeting ISMRM; Singapore. 2016. p. 2344. [DOI] [PMC free article] [PubMed] [Google Scholar]
- 21.Constandinou C, Henderson N, Iredale JP. Modeling liver fibrosis in rodents. Methods Mol Med. 2005;117:237–250. doi: 10.1385/1-59259-940-0:237. [DOI] [PubMed] [Google Scholar]
- 22.Zhao XY, Wang BE, Li XM, Wang TL. Newly proposed fibrosis staging criterion for assessing carbon tetrachloride- and albumin complex-induced liver fibrosis in rodents. Pathol Int. 2008;58:580–588. doi: 10.1111/j.1440-1827.2008.02274.x. [DOI] [PubMed] [Google Scholar]
- 23.Johnson PA, Babb AL. Liquid diffusion of non-electrolytes. Chem Rev. 1956;56:387–453. [Google Scholar]
- 24.Schaltzberg P. On the molecular diameter of water from solubility and diffusion measurements. J Phys Chem. 1967;71:4569–4570. [Google Scholar]
- 25.Stein WD. Transplant diffusion across cell membranes. New York: Academic Press; 1986. Channels across the cell membrane BT; pp. 128–129. [Google Scholar]
- 26.Reed GD, von Morze C, Bok R, et al. High resolution 13C MRI with hyperpolarized urea: in vivo T2 mapping and 15N labeling effects. IEEE Trans Med Imaging. 2014;33:362–371. doi: 10.1109/TMI.2013.2285120. [DOI] [PMC free article] [PubMed] [Google Scholar]
- 27.Klein JD, Timmer RT, Rouillard P, Bailey JL, Sands JM. UT—A urea transporter protein expressed in liver?: Upregulation by uremia. J Am Soc Nephrol. 1999;10:2076–2083. doi: 10.1681/ASN.V10102076. [DOI] [PubMed] [Google Scholar]
- 28.Davies B, Davies B, Morris T, Morris T. Physiological parameters in laboratory animals and humans. Pharm Res. 1993;10:1093. doi: 10.1023/a:1018943613122. [DOI] [PubMed] [Google Scholar]
- 29.Rodrigues WF, Miguel CB, Napimoga MH, Oliveira CJF, Lazo-Chica JE. Establishing standards for studying renal function in mice through measurements of body size-adjusted creatinine and urea levels. Biomed Res Int. 2014;2014:872827. doi: 10.1155/2014/872827. [DOI] [PMC free article] [PubMed] [Google Scholar]
- 30.Sahin S, Rowland M. Estimation of aqueous distributional spaces in the dual perfused rat liver. J Physiol. 2000;528:199–207. doi: 10.1111/j.1469-7793.2000.00199.x. 1. [DOI] [PMC free article] [PubMed] [Google Scholar]
- 31.Davies E, Huang Y, Harper JB, et al. Dynamics of water in agar gels studied using low and high resolution 1H NMR spectroscopy. Int J Food Sci Tech. 2010;45:2502–2507. [Google Scholar]
- 32.Nakano M, Worner TM, Lieber CS. Perivenular fibrosis in alcoholic liver injury: ultrastructure and histologic progression. Gastroenterology. 1982;83:777–785. [PubMed] [Google Scholar]
- 33.Bonekamp S, Torbenson MS, Kamel IR. Diffusion-weighted magnetic resonance imaging for the staging of liver fibrosis. J Clin Gastroenterol. 2011;45:885–892. doi: 10.1097/MCG.0b013e318223bd2c. [DOI] [PMC free article] [PubMed] [Google Scholar]
- 34.Sandrasegaran K, Akisik FM, Lin C, et al. Value of diffusion-weighted MRI for assessing liver fibrosis and cirrhosis. Am J Roentgenol. 2009;193:1556–1560. doi: 10.2214/AJR.09.2436. [DOI] [PubMed] [Google Scholar]
- 35.Shi Z, Wakil AE, Rockey DC. Strain-specific differences in mouse hepatic wound healing are mediated by divergent T helper cytokine responses. Proc Natl Acad Sci U S A. 1997;94:10663–10668. doi: 10.1073/pnas.94.20.10663. [DOI] [PMC free article] [PubMed] [Google Scholar]


