

Abstract
Older adults are less efficient at avoiding obstacles compared to young adults, especially under attention-demanding conditions. Using functional near-infrared-spectroscopy (fNIRS), recent studies implicated the prefrontal cortex (PFC) in cognitive control of locomotion, notably under dual-task walking conditions. The neural substrates underlying Obstacle Negotiation (ON), however, have not been established. The current study determined the role of the PFC in ON during walking in seniors. Non-demented older adults (n=90; mean age=78.1±5.5 years; %female=51) underwent fNIRS acquisition to assess changes in hemodynamic activity in the PFC during normal-walk [NW] and walk-while-talk [WWT] conditions with and without obstacles. Obstacles were presented as red elliptical shapes using advanced laser technology, which resemble potholes. Linear mixed effects models were used to determine differences in oxygenated hemoglobin (HbO2) levels among the four task conditions. The presence of slow gait, a risk factor for dementia and falls, served as a predictor hypothesized to moderate the effect of obstacles on PFC HbO2 levels. PFC HbO2 levels were significantly higher in WWT compared to NW (p < 0.001) irrespective of ON. Slow gait moderated the effect of obstacles on HbO2 levels across task conditions. Specifically, compared to participants with normal gait, PFC HbO2 levels were significantly increased in ON-NW relative to NW (p = 0.017) and ON-WWT relative to WWT (p < 0.001) among individuals with slow gait. Consistent with Compensatory Reallocation, ON required greater PFC involvement among individuals with mobility limitations.
Keywords: fNIRS, aging, mobility, dual-tasking
1. Introduction
Obstacle Negotiation (ON) requires individuals to scan the environment and adapt their walking patterns to avoid obstacles such as potholes. Older adults are less efficient at avoiding obstacles compared to younger adults, especially under dual-task (1) or timed (2) conditions. Older adults utilize a slower, more conservative, and stabilizing strategy when crossing obstacles compared to young adults (2). Among older adults, unsuccessful navigation of obstacles is a major fall risk (3).
The functional neural basis for gait is not well-understood due to limitations of traditional neuroimaging techniques, which require participants to lie motionless in a supine position. Functional near-infrared spectroscopy (fNIRS) is a relatively new optical imaging method that is well-suited to assess changes in the hemodynamic response during ambulation (4, 5). There is robust evidence for higher order cognitive control, notably attention and executive functions, in locomotion (5). Recent fNIRS studies have found increased bilateral oxygenated hemoglobin (HbO2) in the prefrontal cortex (PFC), an area associated with executive functions, during dual-task compared to single-task walking conditions (6, 7).
Knowledge of the neural bases of ON, however, is very sparse. Consistent with dual-task studies, attention and executive dysfunction are associated with poor ON in both healthy older adults and patients with Parkinson’s disease (PD) (8, 9). To date, task-based functional correlates of ON have not been established. One study examined PFC involvement in ON in healthy older adults and PD patients using fNIRS and found increased oxygenation during ON relative to normal walk in individuals with PD (10).
Recent research has shown that seniors with mobility limitations, attributed to peripheral causes, demonstrated greater PFC activations during dual-task walking compared to controls (11). Peripheral impairments are related to slow gait (12), which is a robust and relatively easy measure to assess, making it advantageous for both clinical and research settings. Slow gait is common among older individuals and has been associated with incidence of adverse outcomes including cognitive decline, falls, disability, and mortality (13–15). The effect of slow gait on the functional brain correlates of ON has not been reported.
Using fNIRS, we examined changes in PFC HbO2 levels during ON assessed under single- and dual-task gait conditions in non-demented older adults. We hypothesized that HbO2 levels would increase during ON relative to unobstructed walking. Furthermore, the current study was specifically designed to determine whether, consistent with compensatory reallocation (16), individuals with slow gait, an established risk factor for cognitive and mobility declines, would demonstrate greater increases in HbO2 levels during ON compared to unobstructed walking conditions relative to healthy controls.
2. Method
2.1. Participants
The sample consisted of community-dwelling older adults enrolled in “Central Control of Mobility in Aging” (CCMA) (6, 11). Participants received a telephone interview prior to inclusion in the study, which consisted of a medical history questionnaire, a mobility questionnaire, and cognitive screens to rule out dementia (17). Participants were at least 65 years of age, and English-speaking. Exclusion criteria were severe auditory or visual disturbances, inability to walk the length of a room or climb stairs without assistance, any medical/neurological history that may interfere with testing (e.g., acute or terminal illness, progressive neurodegenerative diseases, major psychiatric illnesses, traumatic brain injury, seizures), and a diagnosis of dementia (diagnosed via case conferences once the participant is enrolled). If participants were able to ambulate with a cane, they were eligible to participate in the walking paradigm, and were asked to place their cane outside the sensor-area.
2.2. Procedures
After meeting eligibility criteria, participants were invited for two three-hour visits at the research clinic. Participants completed a battery of neuropsychological tests, a neurological examination, walking and balance protocols, and standardized questionnaires. CCMA participants are followed annually. The slow gait status cuts (Men: age below 75 years = 86.2 cm/sec, and age above 75 years = 76.4 cm/sec; Women: age below 75 years = 84.7 cm/sec, and age above 75 years = 66.1 cm/sec) are based on age and sex specific stratification for the CCMA study during one straight walk (6.1 m × 0.61 m (L × W)), assessed using GAITRite independently of the experimental ON protocol (18). The method and sample specific cut-scores were recently published (19). Written informed consents were obtained in-person and approved by the Institutional Review Board.
2.3. Experimental Protocol
Quantitative Gait Assessment
Zenometrics
A 4 × 14 foot Zeno electronic walkway was utilized to assess quantitative measures of gait (Zenometrics, LLC; Peekskill, NY). The quantitative gait measure used in the current study, stride velocity(cm/sec), was assessed using the ProtoKinetics Movement Analysis Software (PKMAS), based on the location and mathematical parameters between footfalls on the instrumented walkway. Split-half intra-class correlations (ICC) for stride velocity(cm/sec) in NW and WWT were greater than 0.95 revealing excellent internal consistency (7).
Four separate task conditions were used for the purpose of the current study: 1) Normal Pace Walk (NW); 2) Walk While Talk (WWT); 3) Obstacle Negotiation during Normal Walk (NW + ON); and 4) Obstacle Negotiation during Walk While Talk (WWT+ ON). In the NW condition, participants were asked to walk around the electronic walkway at their “normal pace” for three consecutive loops. In the WWT condition, participants were instructed to walk around the walkway at their normal pace while reciting alternate letters of the alphabet, and they were reminded to pay equal attention to both tasks (6). For the ON conditions, participants were required to follow the same task instruction as for the NW and WWT conditions, while simultaneously circulating to the left of red elliptical-shaped obstacles produced using laser technology specifically developed for this project (Mobilaser™ ZenoMetrics LLC, MAP/CIRInc.) (Figure 1). Mobilaser is time-linked to both the PKMAS and fNIRS systems. Participants were instructed to not walk over the obstacles. The elliptical shape was developed to resemble a pothole, which increases the ecological validity to our task. The appearance of each obstacle was triggered by participants’ footfalls. Hence, an obstacle was presented (in a randomized order) only after the gait mat recognized that a participant was entering a new straight walk. This also ensured a fixed distance (from step to obstacle) irrespective of walking speed. The obstacles could appear between 0–2 times within each straight walk, but in total participants had to negotiate 6 obstacles during the entire course of each ON walking condition. Participants saw only one obstacle at a time.
Figure 1. Picture of Obstacle Negotiation Experimental Setup.
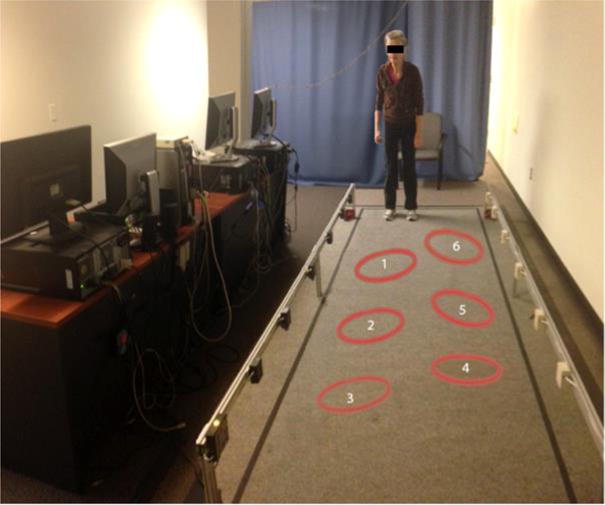
Note. The picture displays all possible positions of the laser obstacles, which are ellipses with a length of 13.5′ and a width of 9.75.
2.4. Functional Near Infrared Spectroscopy (fNIRS) System
We used the fNIR Imager 1000 (fNIR Devices, LLC, Potomac, MD) to assess changes in hemodynamic activity in the PFC. The fNIRS system consists of a flexible circuit board that was placed on the participants’ forehead using standard procedures, a control box for data acquisition and a computer for data collection and storage. The system can collect data at a sampling rate of 2Hz. The fNIRS sensor consists of 4 LED light sources and 10 detectors, which cover the forehead using 16 channels, with a source-detector separation of 2.5 cm (6). The fNIRS is placed on the forehead so that the horizontal symmetry axis central (y-axis) coincides with symmetry axis of the head, (i.e. in between the eyes). On the vertical axis, the sensor is positioned right above the eyebrows in relation to the international 10–20 system so that FP1 and FP2 marker locations are approximately positioned on the bottom channel row level.
2.5. Preprocessing and Hemodynamic Signal Extraction
Data from each of the 16 fNIRS channels under the four walking experimental conditions were carefully inspected and removed if saturation or dark current conditions were identified. The raw intensity measurements were then low-pass filtered with a finite impulse response filter of cutoff frequency at 0.14Hz to eliminate possible respiration and heart rate signals and unwanted high frequency noise. This allowed for proper assessment and removal of artifact by identifying saturated and dark current measurements from signal levels. We additionally identified high frequency noise through visual inspection by an expert data analyst (M. Izzetoglu). HbO2 signals were calculated using modified Beer-Lambert law (20) for each channel. HbO2 values were used to characterize changes in the PFC since they are more reliable and sensitive to locomotion-related changes in cerebral blood flow (21). Relative changes in HbO2 in each condition were obtained using the most proximal standing 10-second baseline, where participants were asked to remain still, fixate on the wall directly in front of them, and count silently in their head at a rate of about one number per second. For each condition the baseline levels were adjusted to a zero mean value. Hence, the changes in HbO2 values in each condition were normalized to an individualized baseline. There were separate baselines prior to each trial. Mean HbO2 levels for NW, WWT, NW+ON, and WWT+ON were calculated based on the 16 fNIRS channels as previously described (7, 11).
2.6. Covariates/Other Measures
Consistent with our previous studies (22), dichotomous rating (presence or absence) of physician diagnosed diabetes, chronic heart failure, arthritis, hypertension, depression, stroke, Parkinson’s disease, chronic obstructive lung disease, angina, and myocardial infarction was used to calculate a disease comorbidity summary score (range 0–10).
The Repeatable Battery for the Assessment of Neuropsychological Status (RBANS) was used to assess overall cognitive function. The RBANS is a brief cognitive test that provides a global cognitive function score and is useful for the detection and characterization of dementia in older adults. The RBANS was used as a covariate due to literature suggesting a relationship between RBANS and neuroimaging (fMRI) outcomes (23). Additional covariates included age, education, and gender. Fear of falling was also assessed using a single question with a dichotomous rating (“yes” or “no”): “generally speaking, do you have a fear of falling.”
2.7. Statistical Methods
Separate linear mixed effects models (LMEMs), each adjusted for age, gender, education, disease comorbidity (GHS), and RBANS total score, were used to examine the main effects of task on gait velocity and HbO2 levels. Task conditions served as repeated measures variables. To avoid issues of multiple comparisons, we used one overall HbO2 measure per walking task condition. However, in the context of the mixed effects models, we used information from all 16 channels taking into account their correlations and variable HbO2 levels. The following four pre-specified contrasts were examined in the context of the LMEMs to directly evaluate the study predictions: a) NW vs. WWT; b) NW vs. NW +ON; c) WWT vs. WWT + ON; d) NW +ON vs. WWT +ON. The moderating effects of slow gait on these four pre-specified contrasts were examined via two-way interactions of slow gait status × task condition. All statistical analyses were run using IBM’s Statistical Package for the Social Sciences (SPSS), Version 20.0 (Corp., 2011).
3. Results
Non-demented CCMA participants (n=90; mean age in years=78±15.5; %female=51) were included in the current study. The low mean disease comorbidity score (GHS=0.7±0.9) confirmed the relatively healthy nature of the sample. The mean RBANS Total Scale Index score (93.5±12.8) was indicative of average cognitive ability overall. There were no observed differences in fear of falling between the slow gait (8 out of 26; 31%) and normal gait (17 out of 64; 27%) groups (χ2(2) = 0.933, p = 0.627). See Table 1 for sample characteristics.
Table 1.
Summary of sample characteristics, gait velocity, and HbO2 levels per task
| Total sample | Normal Gait | Slow Gait | |
|---|---|---|---|
| Participants (n) | 90 | 64 | 26 |
| Women: number (%) | 46 (51%) | 36 (56.3%) | 10 (38.5%) |
| Fear of Falling | 25 (28%) | 17 (27%) | 8 (31%) |
|
| |||
| Mean (SD) | Mean (SD) | Mean (SD) | |
|
| |||
| Age years | 78.01 (5.49) | 78.31 (5.88) | 77.58 (4.45) |
| Education years | 14.86 (2.96) | 15.00 (2.93) | 14.50 (3.04) |
| Disease comorbidity index | 0.70 (0.92) | 0.67 (0.89) | 0.77 (0.99) |
| RBANS standard index score | 93.45 (12.77) | 95.68 (12.55) | 88.04 (11.83) |
| Gait velocity NW (cm/s) | 62.60 (13.04) | 66.10 (11.72) | 53.99 (12.11) |
| Gait velocity WWT (cm/s) | 54.68 (13.46) | 58.18 (12.69) | 46.07 (11.27) |
| Gait velocity ON-NW (cm/s) | 56.67 (11.71) | 58.84 (10.09) | 51.31 (13.55) |
| Gait velocity ON-WWT (cm/s) | 49.94 (12.00) | 52.75 (11.15) | 43.03 (11.20) |
| HbO2 levels NW | 0.30 (1.21) | 0.32 (1.04) | 0.24 (1.55) |
| HbO2 levels WWT | 1.08 (1.51) | 1.10 (1.25) | 1.04 (1.99) |
| HbO2 levels ON-NW | 0.19 (1.35) | 0.13 (1.28) | 0.35 (1.50) |
| HbO2 levels ON-WWT | 1.08 (1.57) | 0.93 (1.35) | 1.45 (2.00) |
Note. SD: standard deviation; GHS: Global Health Score (range 0–10) obtained from dichotomous rating (presence or absence) of diabetes, chronic heart failure, arthritis, hypertension, depression, stroke, Parkinson’s disease, chronic obstructive pulmonary disease, angina, and myocardial infarction; RBANS: Repeatable Battery for the Assessment of Neuropsychological Status; NW: Normal Walk; WWT: Walk While Talk; ON-NW: Obstacle Negotiation – Normal Walk; ON-WWT: Obstacle Negotiation – Walk While Talk.
3.1. Effects of dual-tasking and ON on gait velocity (see Table 1 for mean gait velocity for each task)
3.1.1. Dual vs. Single Task
Gait velocity in WWT was significantly reduced compared to NW during both unobstructed (estimate = −7.96; 95%CI = −9.40 to −6.52; p < 0.001) and obstructed gait conditions (estimate = −6.77; 95%CI = −8.07 to −5.46; p < 0.001 (Table 2, Panel A).
Table 2.
Linear mixed effect models with task as the four-level within person repeated measure (NW, WWT, ON-NW, ON-WWT), slow gait status as moderator, and gait velocity (panel A) and HbO2 levels (panel B) as the dependent measures
| Variable | Estimate | 95%CI | t | P |
|---|---|---|---|---|
| (A) Task effects (total sample) | ||||
| WWT vs. NW | −7.96 | −9.40 to −6.52 | −10.94 | <0.001 |
| ON-WWT vs. ON-NW | −6.77 | −8.07 to −5.46 | −10.25 | <0.001 |
| ON-NW vs. NW | −5.87 | −6.88 to −4.86 | −11.49 | <0.001 |
| ON-WWT vs. WWT | −4.68 | −5.62 to −3.73 | −9.79 | <0.001 |
| Interaction effects with groups and task conditions | ||||
| Slow gait vs. normal gait × WWT vs. NW | 0.48 | −1.37 to 1.47 | 0.07 | 0.947 |
| Slow gait vs. normal gait × ON-WWT vs. ON-NW | −2.13 | −3.62 to −0.64 | −2.81 | 0.005 |
| Slow gait vs. normal gait × ON-NW vs. NW | 4.50 | 3.33 to 5.68 | 7.51 | <0.001 |
| Slow gait vs. normal gait × ON-WWT vs. WWT | 2.32 | 1.10 to 3.55 | 3.71 | <0.001 |
| (B) Task effects (total sample) | ||||
| WWT vs. NW | 0.79 | 0.67 to 0.90 | 13.00 | <0.001 |
| ON-WWT vs. ON-NW | 0.89 | 0.78 to 1.01 | 7.23 | <0.001 |
| ON-NW vs. NW | −0.11 | −0.22 to 0.01 | −1.75 | 0.08 |
| ON-WWT vs. WWT | 0.002 | −0.12 to 0.12 | 0.03 | 0.98 |
| Interaction effects with groups and task conditions | ||||
| Slow gait vs. normal gait × WWT vs. NW | 0.006 | −0.25 to 0.26 | 0.05 | 0.963 |
| Slow gait vs. normal gait × ON-WWT vs. ON-NW | 0.29 | 0.03 to 0.55 | 2.20 | 0.028 |
| Slow gait vs. normal gait × ON-NW vs. NW | 0.31 | 0.06 to 0.57 | 2.40 | 0.017 |
| Slow gait vs. normal gait × ON-WWT vs. WWT | 0.60 | 0.34 to 0.85 | 4.58 | <0.001 |
Note. (A) Gait velocity is the dependent measure, and (B) HbO2 is the dependent measure.
Both analyses are adjusted for age, gender, education, comorbidity status, and RBANS total index score.NW: Normal Walk; WWT: Walk While Talk; ON-NW: Obstacle Negotiation – Normal Walk; ON-WWT: Obstacle Negotiation – Walk While Talk.
3.1.2. Obstructed vs. Unobstructed Walking
For the single task, gait velocity in ON-NW was significantly reduced compared to NW (estimate = −5.87; 95%CI = −6.88 to −4.86; p < 0.001). For the dual task, ON-WWT was significantly lowered compared to WWT (estimate = −4.68; 95%CI = −5.62 to −3.73; p < 0.001 (Table 2, Panel A).
3.1.3. Moderation effect of slow gait on Obstructed vs. Unobstructed walking
Slow gait status attenuated the decrease in gait velocity in ON-NW compared to NW (interaction of slow gait × task estimate = 4.50; 95%CI = 3.33 to 5.68; p < 0.001), and in ON-WWT compared to WWT (interaction of slow gait × task estimate = 2.32; 95%CI = 1.10 to 3.55; p < 0.001) for individuals with slow gait, compared to their normal gait counterparts (Table 2, Panel A and Figure 2, Panel A).
Figure 2. Average levels of gait velocity (panel A) and HbO2 (panel B) by task and by slow gait status as moderator.
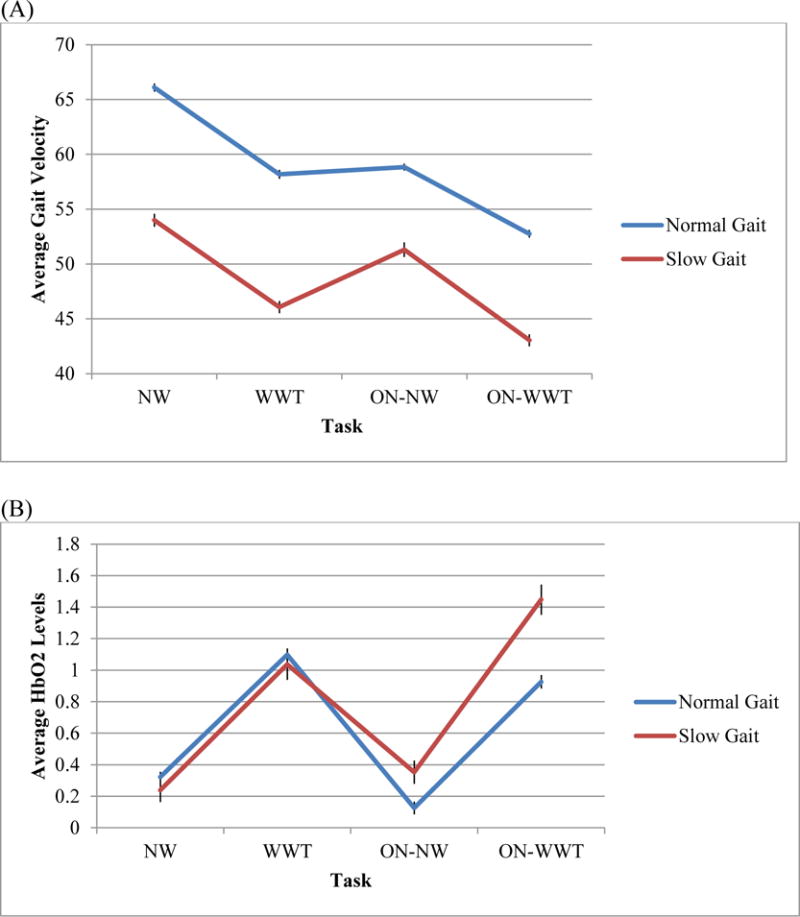
Note. (A) Gait velocity is the dependent measure and depicted on the vertical axis, and (B) HbO2 is the dependent measure and depicted on the vertical axis. NW: Normal Walk; WWT: Walk While Talk; ON-NW: Obstacle Negotiation – Normal Walk; ON-WWT: Obstacle Negotiation – Walk While Talk; Error bars = mean±SEM.
3.2. Effects of dual-tasking and ON on PFC HbO2 levels (see Table 1 for mean HbO2 levels for each task)
3.2.1. Dual Task vs. Single Task
Consistent with previous findings overall HbO2 levels were significantly higher in WWT compared to NW in both unobstructed (WWT vs. NW; estimate = 0.79; 95%CI = 0.67 to 0.90; p < 0.001) and obstructed gait conditions (ON-WWT vs. ON-NW; estimate = 0.89; 95%CI = 0.78 to 1.01; p < 0.001) (Table 2, Panel B).
3.2.2. Moderation effect of slow gait on HbO2 levels in Obstructed vs. Unobstructed walking
Slow gait status moderated the increase in HbO2 levels in ON-NW compared to NW (interaction of slow gait × task estimate = 0.31; 95%CI = 0.06 to 0.57; p = 0.017), and in ON-WWT compared to WWT (interaction of slow gait × task estimate = 0.60; 95%CI = 0.34 to 0.85; p < 0.001). Greater increases in HbO2 levels obstructed vs. unobstructed walking conditions were observed among individuals with slow gait compared to participants with normal gait (Table 2, Panel B and Figure 2, Panel B).
4. Discussion
Consistent with recent studies (6, 7), we found that PFC oxygenation levels were significantly higher in WWT compared to NW conditions, irrespective of the presence or absence of obstacles. Furthermore, confirming the study hypothesis, slow gait moderated the effect of obstacles on oxygenation levels across task conditions. Specifically, compared to individuals with normal gait, PFC oxygenation levels were significantly increased in ON-NW relative to NW, and in ON-WWT relative to WWT, among individuals with slow gait (see Figure 2, Panel B for visual depiction). For individuals with slow gait, ON may have presented a greater challenge requiring increased PFC recruitment to support the task demands. These results are consistent with a previous study, reporting that PFC HbO2 levels were increased during ON relative to normal walk in individuals with PD (10). Motor imagery studies have also found that PD patients appear to require additional visuospatial and attention resources, relative to healthy adults (24, 25). An alternative explanation is that individuals with slow gait may attend to the obstacles more due to a greater fear of falling. However, fear of falls frequency did not vary as a function of slow gait.
The effect of obstacles on the change in PFC HbO2 levels during walking is notable in light of the behavioral findings. As expected, gait velocity was significantly slower as a function of dual-task interference and the presence of ON. Our results support previous findings that older adults approach obstacles more slowly and conservatively, utilizing a more stabilizing approach, particularly when they are required to divide their attention (1, 2). In addition, we found that individuals with slow gait manifested smaller obstacle-related task costs (differences between ON-NW and NW velocities and between ON-WWT and WWT velocities) compared to individuals with normal gait. This finding may be attributed to the fact that individuals with slow gait already demonstrated much slower walking in the unobstructed conditions compared to older adults with normal gait. Alternatively, the increased utilization of cognitive resources, operationalized using PFC HbO2 levels, among individuals with slow gait may have contributed to their reduced gait speed costs compared to participants with normal gait. An additional study found that PFC activity was elevated during complex walking tasks relative to a control task, which the authors posited to reflect preserved quality of gait during obstacle negotiation tasks (26).
“Compensatory reallocation” and “neural inefficiency” are two hypotheses providing a conceptual framework for our findings. Compensatory reallocation (16) suggests that older adults demonstrate bilateral activations in the PFC in cognitively demanding tasks compared to more structurally circumscribed and unilateral activations in young adults. According to this model the bilateral increase in brain activation in the PFC has a compensatory function among older adults that is expected to enhance cognitive performance. Given that relative to individuals with normal gait, those with slow gait had smaller ON-related task costs in performance (i.e., velocity) and greater PFC activation, our results appear to provide an explanation that is consistent with the compensatory reallocation hypothesis. On the other hand, neural inefficiency (27) posits that due to age-related changes in structure and function, the brain does not efficiently allocate resources to support cognitive task demands. According to this scenario, greater brain activation levels are associated with equivalent or worse behavioral performance. Since the slow gait group had slower velocities across all task conditions compared to the normal control group, it is impossible to rule out the interpretation that individuals with slow gait may have also exhibited an overall inefficient brain responses during ambulation.
Study limitations
Given the relatively healthy nature of the CCMA sample, the generalizability of our findings to populations with cognitive and motoric impairments should be examined. Though our study used PFC oxygenation to assess change in utilization of cognitive resources, it is important to note that attention is a multidimensional concept. Besides the PFC, other cortical and subcortical areas are implicated in different aspects of attention (28). Therefore, the involvement of other brain regions in walking during ON was not captured by our fNIRS system. Nevertheless, the PFC is vital in the top-down control of attention. Furthermore, oxygenated hemoglobin was solely examined because it is more reliable and more sensitive to locomotion-related oxygenation changes compared to de-oxygenated hemoglobin (21). Future studies should investigate whether inclusion of deoxygenated hemoglobin would yield a different pattern of results.
5. Conclusion
Individuals with mobility limitations utilized more cognitive resources when navigating around obstacles. Such utilization of cognitive resources, whether compensatory or inefficient, may put individuals with gait limitations at greater risk for falling and other adverse outcomes.
Highlights.
We examined brain activity in prefrontal cortex (PFC) in 90 healthy older adults.
PFC oxygenation was higher in walk while talk (WWT) compared to normal walk (NW).
Slow gait moderated effect of ON on PFC oxygenation.
PFC oxygenation was higher in ON during NW and WWT among people with slow gait.
Overall, ON required greater PFC involvement in those with mobility limitations.
Acknowledgments
This research is supported by NIA grants (R01 AG03621; R01 AG044007; R01AG050448). Dr. Izzetoglu has a very minor share in the company that manufactures the fNIRS device used in this study. All other authors have no conflicts of interest to report in relation to the current article.
Footnotes
Publisher's Disclaimer: This is a PDF file of an unedited manuscript that has been accepted for publication. As a service to our customers we are providing this early version of the manuscript. The manuscript will undergo copyediting, typesetting, and review of the resulting proof before it is published in its final citable form. Please note that during the production process errors may be discovered which could affect the content, and all legal disclaimers that apply to the journal pertain.
Conflict of Interest: All other authors have no conflicts of interest to report in relation to the current article.
References
- 1.St George RJ, Fitzpatrick RC, Rogers MW, Lord SR. Choice stepping response and transfer times: effects of age, fall risk, and secondary tasks. The journals of gerontology Series A, Biological sciences and medical sciences. 2007;62(5):537–42. doi: 10.1093/gerona/62.5.537. [DOI] [PubMed] [Google Scholar]
- 2.Galna B, Peters A, Murphy AT, Morris ME. Obstacle crossing deficits in older adults: a systematic review. Gait Posture. 2009;30(3):270–5. doi: 10.1016/j.gaitpost.2009.05.022. [DOI] [PubMed] [Google Scholar]
- 3.Toba K, Okochi J, Takahashi T, Matsubayashi K, Nishinaga M, Yamada S, et al. Development of a portable fall risk index for elderly people living in the community. Nihon Ronen Igakkai Zasshi. 2005;42(3):346–52. doi: 10.3143/geriatrics.42.346. [DOI] [PubMed] [Google Scholar]
- 4.Harada T, Miyai I, Suzuki M, Kubota K. Gait capacity affects cortical activation patterns related to speed control in the elderly. Exp Brain Res. 2009;193(3):445–54. doi: 10.1007/s00221-008-1643-y. [DOI] [PubMed] [Google Scholar]
- 5.Holtzer R, Wang C, Verghese J. The relationship between attention and gait in aging: facts and fallacies. Motor Control. 2012;16(1):64–80. doi: 10.1123/mcj.16.1.64. [DOI] [PMC free article] [PubMed] [Google Scholar]
- 6.Holtzer R, Mahoney JR, Izzetoglu M, Izzetoglu K, Onaral B, Verghese J. fNIRS study of walking and walking while talking in young and old individuals. The journals of gerontology Series A, Biological sciences and medical sciences. 2011;66(8):879–87. doi: 10.1093/gerona/glr068. [DOI] [PMC free article] [PubMed] [Google Scholar]
- 7.Holtzer R, Mahoney JR, Izzetoglu M, Wang C, England S, Verghese J. Online fronto-cortical control of simple and attention-demanding locomotion in humans. NeuroImage. 2015;112:152–9. doi: 10.1016/j.neuroimage.2015.03.002. [DOI] [PMC free article] [PubMed] [Google Scholar]
- 8.Yogev-Seligmann G, Hausdorff JM, Giladi N. The role of executive function and attention in gait. Mov Disord. 2008;23(3):329–42. doi: 10.1002/mds.21720. quiz 472. [DOI] [PMC free article] [PubMed] [Google Scholar]
- 9.Heremans E, Nieuwboer A, Spildooren J, Vandenbossche J, Deroost N, Soetens E, et al. Cognitive aspects of freezing of gait in Parkinson’s disease: a challenge for rehabilitation. J Neural Transm (Vienna) 2013;120(4):543–57. doi: 10.1007/s00702-012-0964-y. [DOI] [PubMed] [Google Scholar]
- 10.Maidan I, Nieuwhof F, Bernad-Elazari H, Reelick MF, Bloem BR, Giladi N, et al. The role of the frontal lobe in complex walking among patients with Parkinson’s disease and healthy older adults: an fNIRS study. Neurorehabil Neural Repair. 2016;30(10):963–971. doi: 10.1177/1545968316650426. [DOI] [PubMed] [Google Scholar]
- 11.Holtzer R, Verghese J, Allali G, Izzetoglu M, Wang C, Mahoney JR. Neurological Gait Abnormalities Moderate the Functional Brain Signature of the Posture First Hypothesis. Brain Topogr. 2016;29(2):334–43. doi: 10.1007/s10548-015-0465-z. [DOI] [PMC free article] [PubMed] [Google Scholar]
- 12.Wuehr M, Schniepp R, Schlick C, Huth S, Pradhan C, Dieterich M, et al. Sensory loss and walking speed related factors for gait alterations in patients with peripheral neuropathy. Gait & posture. 2014;39(3):852–8. doi: 10.1016/j.gaitpost.2013.11.013. [DOI] [PubMed] [Google Scholar]
- 13.Studenski S, Perera S, Patel K, Rosano C, Faulkner K, Inzitari M, et al. Gait speed and survival in older adults. JAMA. 2011;305(1):50–8. doi: 10.1001/jama.2010.1923. [DOI] [PMC free article] [PubMed] [Google Scholar]
- 14.Verghese J, Robbins M, Holtzer R, Zimmerman M, Wang C, Xue X, et al. Gait dysfunction in mild cognitive impairment syndromes. Journal of the American Geriatrics Society. 2008;56(7):1244–51. doi: 10.1111/j.1532-5415.2008.01758.x. [DOI] [PMC free article] [PubMed] [Google Scholar]
- 15.Verghese J, Wang C, Holtzer R. Relationship of clinic-based gait speed measurement to limitations in community-based activities in older adults. Arch Phys Med Rehabil. 2011;92(5):844–6. doi: 10.1016/j.apmr.2010.12.030. [DOI] [PMC free article] [PubMed] [Google Scholar]
- 16.Cabeza R, Anderson ND, Locantore JK, McIntosh AR. Aging gracefully: compensatory brain activity in high-performing older adults. NeuroImage. 2002;17(3):1394–402. doi: 10.1006/nimg.2002.1280. [DOI] [PubMed] [Google Scholar]
- 17.Buschke H, Kuslansky G, Katz M, Stewart WF, Sliwinski MJ, Eckholdt HM, et al. Screening for dementia with the memory impairment screen. Neurology. 1999;52(2):231–8. doi: 10.1212/wnl.52.2.231. [DOI] [PubMed] [Google Scholar]
- 18.Holtzer R, Mahoney J, Verghese J. Intraindividual variability in executive functions but not speed of processing or conflict resolution predicts performance differences in gait speed in older adults. The journals of gerontology Series A, Biological sciences and medical sciences. 2014;69(8):980–6. doi: 10.1093/gerona/glt180. [DOI] [PMC free article] [PubMed] [Google Scholar]
- 19.Verghese J, Annweiler C, Ayers E, Barzilai N, Beauchet O, Bennett DA, et al. Motoric cognitive risk syndrome: multicountry prevalence and dementia risk. Neurology. 2014;83(8):718–26. doi: 10.1212/WNL.0000000000000717. [DOI] [PMC free article] [PubMed] [Google Scholar]
- 20.Boas DA, Strangman G, Culver JP, Hoge RD, Jasdzewski G, Poldrack RA, et al. Can the cerebral metabolic rate of oxygen be estimated with near-infrared spectroscopy? Phys Med Biol. 2003;48(15):2405–18. doi: 10.1088/0031-9155/48/15/311. [DOI] [PubMed] [Google Scholar]
- 21.Miyai I, Tanabe HC, Sase I, Eda H, Oda I, Konishi I, et al. Cortical mapping of gait in humans: a near-infrared spectroscopic topography study. NeuroImage. 2001;14(5):1186–92. doi: 10.1006/nimg.2001.0905. [DOI] [PubMed] [Google Scholar]
- 22.Holtzer R, Verghese J, Wang C, Hall CB, Lipton RB. Within-person across-neuropsychological test variability and incident dementia. JAMA. 2008;300(7):823–30. doi: 10.1001/jama.300.7.823. [DOI] [PMC free article] [PubMed] [Google Scholar]
- 23.Paul R, Lane EM, Tate DF, Heaps J, Romo DM, Akbudak E, et al. Neuroimaging signatures and cognitive correlates of the montreal cognitive assessment screen in a nonclinical elderly sample. Arch Clin Neuropsychol. 2011;26(5):454–60. doi: 10.1093/arclin/acr017. [DOI] [PMC free article] [PubMed] [Google Scholar]
- 24.Wai YY, Wang JJ, Weng YH, Lin WY, Ma HK, Ng SH, et al. Cortical involvement in a gait-related imagery task: comparison between Parkinson’s disease and normal aging. Parkinsonism Relat Disord. 2012;18(5):537–42. doi: 10.1016/j.parkreldis.2012.02.004. [DOI] [PubMed] [Google Scholar]
- 25.Malouin F, Richards CL, Jackson PL, Dumas F, Doyon J. Brain activations during motor imagery of locomotor-related tasks: a PET study. Human brain mapping. 2003;19(1):47–62. doi: 10.1002/hbm.10103. [DOI] [PMC free article] [PubMed] [Google Scholar]
- 26.Clark DJ, Rose DK, Ring SA, Porges EC. Utilization of central nervous system resources for preparation and performance of complex walking tasks in older adults. Front Aging Neurosci. 2014;6:217. doi: 10.3389/fnagi.2014.00217. [DOI] [PMC free article] [PubMed] [Google Scholar]
- 27.Zarahn E, Rakitin B, Abela D, Flynn J, Stern Y. Age-related changes in brain activation during a delayed item recognition task. Neurobiology of Aging. 2007;28(5):784–98. doi: 10.1016/j.neurobiolaging.2006.03.002. [DOI] [PubMed] [Google Scholar]
- 28.Petersen SE, Posner MI. The attention system of the human brain: 20 years after. Annu Rev Neurosci. 2012;35:73–89. doi: 10.1146/annurev-neuro-062111-150525. [DOI] [PMC free article] [PubMed] [Google Scholar]