

Abstract
Pancreatic adenocarcinoma is moderately responsive to gemcitabine-based chemotherapy, the most widely used single agent therapy for pancreatic cancer. While the prognosis in pancreatic cancer remains grim in part due to poor response to therapy, previous attempts at identifying and targeting the resistance mechanisms have not been very successful. By leveraging TCGA dataset, we identified lipid metabolism as the metabolic pathway that most significantly correlated with poor gemcitabine response in pancreatic cancer patients. Furthermore, we investigated the relationship between alterations in lipogenesis pathway and gemcitabine resistance by utilizing tissues from the genetically engineered mouse model and human pancreatic cancer patients. We observed a significant increase in fatty acid synthase (FASN) expression with increasing disease progression in spontaneous pancreatic cancer mouse model, and a correlation of high FASN expression with poor survival in patients and poor gemcitabine responsiveness in cell lines. We observed a synergistic effect of FASN inhibitors with gemcitabine in pancreatic cancer cells in culture and orthotopic implantation models. Combination of gemcitabine and the FASN inhibitor orlistat significantly diminished stemness, in part due to induction of ER stress that resulted in apoptosis. Moreover, direct induction of ER stress with thapsigargin caused a similar decrease in stemness and showed synergistic activity with gemcitabine. Our in vivo studies with orthotopic implantation models demonstrated a robust increase in gemcitabine responsiveness upon inhibition of fatty acid biosynthesis with orlistat. Altogether, we demonstrate that fatty acid biosynthesis pathway manipulation can help overcome the gemcitabine resistance in pancreatic cancer by regulating ER stress and stemness.
Keywords: FASN, gemcitabine resistance, cancer metabolism, cancer stem cells, pancreatic cancer
INTRODUCTION
Pancreatic ductal adenocarcinoma (PDAC), which represents about 85% of all pancreatic neoplasms, is the fourth leading cause of cancer-related deaths in the United States (1). The prognosis of patients depends upon the histological grade of the tumor and more importantly on the extent of the spread. Surgical resection presents the only potential curative treatment for the pancreatic cancer, but only 15 to 20 percent of cases are potentially resectable at diagnosis (2, 3). Chemotherapy improves the disease-related symptoms in patients with distant metastases and provides better outcomes to the locally advanced unresectable tumors. Fluoropyrimidine analogs such as gemcitabine, in combination with other drugs, are the most widely prevalent therapeutic regimen; nonetheless pancreatic cancer shows relative refractoriness to cytotoxic chemotherapy.
The efficacy of several cancer therapeutics is linked to their effect on metabolic alterations in tumor cells (4–6). Hence, combining strategies to target metabolism along with the current standard of care will prevent resistance to the therapeutics and may kill the tumor cells more effectively. Cancer cells exhibit metabolic properties distinct from normal cells in order to adapt to the nutritional needs for the proliferation (7–9). Cancer cells are more dependent on aerobic glycolysis, fatty acid synthesis, nucleic acid synthesis, and glutamine metabolism (7, 10–12). However, the therapeutic efficacy of targeting the metabolic enzymes in improving the therapeutic resistance and the mechanism by which enzymatic inhibition can overcome the therapeutic resistance is not fully understood.
While non-transformed cells depend on uptake of fatty acids derived from the diet, cancer cells demonstrate upregulation of de novo fatty acid biosynthesis. High level of Fatty acid synthase (FASN; a key enzyme involved in de novo fatty acid biosynthesis) expression occurs in multiple cancers, including pancreatic cancer (13–15). Additionally, some studies demonstrated a correlation between FASN expression and tumor aggressiveness and patient survival (15). Fatty acid synthase inhibition has been shown to have anti-proliferative effects in several types of cancer in vitro and causes tumor growth delay in tumor-bearing animal models (16–18).
In this study, we sought to evaluate the relation between the altered metabolic pathways in pancreatic cancer cells and gemcitabine resistance. We present evidence that inhibition of de novo lipid synthesis in pancreatic cancer cells can overcome the gemcitabine-resistance by inducing ER stress, and decreasing the stemness of cancer cells.
MATERIAL AND METHODS
Cell culture and reagents
The human pancreatic cancer cell lines PANC-1, AsPC-1, HPAF-II, Capan-1, Capan-2, CFPAC-1, MIA PaCa-2, T3M4, BxPC-3, CFPAC-1, HuPT3, COLO 357, TU8902, SW1990, and AsPC-1 were obtained from ATCC. DAN-G was a generous gift from Dr. Lewis C. Cantley. QGP-1, SUIT-2, and S2-007 and S2-013 (cloned sublines of a human pancreatic tumor cell line (SUIT-2) derived from a liver metastasis) were generous gifts from Dr. M.A. Hollingsworth. Cells were maintained in Dulbecco’s Modified Eagle’s Medium (DMEM), supplemented with 5% FBS. Cells were routinely cultured in 100 cm2 tissue culture plates and kept in a humidified atmosphere with 5% CO2 at 37°C a described previously (19). The cell lines were validated by STR profiling and are tested for mycoplasma every 4 months. The cell lines were obtained over the last 5–7 years. All the cell lines were used with in 10–15 passages after each thawing. Gemcitabine Hydrochloride (LC laboratories, Woburn, MA. USA) for in vitro studies was dissolved in Milli-Q water and the pH of the drug was adjusted to 7.3 using sodium hydroxide. For in vivo studies, gemcitabine (Heritage Pharmaceuticals Inc. Edison, NJ.USA) was reconstituted by adding 0.9% Sodium Chloride. Orlistat, C75, Fatostatin, Thapsigargin (Cayman Chemical Company, Ann Arbor, MI, USA), and Platensimycin (Sigma-Aldrich Co., St. Louis, MO, USA) were dissolved in DMSO. BSA-conjugated palmitate and stearate were prepared as described elsewhere (20).
Cell viability assays, cell cycle analysis and apoptosis assays
Cell viability was determined by MTT assay as described previously (21). Long-term viability was determined by performing Clonogenic assays. Cell cycle analysis was performed by staining the cells with Telford reagent as described previously (22). Caspase 3/7 activity was determined by Promega Caspase-Glo kit (Madison, WI, USA) as described previously (23, 24).
Adipogenesis assay
Triglyceride content in cell extracts was determined by utilizing adipogenesis assay kit (Biovision, Milpitas, CA, USA), as per the manufacturer’s instructions. Briefly, cells were washed once with PBS. We added 100 µl Lipid Extraction Solution per well of 12-well plate to harvest all the lipids by subsequent boiling for 30 min. Samples were treated with 2 µl of lipase to convert triglyceride to glycerol and fatty acid for 10 min at room temperature. We then incubated the samples with enzyme and probe mixture at 37°C for 30 minutes, while being kept protected from light. We measured O.D. at 570 nm for colorimetric assay, using Cytation 3 plate reader (BioTek Instruments, Winooski, VT). Background correction was applied by subtracting the value derived from the no triglyceride standard from all readings. Concentrations were calculated by utilizing a standard curve.
Assessment of synergism or antagonism
To evaluate the level of interaction (synergistic, additive or antagonist) between gemcitabine and orlistat, we followed the method proposed by Chou et al (25). Briefly, synergism or antagonism for drug combinations were calculated on the basis of the multiple drug-effect equation, and quantitated by the combination index (CI), where CI<1, CI=1 and CI>1 indicate synergism, additive effect and antagonism, respectively. Based on the classic isobologram, the CI value is calculated as:
At the 90% inhibition level, (Dx)1 and (Dx)2 are the concentrations of drug 1 and drug 2, respectively, that induce a 90% inhibition of cell growth; (D)1 and (D)2 are the concentrations of drug 1 and drug 2 in combination that also inhibits cell growth by 75% (iso-effective as compared with the single drugs alone). Data were analyzed using CompuSyn software (25).
In vivo studies
All the animal experiments performed in this study were approved by university of Nebraska Medical Center institutional animal care and use committee (IACUC). Athymic female nude mice (NCr-nu/nu) were bred in-house and 6-week-old mice were used for orthotopic implantation. 1 × 10⁶ PANC-1 cells stably transfected with luciferase were injected into the pancreas of each female athymic nude mouse and 7 days post-implantation mice were divided in groups of ten animals each. After 1 week of implantation, mice were randomized into the following treatment groups (n = 10) based on the bioluminescence measured after the first IVIS imaging: (a) untreated control (Ethanol+ PEG 400 daily); (b) Gemcitabine alone (50 mg/kg), twice/week by i.p. injection; (c) Orlistat alone (240 mg/kg), 5 times/week by i.p. injection; and (d) combination of gemcitabine (50 mg/kg) twice/week by i.p. injection and Orlistat (240 mg/kg) 5 times/week by i.p. injection. Tumor volumes were monitored weekly by bioluminescence imaging with IVIS Imaging System 200 using Living Image 3.2 software. For luciferase imaging, mice were injected i.p. with 40mg/mL luciferin potassium salt in PBS at a dose of 150mg/kg body weight. After 10 minutes of incubation with luciferin, mice were placed in a right lateral decubitus position and a digital grayscale animal image was acquired followed by acquisition and overlay of a pseudocolor image representing the spatial distribution of detected photons emerging from active luciferase within the animal. Signal intensity was quantified as the sum of all detected photons within the region of interest per second. Mice were imaged at indicated timepoints. Therapy was continued for 8 weeks and animals were sacrificed. Primary tumors in the pancreas were excised and the final tumor volume was measured as Volume = ½(length × width2). The final tumor volumes upon euthanasia were initially analyzed with one-way ANOVA and then later compared among groups using unpaired Student’s t-test.
TCGA data clinical attributes and analysis
TCGA clinical files and RNASeqV2 files were downloaded using the TCGA Data Matrix. Perl5 version 16.3 (www.perl.org) scripted regular expressions examined each of the cancer’s clinical patient files, in which the patient ID, histological subtype and American Joint Committee on Cancer pathologic tumor stage, were recorded. Clinical drug files examined for gemcitabine and related drug names and the clinical measure of response. Normalized RSEM gene results files from the TCGA UNC IlluminaHiSeq RNASeqV2 were further examined in Perl for each patient. Only RNASeq files examining the primary tumor were examined. Patients who did not have pancreas-adenocarcinoma ductal type histology or did not have mRNA or RNAseq data for the primary tumor were not utilized for further analysis. All available normal adjacent tissue in the pancreas cohort were averaged and each patient was compared in an expression fold-wise manner relative to the normal tissue to make a GSEA preranked files. Each patient’s file was then examined through GSEA2 version 2.2.3. Perl then pulled the metabolic pathways and recorded the normalized enrichment score in each patient’s GSEA result files. Normalized enrichment scores were then compared for each of gemcitabine’s treatment response categories and analyzed by GraphPad Prism 5 (GraphPad Software Inc., CA, USA).
Additional information on animal studies, protocols for western blotting, real-time PCR analysis, adipocyte-conditioned medium preparation, Nile Red staining, immunohistochemistry, ROS assays, cell surface staining, and sphere formation assay are provided in Supplementary Materials and Methods.
RESULTS
Fatty Acid Synthase (FASN) expression correlates with cancer progression, poor patient prognosis, and poor gemcitabine therapy response
To investigate the role of metabolic pathways in imparting gemcitabine resistance, we leveraged TCGA datasets for pancreatic ductal adenocarcinoma patients and evaluated the impact of the major metabolic pathways on prognosis in gemcitabine-treated patients. We compared relative metabolic pathway enrichments between gemcitabine-treated patients with complete response and the ones with clinical progressive disease (Supplementary Table S1). We observed that only fatty acid metabolism pathway was significantly enriched in patients with progressive disease, compared to the patients with complete response, in all stage patients as well as stage II patients only (Fig 1A). De novo fatty acid biosynthesis is triggered by FASN, which catalyzes the synthesis of palmitate from acetyl-CoA and malonyl-CoA in the presence of NADPH. We next evaluated if FASN expression correlated with cancer progression in the spontaneous progression model of pancreatic cancer. We harvested pancreatic tissue specimens from KrasLSL.G12D/+; p53R172H/+; Pdx1-Cretg/+ (KPC) spontaneous progression model at multiple stages of cancer progression (26). As early as 100 days post-birth, we observed a 30-fold increase in FASN expression in KPC mice pancreas (Fig 1B). Next we evaluated if FASN expression correlated with survival in human pancreatic cancer patients. We performed immunohistochemical expression analysis on 39 human PDAC specimens, where patients were subjected to gemcitabine chemotherapy (Fig 1C, Supplementary Table S2). We observed a median patient survival of 0.46 year when FASN expression in tumors was high with a composite score greater than 7.5 (out of a maximum score of 15) (Fig 1D). However, we observed a median patient survival of 0.74 years when the FASN composite expression score was less than 7.5. The survival difference in the two groups is significant (p value = 0.0285; Mantel-Cox log-rank test). Next we compared if FASN expression correlated with gemcitabine response in established pancreatic cancer cell lines. We evaluated FASN expression at mRNA levels in BxPC3, Capan-1, Capan-2, CFPAC-1, HPAFII, HuPT3, MIAPaCa2, PANC-1, S2-013, S2-007, SUIT2, T3M4, PaTu8902, QGP-1, SW1990, AsPC-1, and DAN-G human pancreatic cancer cell lines by performing real-time PCR analysis (Supplementary Table S3). We observed a Spearman correlation coefficient of 0.615 (p value = 0.0252) between FASN expression and gemcitabine IC50, indicated an inverse correlation between FASN expression and gemcitabine response (Fig 1E).
Figure 1. FASN expression correlates with disease progression and poor response to therapy in pancreatic cancer.
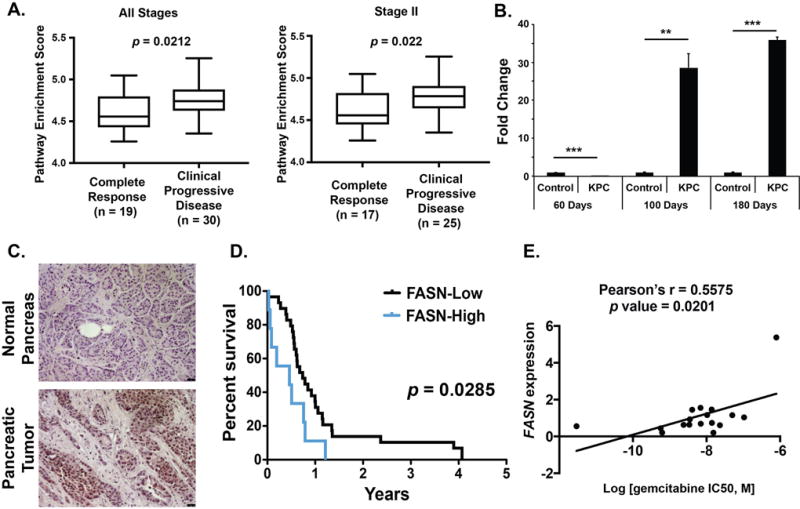
(A) Pathway enrichment score comparisons for lipid metabolism pathway in gemcitabine-treated all stage or stage II pancreatic ductal adenocarcinoma patients with complete response or clinical progressive disease. (B) Pancreas tissues from KPC spontaneous progression model of pancreatic cancer and littermate controls were harvested at the indicated time points and the expression of FASN was determined by real-time PCR. Values normalized to Actb (beta-actin) mRNA levels are presented relative to normalized mRNA levels in control mice pancreas at 60 days post-birth. (C) Representative sections indicating the expression of FASN by IHC in human pancreatic tumors and uninvolved pancreas. (D) Kaplan-Meier plot showing overall survival of pancreatic cancer patients with low and high pancreatic tumor FASN expression (p = 0.0285, log rank test). (E) Correlation between FASN mRNA expression and gemcitabine IC50 in a panel of 17 pancreatic cancer cell lines. Correlation was evaluated with Pearson’s correlation; rho (r) value indicated in the figure. * P ≤ 0.05, ** P ≤ 0.01, *** P ≤ 0.001
Chemical inhibition of FASN synergistically enhances the anti-proliferative effect of gemcitabine in human pancreatic cancer cells
Next, we evaluated if targeting FASN chemically would improve the efficacy of gemcitabine. We utilized Orlistat, an inhibitor of the thioesterase domain of FASN (27). To investigate the effect of orlistat on pancreatic cell lines, we treated a panel of 10 pancreatic cancer cell lines with orlistat and observed an anti-proliferative effect in all cell lines in a concentration dependent manner; the IC50 values are presented in Supplementary Table S4. Furthermore, cell viability analysis of PANC-1 and AsPC-1 under individual treatments or simultaneous/sequential treatments with different doses of gemcitabine and orlistat demonstrated a robust decrease in cell survival when gemcitabine treatment preceded Orlistat treatment (Fig. 2A). Treatment of pancreatic cancer cell lines AsPC-1, PANC-1, Capan-1, and HPAFII with gemcitabine followed by orlistat yielded a combination index (CI) of less than one under all the conditions tested, suggesting synergism (Supplementary Table S5). Furthermore, we observed synergism upon sequential exposure to orlistat and gemcitabine at effect levels exceeding 90% inhibition, as indicated by the isobolograms (Fig. 2B). We also observed decreased growth rates for PANC-1 and AsPC1 pancreatic cancer cells exposed to gemcitabine and orlistat for 72 hours with different schedules of treatment (Fig. 2C). To determine if orlistat and gemcitabine display synergistic anti-proliferative effects over a long period of time, we performed clonogenic assays with PANC-1 and AsPC-1 cells. We observed synergistic reduction in colony counts when cells were sequentially treated with gemcitabine and then orlistat (Fig. 2 D–E and Supplementary Fig. S1). We further confirmed orlistat functional efficacy in PANC-1 and AsPC-1 cells by evaluating lipid accumulation in both PANC-1 and AsPC-1. We observed significant reduction in cellular lipid content in treated cells in comparison to the control cells (Supplementary Fig. S2).
Figure 2. FASN inhibition synergistically enhances the anti-proliferative effect of gemcitabine in human pancreatic cancer cells.
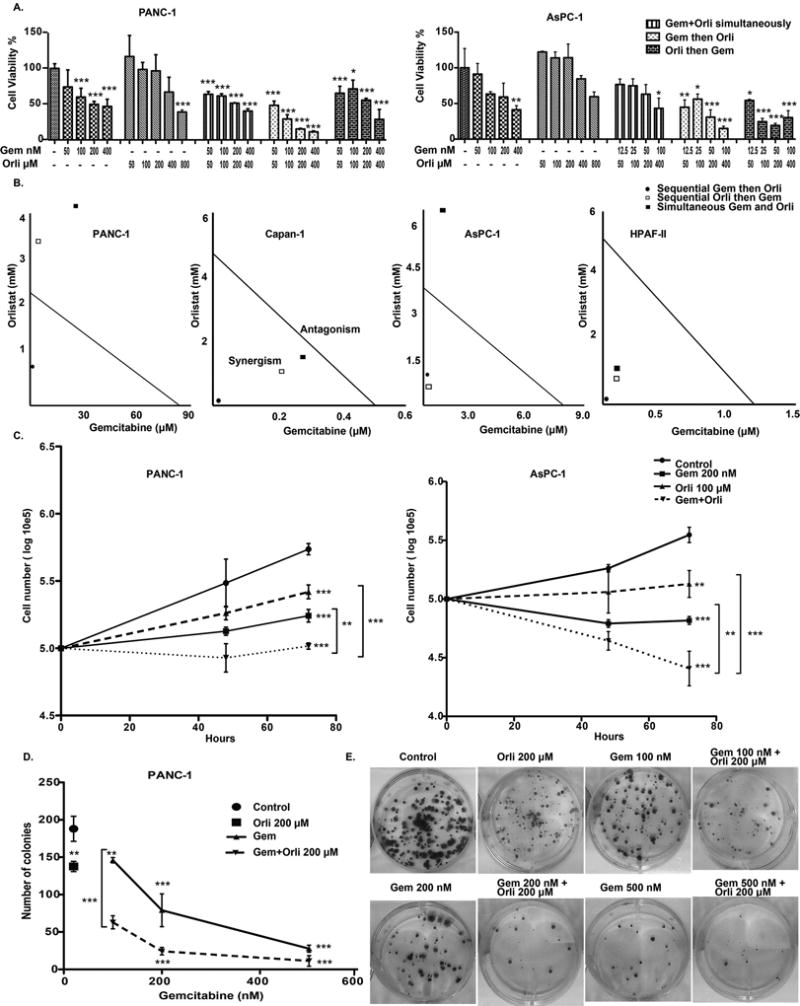
(A) Relative cell viability in PANC-1 and AsPC-1 cells upon treatment with a combination of gemcitabine and orlistat in three different schedules: simultaneously, sequentially and reverse sequentially for 72 hours. Cell viability was assessed using MTT assay. (B) Isobolograms showing the combination indices of gemcitabine and orlistat drug combinations in three different schedules: simultaneously: sequentially and reverse sequentially, for PANC-1, AsPC-1 gemcitabine-resistant cell lines and Capan-1 and HPAF-II gemcitabine-sensitive cell lines at 90% inhibition level. Combination index was calculated from MTT data using Compusyn software. (C) Synergistic effect of orlistat to gemcitabine is shown through cell counting. For the drug combination, gemcitabine and orlistat were used in a sequential schedule. (D) and (E) Clonogenic assay: 500 cells, which were previously treated with different gemcitabine concentrations for 72 hours, were seeded and orlistat was added subsequently. Colonies were stained with crystal violet 0.4% after 30 days and counted using Quantity One- 4.5.0 software. Error bars represent standard deviation. Asterisks indicate statistical significance: * P ≤ 0.05, ** P ≤ 0.01, *** P ≤ 0.001.
In addition to orlistat, we evaluated other lipid synthesis inhibitors for their effect on gemcitabine responsiveness. Platensimycin, which was demonstrated by Merck research laboratories as an antibacterial drug that targets fatty acid synthesis (28), also demonstrated anti-proliferative effect in AsPC-1 cell line and showed a synergistic effect for gemcitabine (Supplementary Fig. S3). We further utilized C75, an irreversible inhibitor of FASN that interacts with the β-ketoacyl synthase, the enoyl reductase and the thioesterase domains (29). We observed synergism at effect levels exceeding 90% inhibition upon sequential exposure of gemcitabine resistant cell lines PANC-1 and AsPC-1 to C75 and gemcitabine (Supplementary Table S6, Supplementary Fig. S4). In addition to direct targeting of FASN, we also evaluated if targeting Sterol Regulatory Element Binding Proteins (SREBPs; transcriptional activators of FASN) (30) would ameliorate gemcitabine responsiveness. Hence, we evaluated the effect of SREBP inhibitor fatostatin on gemcitabine responsiveness of pancreatic cancer cells. Fatostain is a non-sterol diarylthiazole derivative that inhibits adipogenesis (31). We observed synergistic effect of fatostatin with gemcitabine (Supplementary Table S7, Supplementary Fig. S5).
Treatment with exogenous fatty acids does not rescue pancreatic cancer cells from gemcitabine
After establishing the role of fatty acid biosynthesis in regulating fatty gemcitabine responsiveness, we next evaluated if treatment with exogenous fatty acids would make pancreatic cancer cells more resistant to gemcitabine. To achieve this, we treated a panel of pancreatic cancer cell lines with different doses of albumin-conjugated palmitate or stearate, as a control, in the presence or absence of gemcitabine. The addition of albumin-conjugated palmitate or stearate to the medium did not rescue the cells from the effect of gemcitabine (Supplementary Fig. S6).
Despite palmitate being a key nutrient for cancer cells (7), we did not observe any changes in gemcitabine responsiveness in the presence of palmitate. It is plausible that fatty acids other than palmitate may contribute to gemcitabine responsiveness. Hence, we next investigated if directly culturing pancreatic cancer cells with adipocyte-conditioned media would modulate their gemcitabine responsiveness. We treated pancreatic cancer cells with conditioned media collected from 3T3-L1 fibroblasts that were differentiated into adipocytes, as validated by accumulation of large lipid droplets as described previously (32). We observed no change in pancreatic cancer cell line sensitivity toward gemcitabine when cultured with conditioned medium from adipocytes, compared to the cells cultured under control conditions. We also evaluated if depletion of other nutrients would regulate gemcitabine responsiveness by increasing dependence on fatty acids. We did not observe any significant changes in gemcitabine responsiveness of pancreatic cancer cells when cultured with conditioned medium from adipocytes, compared to controls, even under conditions of glucose and glutamine deprivation. Since fetal bovine serum that is added to culture media also contains significant amounts of fatty acids, we also evaluated if serum depletion would increase dependence on exogenous fatty acids and diminish response of pancreatic cancer cells to gemcitabine. However, we observed no significant change in gemcitabine responsiveness under these conditions (Supplementary Fig. S7). To confirm if adipocyte-conditioned media increased fatty acid content in pancreatic cancer cells, we treated PANC-1, AsPC-1, and Capan-1 with adipocyte-conditioned media. We observed significantly increased triglyceride content in PANC-1, and Capan-1 pancreatic cancer cells, upon treatment with adipocyte-conditioned media, compared to culturing under regular media (Supplementary Fig. S8). Hence, our results rule out modulation of gemcitabine responsiveness in pancreatic cancer cells by exogenous fatty acids.
Orlistat causes cell cycle arrest and facilitates gemcitabine-induced apoptosis
We next analyzed the cell cycle progression by staining with propidium iodide and subsequent flow cytometric sorting to investigate the effect of orlistat, alone and in combination with gemcitabine, on PANC-1 cells. We observed G1 arrest of PANC-1 cells upon treatment with orlistat, alone and in combination with gemcitabine (Fig. 3A–B). Cancer cells have increased ROS levels that play an important role in tumor initiation and progression; however, a further increase in ROS levels through extrinsic molecules can exhibit unfavorable conditions that induce apoptosis in cancer cells (33). When we treated PANC-1 cells with the combination of gemcitabine and orlistat, the cells demonstrated a significant increase in ROS levels compared to the control and gemcitabine only treatment conditions (Fig. 3C–D). Next, we evaluated induction of apoptosis by orlistat, gemcitabine, or the combination. We observed significantly increased caspase 3/7 activity, a marker of apoptosis, upon treatment of PANC-1 or AsPC-1 cells with gemcitabine orlistat combination, compared to gemcitabine alone (Fig. 3E–F).
Figure 3. Gemcitabine and orlistat combination induces cell cycle arrest, increased ROS levels, and apoptosis.
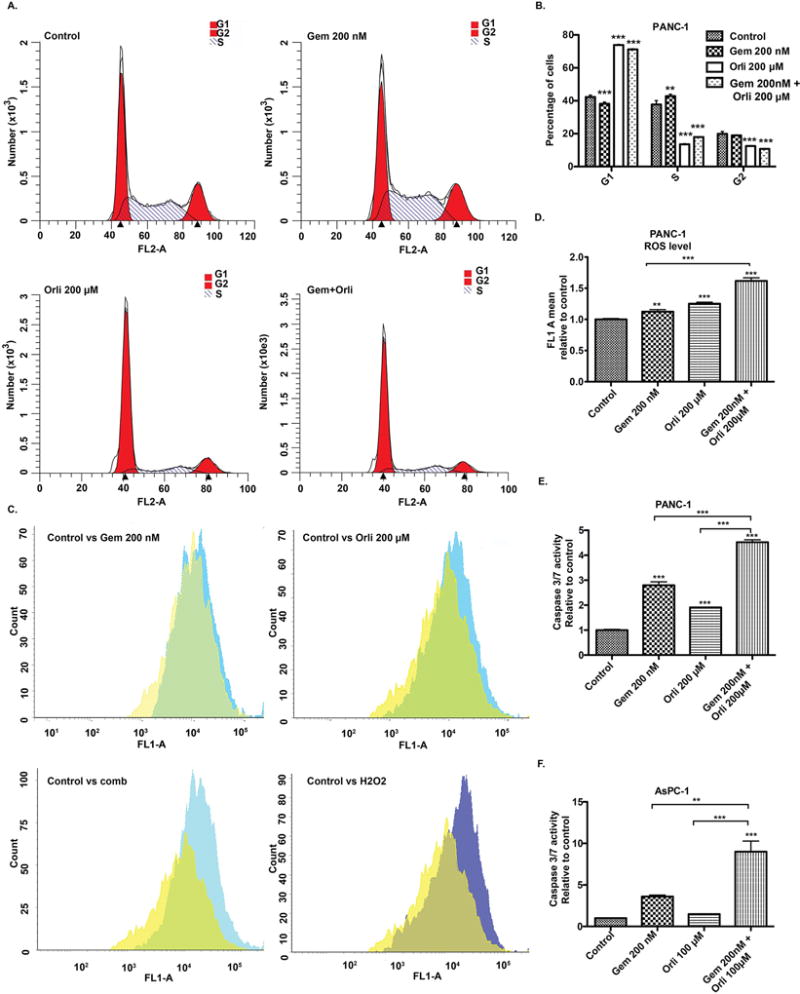
(A) & (B) Cell cycle analysis after treatment with gemcitabine, orlistat, sequential drug combination for 48 hours. The number of cells in each phase of cell cycle upon indicated treatments was compared to the respective control by one-way ANOVA with Dunnett’s post hoc test. (C) & (D) ROS contents after treatment with gemcitabine, orlistat and drug combination for 24 hours analyzed by staining cells with CDFDA. Relative ROS levels upon indicated treatments were compared to the control by one-way ANOVA with Tukey’s post hoc test. (E) & (F) Cellular caspase 3/7 activity was determined by Caspase-Glo assay kit (Promega) and expressed relative to the control. Cells were treated for 72 hours. Relative caspase activity upon indicated treatments was compared to the control by one-way ANOVA with Tukey’s post hoc test. Error bars represent standard deviation. * P ≤ 0.05, ** P ≤ 0.01, *** P ≤ 0.001.
Alterations in gemcitabine metabolism do not explain synergism with orlistat
Resistance to gemcitabine can be imparted at multiple levels including uptake, metabolism and export of the drug outside the cells. Gemcitabine is a hydrophilic molecule and its cellular uptake requires plasma membrane nucleoside transporters. Decreased levels of these transporters confer resistance to gemcitabine toxicity (34). Hence, we investigated if orlistat increased gemcitabine responsiveness by increasing the levels of nucleoside transportation. By performing real-time PCR analysis we observed no significant increase in the levels of ENT1, ENT2, or ENT3; however, the expression level of ENT2 increased significantly upon treatment of PANC-1 cells with orlistat (Fig. 4A). Of the genes involved in gemcitabine export, we observed modest downregulation of ABCC1 upon treatment with orlistat. Instead, we observed an upregulation of ABCB1 and ABCC2 (Fig. 4B). We also evaluated the expression of genes involved in the metabolism of gemcitabine that may regulate its efficacy. Of the genes involved in gemcitabine metabolism, we observed an upregulation of only deocycytidine kinase (dCK) upon treatment with orlistat (Fig. 4C). To functionally validate the effect of the mRNA expression level changes, we determined intracellular concentrations of gemcitabine and its metabolite dFdCMP by performing directed metabolomics. We observed a strong decrease in intracellular concentrations of these metabolites instead of the expected increase in the intracellular pools of these metabolites upon treatment with orlistat, compared to gemcitabine treatment alone (Fig. 4D). Hence, alterations in gemcitabine uptake, export or metabolism cannot explain the synergistic activity of the combination therapy of orlistat and gemcitabine.
Figure 4. Effect of Orlistat on gemcitabine uptake and metabolism.
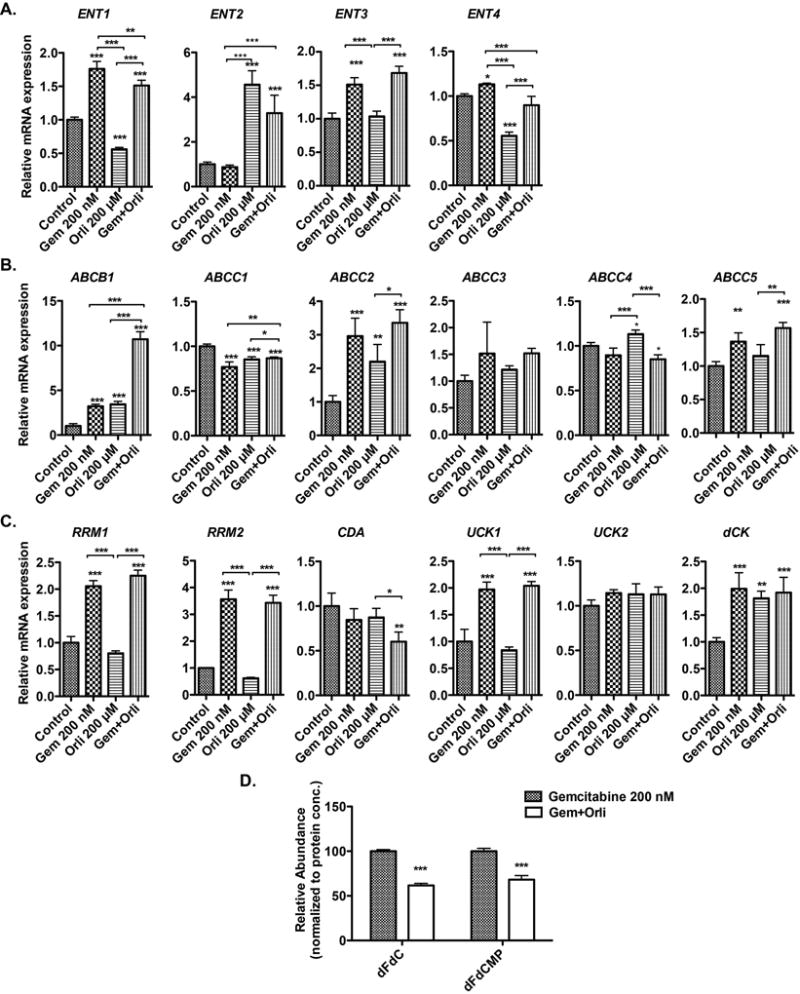
Real-time PCR analysis of genes involved in gemcitabine uptake (A), metabolism (B), and export (C) upon treatment with gemcitabine, orlistat, and combination of gemcitabine and orlistat for 48 hours, relative to ACTB control gene expression in PANC-1 cells. (D) Relative concentrations of gemcitabine (dFdC) and its active metabolite dFdCMP in gemcitabine-only, and gemcitabine-orlistat combination treated (24 hours) PANC-1 cell extracts, as determined by LC-MS/MS analysis. Error bars represent standard deviation. * P ≤ 0.05, ** P ≤ 0.01, *** P ≤ 0.001.
Orlistat decreases the “stemness” of pancreatic cancer cell lines
There is an increasing body of evidence that Cancer Stem Cells (CSC) are largely involved in the drug resistance in cancer (35). We hypothesized that treatment with orlistat decreases the stemness of PANC-1 cells to promote gemcitabine sensitivity. CD133, CD24, CD44, EPCAM and CXCR4 are known pancreatic cancer stem cell markers (36–38). OCT4 has been established as a stem cell marker in head and neck cancer (39). We observed that orlistat treatment significantly decreased the mRNA levels of these stemness markers in a panel of pancreatic cancer cell lines (Fig. 5A). We further analyzed the percentage of cells expressing CD133, CD24, CD44, c-MET, and CXCR4 by performing FACS analysis. We observed that the percentage of PANC-1 or CFPAC-1 cells positive for CD44/CD24, c-MET/CD133, CXCR4/CD133, and CD133/c-MET/CXCR4 were significantly diminished by a combination of orlistat and gemcitabine, compared to gemcitabine treatment alone (Fig. 5B). To further analyze the effect of the treatment on the self-renewal of the stem cells in the PANC-1 cell line, we analyzed secondary sphere formation. PANC-1 cells were cultured in stem cell medium with 200 nM gemcitabine, 200 µM orlistat, or combination for 8 days to investigate their sphere-forming ability. Orlistat alone and the combination with gemcitabine significantly reduced the number of primary spheres formed compared to the control, whereas gemcitabine alone did not have any significant impact (Fig. 5C). We then prepared single cells from these primary spheres and seeded them again under stem cell growth conditions with control, 200 nM gemcitabine, 200 µM orlistat, and in combination for 8 days to investigate the sphere-forming capacities. The sphere self-renewal was calculated (total number of 2° spheres formed/total number of 1° spheres formed). Orlistat alone and the combination treatments caused significant decrease in the self-renewal capacity of the PANC-1 cells as observed by the decreased number and size of secondary spheres (Fig. 5C).
Figure 5. Orlistat decreases the stemness of pancreatic cancer cell lines.
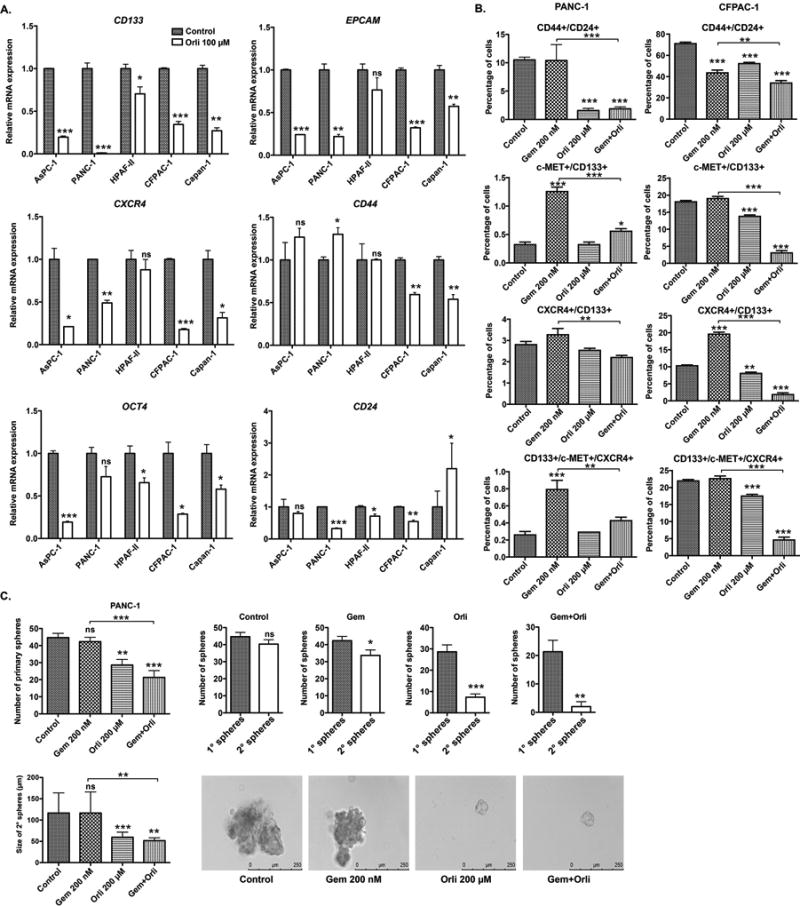
(A) Relative mRNA levels of stemness associated genes in PANC-1 pancreatic cancer cell line upon 48 hours treatment with 100 µM orlistat for 48 hours, determined by real-time PCR analysis. The values are normalized to ACTB control gene expression levels. (B) Relative percentage of PANC-1 and CFPAC-1 cells positive for CD44/CD24, c-MET/CD133, CXCR4/CD133, and CD133/c-MET/CXCR4 stem cell markers upon treatment with control, gemcitabine 200 nM, orlistat 100 µM, and sequential drug combination for 48 hours. (C) Self-renewal capacity of the PANC-1 cells upon treatment with gemcitabine, orlistat and combination. Cells were grown in stem cell growth media in 6-well low attachment plates for 8 days. The single cells from primary spheres were cultured in similar conditions for another 8 days and secondary spheres (micrographs) were assessed. Spheres greater than 50 µM were counted. ns P ≥ 0.05, * P ≤ 0.05, ** P ≤ 0.01, *** P ≤ 0.001.
Synergistic anticancer effects of orlistat and gemcitabine in pancreatic cancer cells are mediated by orlistat-induced endoplasmic reticulum (ER) stress
Our results demonstrate that orlistat induces oxidative stress, which is known to cause ER stress (40). ER stress has been shown to cause chemosensitization in prostate cancer (41). Under ER stress conditions, the cells possess a three-pronged signal-transduction pathway termed the unfolded-protein response (UPR) to adapt the stress, but under irreversible stress conditions these pathways eliminate the damaged cells through activation of apoptosis (42). Hence, we examined the effect of orlistat, alone and in combination of gemcitabine, using gemcitabine alone as a control, in inducing ER stress in pancreatic cancer cells. We observed an increase in the protein levels of ER stress markers, including immunoglobulin-heavy-chain-binding protein (BiP), spliced X-box binding protein 1 (XBP1s), and Activating transcription factor 4 (ATF4) in PANC-1 cells upon exposure to orlistat alone or in combination with gemcitabine (Fig. 6A). Further investigation of C/EBP-homologous protein (CHOP) and BCL-2 expression indicated that the orlistat and gemcitabine combination causes an increase in CHOP protein levels that contribute to the induction of apoptosis through the down-regulation of BCL-2 (Fig. 6A). Finally, the combination showed significant increase in caspase 3/7 activity (Fig. 3E–F).
Figure 6. Orlistat-induced ER stress causes synergism with gemcitabine.
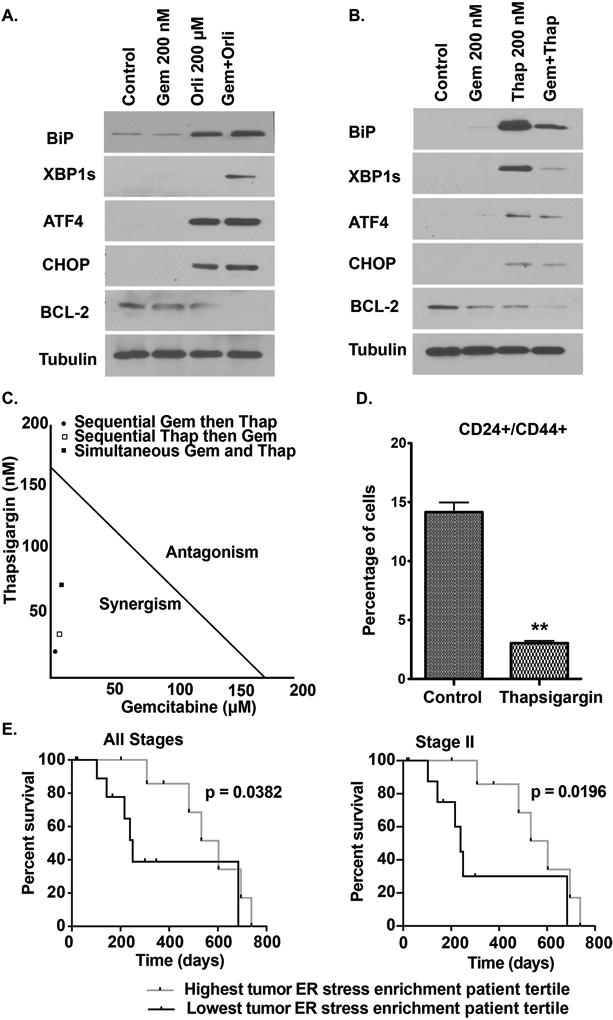
(A) & (B) Western blot analyses of ER stress-related protein levels in PANC-1 cells with indicated treatments at 48 hours post-treatment. (C) Isobologram showing the combination index of gemcitabine and thapsigargin in three different schedules: simultaneous, sequential, and reverse sequential in PANC-1. Combination index was calculated from MTT data using Compusyn software. (D) Relative percentage of PANC-1 cells dual positive for CD24/CD44 stem cell markers upon treatment with control, and thapsigargin for 48 hours. Gem: Gemcitabine, Thap: Thapsigargin. ** P ≤ 0.01, compared to the control by two sample Student’s t-test. (E) Kaplan-Meier survival comparisons between top and bottom tertiles for ER stress marker gene enrichment in TCGA patient tumor specimens. Comparisons are made for all stages (n = 20) and stage II only (n = 18) pancreatic ductal adenocarcinoma patients treated with gemcitabine only by utilizing Gehan-Breslow-Wilcoxon Test.
To confirm the role of ER stress as a likely mechanism for sensitizing pancreatic cancer cells to gemcitabine, we treated the PANC-1 cells with thapsigargin, a known ER stress inducer. Thapsigargin is an inhibitor of the sarcoplasmic/endoplasmic reticulum Ca(2+)-ATPase (SERCA) pumps, and induce ER stress through disruption ER calcium stores (43). Thapsigargin treatment increased protein levels of BiP, ATF4, CHOP, while decreasing BCL-2 protein levels (Fig. 6B). Additionally, thapsigargin had synergistic anti-proliferative effect with gemcitabine (Fig. 6C, Supplementary Table S8). Next, we evaluated if orlistat-induced ER stress contributed to the diminished stemness phenotype that sensitized the cells to gemcitabine. We observed significant reduction in the CD24/CD44 dual positive cell population upon treatment with thapsigargin, suggesting that induction of ER stress diminishes stemness in pancreatic cancer cells (Fig. 6D). Furthermore, we to determine the functional significance of ER stress pathway in patients’ response to gemcitabine, we analyzed the TCGA dataset to evaluate if ER stress response pathway enrichment was associated with survival of PDAC patients on gemcitabine chemotherapy. Our analysis demonstrated that enrichment of ER stress pathway genes in gemcitabine-treated PDAC patients was associated with better overall survival (Fig. 6E). These studies demonstrate that induction of ER stress in PDAC patients leads to better response to gemcitabine and improved patient survival.
Decreased tumor burden in orthotopic implantation model of pancreatic cancer by the sequential combination of orlistat and gemcitabine
To confirm the synergistic effect of orlistat and gemcitabine combination in vivo, we performed orthotopic implantation of PANC-1 luciferase-expressing cells in athymic nude mice. One week post-implantation, the mice were intraperitonially injected with saline control, gemcitabine alone, orlistat alone, or a sequential combination of orlistat and gemcitabine. We began to monitor the tumor volume 8 days after xenotransplantation by performing luciferase imaging with IVIS Spectrum imaging system. Tumors in control, gemcitabine, and orlistat treated animals presented a progressive enlargement in their dimensions, and a mean volume of 900, 900, 500 mm3 was reached at the end of the experimental period in control, gemcitabine and orlistat treated mice, respectively (Fig. 7A–B). Gemcitabine was not able to inhibit tumor growth in vivo, whereas orlistat significantly reduced the tumor growth at later stages, as compared to controls. For tumor-bearing mice receiving the combined treatment of orlistat and gemcitabine, the reduction in tumor growth was significant on or after day 37 post-implantation with respect to controls. Similarly, we observed significant reduction in tumor weight upon necropsy in the combination treatment, as compared to the control, gemcitabine, or orlistat treatment cohorts of PANC-1 tumor-bearing mice (Fig. 7C). Studies have reported reduced body weight in mice treated with fatty acid synthase inhibitors cerulenin and C75 (44). However, in our studies, orlistat alone did not cause weight loss but the combination orlistat and gemcitabine resulted in modest but insignificant weight loss (Fig. 7D). Tumors treated with gemcitabine and orlistat combination showed increased expression of markers for ER stress (CHOP and ATF4) and apoptosis (cleaved caspase3) (Fig.7E).
Figure 7. Enhanced inhibition of tumor growth in an orthotopic implantation model of pancreatic cancer by sequential combination of orlistat and gemcitabine.
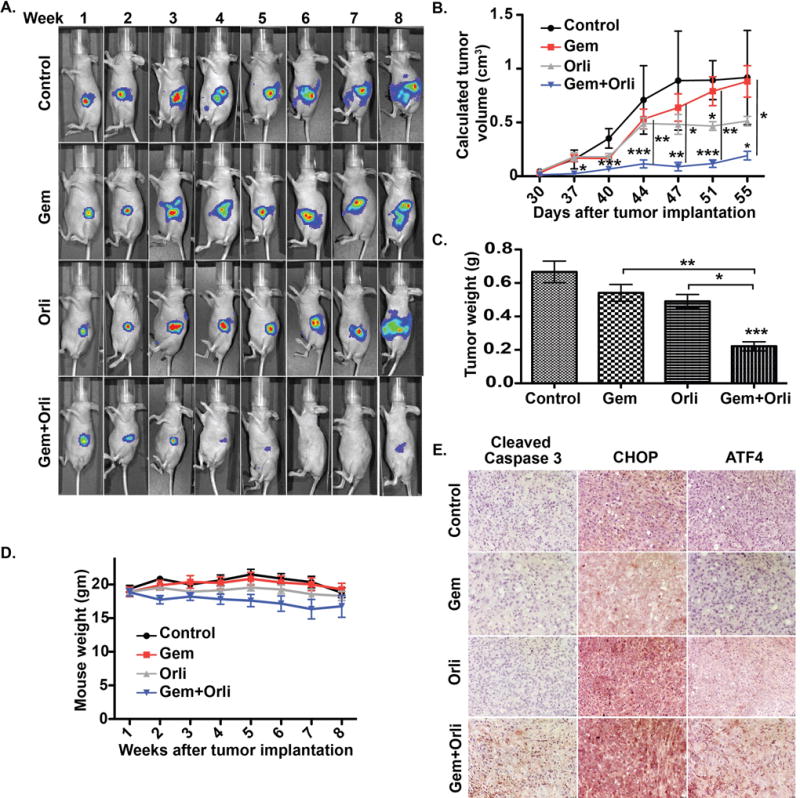
(A) Longitudinal bioluminescence imaging for tumor growth in athymic nude mice othotopically implanted with PANC-1 cells and treated with control, gemcitabine (Gem), Orlistat (Orli), and gemcitabine-orlistat combination (Gem+Orli) for indicated time points. (B) Average tumor volume as measured by calipers starting at day 30 when the tumor could be palpated. The tumor volume was calculated as (length × width2)/2. (C) Average excised tumor weights upon necropsy in different treatment groups. (D) The average mouse weight throughout the experiment, starting at the first week after tumor implantation. (E) Tumor tissue sections stained for cleaved caspase 3, CHOP, and ATF4 by immunohistochemistry from the four treatment groups at 200X Magnification. Error bars represent standard deviation. Asterisks indicate statistical significance: * P ≤ 0.05, ** P ≤ 0.01, *** P ≤ 0.001.
DISSCUSSION
Chemo-resistance in pancreatic cancer patients is a challenging problem with scarce choices of chemotherapeutic agents. Although gemcitabine-based chemotherapy is the mainstay therapy for advanced metastatic exocrine pancreatic cancer, clinical experience does not show a great response for the drug in terms of increasing patient survival. Gemcitabine as chemotherapeutic agent for pancreatic cancer patients was approved mainly because of improvements in disease-related symptoms (5, 45). Many studies have identified different mechanisms for gemcitabine resistance that either cause inadequate drug exposure or result in alteration of cancer cell itself. The latter includes mainly mechanisms related to gemcitabine metabolism (46). Nevertheless, cancer metabolism arose as Achilles heel in the recent years and many studies show promising results in improving therapeutic responsiveness by targeting the unregulated metabolic pathways in different types of cancer (4). Analysis of TCGA dataset identified lipid metabolism pathway to be the most significantly enriched metabolic pathway in tumors from patients with progressive disease compared to the ones with complete response. We hypothesized that interfering with the lipid biosynthesis could overcome resistance against gemcitabine, especially due to the fact that pancreatic tumors up-regulate FASN (15), the key enzyme in de novo lipogenesis. FASN expression is regulated by multiple transcriptional regulators, including c-Myc, which is significantly amplified (up to 14 percent cases in TCGA) and stabilized in PDAC (47). It can also be regulated by liver X receptors (NR1H2 and NR1H3), directly or via SREBP1, or independently by SREBP1, all of which show no significant somatic alterations in TCGA (48). A TCGA analysis indicated no correlation between FASN and c-Myc mRNA expression (Spearman’s correlation coefficient: −0.03541; p= 0.6428; n=174) and a moderate but significant correlation between FASN and SREBF1 (gene coding for SREBP1) mRNA levels (Spearman’s correlation coefficient: 0.3088; p= <0.0001; n=174). Our results demonstrate increased expression of FASN with disease progression in genetically engineered mouse models of pancreatic cancer, as well as human pancreatic tumor specimens, compared to the normal pancreas. Of note, another previous study has demonstrated significantly increased expression of FASN in pancreatic cancer patients that correlated with higher histological grade and recurrence (15). Furthermore, we observed decreased overall survival in pancreatic cancer patients with high FASN expression and a positive correlation between FASN expression in pancreatic cancer cell lines and gemcitabine resistance.
Our results also demonstrate that suppression of lipid biosynthesis sensitizes the cells to the anti-proliferative effects of gemcitabine in in vitro and in vivo studies. A previous study has demonstrated that a decrease in some saturated free fatty acids and an association of lower expression of Lipase genes with poorer prognosis in patients with pancreatic cancer (49). While some of the exogenous free fatty acids may serve growth inhibitory functions, de novo synthesis of lipids is critical for cancer cell growth in general due to the need of lipids for plasma membrane (50). Orlistat, a FASN inhibitor, showed anti-proliferative effects in cancer (51). The synergistic effect of orlistat for the gemcitabine anti-proliferative effect supports our hypothesis that manipulating lipid biosynthesis sensitizes the cells to gemcitabine. We evaluated three more molecules: C75, platensimycin, and fatostatin. The former two have the same action of orlistat as fatty acid synthase inhibitor, while the latter is an inhibitor of SREBP activation (52).
Next, we investigated if exogenously supplied albumin-conjugated fatty acids could rescue the effect of gemcitabine. However, incubation of the cells with albumin-conjugated fatty acids in the media did not show any survival improvement in response to gemcitabine. Furthermore, we evaluated the effect of surrounding adipocytes to the cancer, as a source of extrinsic fat to cancer cells, on gemcitabine responsiveness by incubating the cancer cells with adipocyte-conditioned media. However, treatment with adipocyte-conditioned media failed to promote resistance in the pancreatic cancer cell lines. These results suggest that while fatty acid biosynthesis pathway is a critical modulator of gemcitabine responsiveness, the resistance per se may not be directly dependent on the fatty acid accumulation in the cells.
Next, we focused on evaluating the mechanism of synergism between gemcitabine and orlistat. Alterations in gemcitabine uptake, metabolism or export would regulate the effective intracellular levels of gemcitabine and may be a potential mechanism for the synergistic relationship. Many proteins in these pathways, such as deoxycytidine kinase (dCK) (53), Human equilibrative nucleoside transporters (hENT) (54), and ribonucleotide reductase (RRM) (55), have been associated with gemcitabine responsiveness in different cancer cell lines. Of the gemcitabine influx transporters only hENT2 expression increased with orlistat or the combination treatment. Contrastingly, we observed increased levels of ABCB1 gemcitabine exporter upon treatment with orlistat. Overall, we observed a modest but significant decrease in the intracellular levels of gemcitabine metabolites, suggesting that alterations in gemcitabine uptake, metabolism, and export may not be responsible for the orlistat gemcitabine synergism.
Stemness is an emerging mechanism for chemoresistance in cancer cells and many studies showed that the stem side population cells exhibit higher resistance to chemotherapy than the main bulk of tumor cells (56). Furthermore, it has been shown that CD133-positive cells isolated from pancreatic cancer patients were dramatically more resistant to gemcitabine compared to CD133-negative cells (57). We observed that orlistat and orlistat-gemcitabine combination decreases the expression of the pancreatic cancer stem markers and secondary sphere formation.
How does orlistat and gemcitabine combination decrease stemness in pancreatic cancer cells? Several studies highlighted important connections between lipid synthesis pathways and ER stress response (58, 59). Hence, we hypothesized that inhibition of fatty acid synthesis sensitized the cells for gemcitabine effect by diminishing stemness via inducing apoptosis through the ER stress. We observed that the drug combination causes a robust increase in many ER stress pathways with a decrease in BCL2, and a significant increase in caspase activity. To directly confirm our hypothesis, we evaluated a known ER stress inducer, thapsigargin, which demonstrated a synergistic effect with gemcitabine and induced the expression of ER stress markers. Furthermore, direct induction of ER stress caused a decrease in stemness. Enrichment of ER stress pathway in gemcitabine-treated pancreatic cancer patients correlated with improved survival in TCGA cohort.
In conclusion, our studies link FASN expression with cancer progression and prognosis. Furthermore, we establish that fatty acid biosynthesis but not exogenous fatty acid uptake causes resistance to gemcitabine and that targeting fatty acid biosynthesis with orlistat has synergistic activity with gemcitabine in pancreatic cancer cells. We also demonstrate that the synergism by the drug combination is caused by induction of ER stress that diminishes stemness and induces apoptosis in pancreatic cancer cells. Hence, our studies provide novel insights into mechanisms of resistance in pancreatic cancer and may facilitate development of novel therapeutic approaches for effective management of pancreatic cancer.
Supplementary Material
Acknowledgments
We gratefully thank Dr. Paul M. Grandgenett and Michael (Tony) Hollingsworth for pancreatic cancer rapid autopsy tissue specimens.
Financial Support: This work was supported in part by funding from the National Institutes of Health grant (R01 CA163649, R01 CA210439, and R01 CA216853, NCI) to P.K. Singh; American Association for Cancer Research (AACR)-Pancreatic Cancer Action Network (PanCAN) Career Development Award (30-20-25-SING) to P.K. Singh; the Specialized Programs for Research Excellence (SPORE, 2P50 CA127297, NCI) to P.K. Singh. We would also like to acknowledge the Fred & Pamela Buffett Cancer Center Support Grant (P30CA036727, NCI) for supporting shared resources. The funders had no role in study design, data collection and analysis, decision to publish, or preparation of the manuscript.
References
- 1.Siegel RL, Miller KD, Jemal A. Cancer statistics, 2015. CA Cancer J Clin. 2015;65:5–29. doi: 10.3322/caac.21254. [DOI] [PubMed] [Google Scholar]
- 2.Bilimoria KY, Bentrem DJ, Ko CY, Ritchey J, Stewart AK, Winchester DP, et al. Validation of the 6th edition AJCC Pancreatic Cancer Staging System: report from the National Cancer Database. Cancer. 2007;110:738–44. doi: 10.1002/cncr.22852. [DOI] [PubMed] [Google Scholar]
- 3.Hartwig W, Werner J, Jager D, Debus J, Buchler MW. Improvement of surgical results for pancreatic cancer. Lancet Oncol. 2013;14:e476–85. doi: 10.1016/S1470-2045(13)70172-4. [DOI] [PubMed] [Google Scholar]
- 4.Vander Heiden MG. Targeting cancer metabolism: a therapeutic window opens. Nat Rev Drug Discov. 2011;10:671–84. doi: 10.1038/nrd3504. [DOI] [PubMed] [Google Scholar]
- 5.Shukla SK, Purohit V, Mehla K, Gunda V, Chaika NV, Vernucci E, et al. MUC1 and HIF-1alpha Signaling Crosstalk Induces Anabolic Glucose Metabolism to Impart Gemcitabine Resistance to Pancreatic Cancer. Cancer Cell. 2017;32:71–87. e7. doi: 10.1016/j.ccell.2017.06.004. [DOI] [PMC free article] [PubMed] [Google Scholar]
- 6.Gunda V, Souchek JJ, Abrego J, Shukla SK, Goode GD, Vernucci E, et al. MUC1-mediated metabolic alterations regulate response to radiotherapy in pancreatic cancer. Clin Cancer Res. 2017 doi: 10.1158/1078-0432.CCR-17-1151. [DOI] [PMC free article] [PubMed] [Google Scholar]
- 7.Vander Heiden MG, Cantley LC, Thompson CB. Understanding the Warburg effect: the metabolic requirements of cell proliferation. Science. 2009;324:1029–33. doi: 10.1126/science.1160809. [DOI] [PMC free article] [PubMed] [Google Scholar]
- 8.Attri KS, Murthy D, Singh PK. Racial disparity in metabolic regulation of cancer. Front Biosci (Landmark Ed) 2017;22:1221–46. doi: 10.2741/4543. [DOI] [PMC free article] [PubMed] [Google Scholar]
- 9.Mehla K, Singh PK. MUC1: a novel metabolic master regulator. Biochim Biophys Acta. 2014;1845:126–35. doi: 10.1016/j.bbcan.2014.01.001. [DOI] [PMC free article] [PubMed] [Google Scholar]
- 10.Abrego J, Gunda V, Vernucci E, Shukla SK, King RJ, Dasgupta A, et al. GOT1-mediated anaplerotic glutamine metabolism regulates chronic acidosis stress in pancreatic cancer cells. Cancer letters. 2017;400:37–46. doi: 10.1016/j.canlet.2017.04.029. [DOI] [PMC free article] [PubMed] [Google Scholar]
- 11.Goode G, Gunda V, Chaika NV, Purohit V, Yu F, Singh PK. MUC1 facilitates metabolomic reprogramming in triple-negative breast cancer. PLoS One. 2017;12:e0176820. doi: 10.1371/journal.pone.0176820. [DOI] [PMC free article] [PubMed] [Google Scholar]
- 12.Goodwin J, Neugent ML, Lee SY, Choe JH, Choi H, Jenkins DMR, et al. The distinct metabolic phenotype of lung squamous cell carcinoma defines selective vulnerability to glycolytic inhibition. Nat Commun. 2017;8:15503. doi: 10.1038/ncomms15503. [DOI] [PMC free article] [PubMed] [Google Scholar]
- 13.Kuhajda FP, Jenner K, Wood FD, Hennigar RA, Jacobs LB, Dick JD, et al. Fatty acid synthesis: a potential selective target for antineoplastic therapy. Proc Natl Acad Sci U S A. 1994;91:6379–83. doi: 10.1073/pnas.91.14.6379. [DOI] [PMC free article] [PubMed] [Google Scholar]
- 14.Epstein JI, Carmichael M, Partin AW. OA-519 (fatty acid synthase) as an independent predictor of pathologic state in adenocarcinoma of the prostate. Urology. 1995;45:81–6. doi: 10.1016/s0090-4295(95)96904-7. [DOI] [PubMed] [Google Scholar]
- 15.Alo PL, Amini M, Piro F, Pizzuti L, Sebastiani V, Botti C, et al. Immunohistochemical expression and prognostic significance of fatty acid synthase in pancreatic carcinoma. Anticancer research. 2007;27:2523–7. [PubMed] [Google Scholar]
- 16.De Schrijver E, Brusselmans K, Heyns W, Verhoeven G, Swinnen JV. RNA interference-mediated silencing of the fatty acid synthase gene attenuates growth and induces morphological changes and apoptosis of LNCaP prostate cancer cells. Cancer Res. 2003;63:3799–804. [PubMed] [Google Scholar]
- 17.Kuhajda FP, Pizer ES, Li JN, Mani NS, Frehywot GL, Townsend CA. Synthesis and antitumor activity of an inhibitor of fatty acid synthase. Proc Natl Acad Sci U S A. 2000;97:3450–4. doi: 10.1073/pnas.050582897. [DOI] [PMC free article] [PubMed] [Google Scholar]
- 18.Souchek JJ, Davis AL, Hill TK, Holmes MB, Qi B, Singh PK, et al. Combination treatment with orlistat-containing nanoparticles and taxanes is synergistic and enhances microtubule stability in taxane-resistant prostate cancer cells. Molecular cancer therapeutics. 2017 doi: 10.1158/1535-7163.MCT-17-0013. [DOI] [PMC free article] [PubMed] [Google Scholar]
- 19.Chaika NV, Gebregiworgis T, Lewallen ME, Purohit V, Radhakrishnan P, Liu X, et al. MUC1 mucin stabilizes and activates hypoxia-inducible factor 1 alpha to regulate metabolism in pancreatic cancer. Proc Natl Acad Sci U S A. 2012;109:13787–92. doi: 10.1073/pnas.1203339109. [DOI] [PMC free article] [PubMed] [Google Scholar]
- 20.Hosek J, Zavalova V, Kollar P. Effect of solvent on cytotoxicity and bioavailability of fatty acids. Immunopharmacology and immunotoxicology. 2010;32:462–5. doi: 10.3109/08923970903513147. [DOI] [PubMed] [Google Scholar]
- 21.Shukla SK, Gebregiworgis T, Purohit V, Chaika NV, Gunda V, Radhakrishnan P, et al. Metabolic reprogramming induced by ketone bodies diminishes pancreatic cancer cachexia. Cancer & metabolism. 2014;2:18. doi: 10.1186/2049-3002-2-18. [DOI] [PMC free article] [PubMed] [Google Scholar]
- 22.Torres MP, Rachagani S, Purohit V, Pandey P, Joshi S, Moore ED, et al. Graviola: a novel promising natural-derived drug that inhibits tumorigenicity and metastasis of pancreatic cancer cells in vitro and in vivo through altering cell metabolism. Cancer letters. 2012;323:29–40. doi: 10.1016/j.canlet.2012.03.031. [DOI] [PMC free article] [PubMed] [Google Scholar]
- 23.Shukla SK, Dasgupta A, Mehla K, Gunda V, Vernucci E, Souchek J, et al. Silibinin-mediated metabolic reprogramming attenuates pancreatic cancer-induced cachexia and tumor growth. Oncotarget. 2015;6:41146–61. doi: 10.18632/oncotarget.5843. [DOI] [PMC free article] [PubMed] [Google Scholar]
- 24.Shukla SK, Gunda V, Abrego J, Haridas D, Mishra A, Souchek J, et al. MUC16-mediated activation of mTOR and c-Myc reprograms pancreatic cancer metabolism. Oncotarget. 2015 doi: 10.18632/oncotarget.4078. [DOI] [PMC free article] [PubMed] [Google Scholar]
- 25.Chou TC. Theoretical basis, experimental design, and computerized simulation of synergism and antagonism in drug combination studies. Pharmacological reviews. 2006;58:621–81. doi: 10.1124/pr.58.3.10. [DOI] [PubMed] [Google Scholar]
- 26.Hingorani SR, Wang L, Multani AS, Combs C, Deramaudt TB, Hruban RH, et al. Trp53R172H and KrasG12D cooperate to promote chromosomal instability and widely metastatic pancreatic ductal adenocarcinoma in mice. Cancer Cell. 2005;7:469–83. doi: 10.1016/j.ccr.2005.04.023. [DOI] [PubMed] [Google Scholar]
- 27.Kridel SJ, Axelrod F, Rozenkrantz N, Smith JW. Orlistat is a novel inhibitor of fatty acid synthase with antitumor activity. Cancer Res. 2004;64:2070–5. doi: 10.1158/0008-5472.can-03-3645. [DOI] [PubMed] [Google Scholar]
- 28.Wang J, Soisson SM, Young K, Shoop W, Kodali S, Galgoci A, et al. Platensimycin is a selective FabF inhibitor with potent antibiotic properties. Nature. 2006;441:358–61. doi: 10.1038/nature04784. [DOI] [PubMed] [Google Scholar]
- 29.Pizer ES, Chrest FJ, DiGiuseppe JA, Han WF. Pharmacological inhibitors of mammalian fatty acid synthase suppress DNA replication and induce apoptosis in tumor cell lines. Cancer Res. 1998;58:4611–5. [PubMed] [Google Scholar]
- 30.Furuta E, Pai SK, Zhan R, Bandyopadhyay S, Watabe M, Mo YY, et al. Fatty acid synthase gene is up-regulated by hypoxia via activation of Akt and sterol regulatory element binding protein-1. Cancer Res. 2008;68:1003–11. doi: 10.1158/0008-5472.CAN-07-2489. [DOI] [PubMed] [Google Scholar]
- 31.Choi Y, Kawazoe Y, Murakami K, Misawa H, Uesugi M. Identification of bioactive molecules by adipogenesis profiling of organic compounds. J Biol Chem. 2003;278:7320–4. doi: 10.1074/jbc.M210283200. [DOI] [PubMed] [Google Scholar]
- 32.Green H, Meuth M. An established pre-adipose cell line and its differentiation in culture. Cell. 1974;3:127–33. doi: 10.1016/0092-8674(74)90116-0. [DOI] [PubMed] [Google Scholar]
- 33.Trachootham D, Alexandre J, Huang P. Targeting cancer cells by ROS-mediated mechanisms: a radical therapeutic approach? Nat Rev Drug Discov. 2009;8:579–91. doi: 10.1038/nrd2803. [DOI] [PubMed] [Google Scholar]
- 34.Mackey JR, Mani RS, Selner M, Mowles D, Young JD, Belt JA, et al. Functional nucleoside transporters are required for gemcitabine influx and manifestation of toxicity in cancer cell lines. Cancer Res. 1998;58:4349–57. [PubMed] [Google Scholar]
- 35.Hu G, Li F, Ouyang K, Xie F, Tang X, Wang K, et al. Intrinsic gemcitabine resistance in a novel pancreatic cancer cell line is associated with cancer stem cell-like phenotype. Int J Oncol. 2012;40:798–806. doi: 10.3892/ijo.2011.1254. [DOI] [PubMed] [Google Scholar]
- 36.Li C, Lee CJ, Simeone DM. Identification of human pancreatic cancer stem cells. Methods Mol Biol. 2009;568:161–73. doi: 10.1007/978-1-59745-280-9_10. [DOI] [PubMed] [Google Scholar]
- 37.Abel EV, Kim EJ, Wu J, Hynes M, Bednar F, Proctor E, et al. The Notch pathway is important in maintaining the cancer stem cell population in pancreatic cancer. PloS one. 2014;9:e91983. doi: 10.1371/journal.pone.0091983. [DOI] [PMC free article] [PubMed] [Google Scholar]
- 38.Abel EV, Simeone DM. Biology and clinical applications of pancreatic cancer stem cells. Gastroenterology. 2013;144:1241–8. doi: 10.1053/j.gastro.2013.01.072. [DOI] [PubMed] [Google Scholar]
- 39.Reers S, Pfannerstill AC, Maushagen R, Pries R, Wollenberg B. Stem cell profiling in head and neck cancer reveals an Oct-4 expressing subpopulation with properties of chemoresistance. Oral Oncol. 2014;50:155–62. doi: 10.1016/j.oraloncology.2013.12.006. [DOI] [PubMed] [Google Scholar]
- 40.Malhotra JD, Miao H, Zhang K, Wolfson A, Pennathur S, Pipe SW, et al. Antioxidants reduce endoplasmic reticulum stress and improve protein secretion. Proc Natl Acad Sci U S A. 2008;105:18525–30. doi: 10.1073/pnas.0809677105. [DOI] [PMC free article] [PubMed] [Google Scholar]
- 41.Wu Y, Fabritius M, Ip C. Chemotherapeutic sensitization by endoplasmic reticulum stress: increasing the efficacy of taxane against prostate cancer. Cancer Biol Ther. 2009;8:146–52. doi: 10.4161/cbt.8.2.7087. [DOI] [PMC free article] [PubMed] [Google Scholar]
- 42.Hetz C. The unfolded protein response: controlling cell fate decisions under ER stress and beyond. Nat Rev Mol Cell Biol. 2012;13:89–102. doi: 10.1038/nrm3270. [DOI] [PubMed] [Google Scholar]
- 43.Lytton J, Westlin M, Hanley MR. Thapsigargin inhibits the sarcoplasmic or endoplasmic reticulum Ca-ATPase family of calcium pumps. J Biol Chem. 1991;266:17067–71. [PubMed] [Google Scholar]
- 44.Loftus TM, Jaworsky DE, Frehywot GL, Townsend CA, Ronnett GV, Lane MD, et al. Reduced food intake and body weight in mice treated with fatty acid synthase inhibitors. Science. 2000;288:2379–81. doi: 10.1126/science.288.5475.2379. [DOI] [PubMed] [Google Scholar]
- 45.Saif MW. Pancreatic cancer: is this bleak landscape finally changing? Highlights from the '43rd ASCO Annual Meeting'. Chicago, IL, USA. June 1–5, 2007. JOP. 2007;8:365–73. [PubMed] [Google Scholar]
- 46.de Sousa Cavalcante L, Monteiro G. Gemcitabine: metabolism and molecular mechanisms of action, sensitivity and chemoresistance in pancreatic cancer. European journal of pharmacology. 2014;741:8–16. doi: 10.1016/j.ejphar.2014.07.041. [DOI] [PubMed] [Google Scholar]
- 47.Edmunds LR, Sharma L, Kang A, Lu J, Vockley J, Basu S, et al. c-Myc programs fatty acid metabolism and dictates acetyl-CoA abundance and fate. J Biol Chem. 2014;289:25382–92. doi: 10.1074/jbc.M114.580662. [DOI] [PMC free article] [PubMed] [Google Scholar]
- 48.Joseph SB, Laffitte BA, Patel PH, Watson MA, Matsukuma KE, Walczak R, et al. Direct and indirect mechanisms for regulation of fatty acid synthase gene expression by liver X receptors. J Biol Chem. 2002;277:11019–25. doi: 10.1074/jbc.M111041200. [DOI] [PubMed] [Google Scholar]
- 49.Zhang G, He P, Tan H, Budhu A, Gaedcke J, Ghadimi BM, et al. Integration of metabolomics and transcriptomics revealed a fatty acid network exerting growth inhibitory effects in human pancreatic cancer. Clin Cancer Res. 2013;19:4983–93. doi: 10.1158/1078-0432.CCR-13-0209. [DOI] [PMC free article] [PubMed] [Google Scholar]
- 50.Swierczynski J, Hebanowska A, Sledzinski T. Role of abnormal lipid metabolism in development, progression, diagnosis and therapy of pancreatic cancer. World J Gastroenterol. 2014;20:2279–303. doi: 10.3748/wjg.v20.i9.2279. [DOI] [PMC free article] [PubMed] [Google Scholar]
- 51.Menendez JA, Vellon L, Lupu R. Antitumoral actions of the anti-obesity drug orlistat (XenicalTM) in breast cancer cells: blockade of cell cycle progression, promotion of apoptotic cell death and PEA3-mediated transcriptional repression of Her2/neu (erbB-2) oncogene. Ann Oncol. 2005;16:1253–67. doi: 10.1093/annonc/mdi239. [DOI] [PubMed] [Google Scholar]
- 52.Kamisuki S, Mao Q, Abu-Elheiga L, Gu Z, Kugimiya A, Kwon Y, et al. A small molecule that blocks fat synthesis by inhibiting the activation of SREBP. Chemistry & biology. 2009;16:882–92. doi: 10.1016/j.chembiol.2009.07.007. [DOI] [PubMed] [Google Scholar]
- 53.van Haperen VW, Veerman G, Vermorken JB, Pinedo HM, Peters G. Regulation of phosphorylation of deoxycytidine and 2',2'-difluorodeoxycytidine (gemcitabine); effects of cytidine 5'-triphosphate and uridine 5'-triphosphate in relation to chemosensitivity for 2',2'-difluorodeoxycytidine. Biochem Pharmacol. 1996;51:911–8. doi: 10.1016/0006-2952(95)02402-6. [DOI] [PubMed] [Google Scholar]
- 54.Giovannetti E, Del Tacca M, Mey V, Funel N, Nannizzi S, Ricci S, et al. Transcription analysis of human equilibrative nucleoside transporter-1 predicts survival in pancreas cancer patients treated with gemcitabine. Cancer Res. 2006;66:3928–35. doi: 10.1158/0008-5472.CAN-05-4203. [DOI] [PubMed] [Google Scholar]
- 55.Duxbury MS, Ito H, Zinner MJ, Ashley SW, Whang EE. RNA interference targeting the M2 subunit of ribonucleotide reductase enhances pancreatic adenocarcinoma chemosensitivity to gemcitabine. Oncogene. 2004;23:1539–48. doi: 10.1038/sj.onc.1207272. [DOI] [PubMed] [Google Scholar]
- 56.Subramaniam D, Ramalingam S, Houchen CW, Anant S. Cancer stem cells: a novel paradigm for cancer prevention and treatment. Mini reviews in medicinal chemistry. 2010;10:359–71. doi: 10.2174/138955710791330954. [DOI] [PMC free article] [PubMed] [Google Scholar]
- 57.Hermann PC, Huber SL, Herrler T, Aicher A, Ellwart JW, Guba M, et al. Distinct populations of cancer stem cells determine tumor growth and metastatic activity in human pancreatic cancer. Cell Stem Cell. 2007;1:313–23. doi: 10.1016/j.stem.2007.06.002. [DOI] [PubMed] [Google Scholar]
- 58.Hou NS, Gutschmidt A, Choi DY, Pather K, Shi X, Watts JL, et al. Activation of the endoplasmic reticulum unfolded protein response by lipid disequilibrium without disturbed proteostasis in vivo. Proc Natl Acad Sci U S A. 2014;111:E2271–80. doi: 10.1073/pnas.1318262111. [DOI] [PMC free article] [PubMed] [Google Scholar]
- 59.Volmer R, van der Ploeg K, Ron D. Membrane lipid saturation activates endoplasmic reticulum unfolded protein response transducers through their transmembrane domains. Proc Natl Acad Sci U S A. 2013;110:4628–33. doi: 10.1073/pnas.1217611110. [DOI] [PMC free article] [PubMed] [Google Scholar]
Associated Data
This section collects any data citations, data availability statements, or supplementary materials included in this article.