Abstract
Purpose
To develop polymer nanoassemblies (PNAs) modified with halofluorochromic dyes to allow for the detection of liver metastatic colorectal cancer (CRC) to improve therapeutic outcomes.
Methods
We combine experimental and computational approaches to evaluate macroscopic and microscopic PNA distributions in patient-derived xenograft primary and orthotropic liver metastatic CRC tumors. Halofluorochromic and non-halofluorochromic PNAs (hfPNAs and n-hfPNAs) were prepared from poly(ethylene glycol), fluorescent dyes (Nile blue, Alexa546, and IR820), and hydrophobic groups (palmitate), all of which were covalently tethered to a cationic polymer scaffold [poly(ethylene imine) or poly(lysine)] forming particles with an average diameter < 30 nm.
Results
Dye-conjugated PNAs showed no aggregation under opsonizing conditions for 24 h and displayed low tissue diffusion and cellular uptake. Both hfPNAs and n-hfPNAs accumulated in primary and liver metastatic CRC tumors within 12 h post intravenous injection. In comparison to n-hfPNAs, hfPNAs fluoresced strongly only in the acidic tumor microenvironment (pH<7.0) and distinguished small metastatic CRC tumors from healthy liver stroma. Computational simulations revealed that PNAs would steadily accumulate mainly in acidic (hypoxic) interstitium of metastatic tumors, independently of the vascularization degree of the tissue surrounding the lesions.
Conclusion
The combined experimental and computational data confirms that hfPNAs detecting acidic tumor tissue can be used to identify small liver metastatic CRC tumors with improved accuracy.
Keywords: Theranostics, tumor microenvironment, tissue acidity, computational tumor simulation, nanoparticle distribution simulation
INTRODUCTION
Colorectal cancer (CRC) is the second leading cause of deaths in adult cancer patients in the United States, and its metastasis accounts for more than 90% of the mortality (1, 2). However, successful treatment of CRC is often hampered by the lack of methods to detect metastatic CRC tumors early and accurately deliver anticancer drugs to the tumor tissue with low side effects. Nanoparticles are promising tools to address these problems because they can selectively accumulate in solid tumors and thus may deliver therapeutic and imaging agents in higher concentrations to metastatic CRC. Although many nanoparticles have been developed to integrate therapy and diagnosis of cancer, their clinical benefits remain elusive due to several factors affecting in vivo performance of ‘theranostic’ nanoparticles.
One major factor is the tissue microenvironment that changes during treatment or imaging of metastatic CRC tumors. In comparison to primary CRC tumors comprising large lesions and high blood vessel density, metastatic CRC tumors are generally too small to develop blood vessels inducing enhanced nanoparticle accumulation in the tumor tissue. In addition, CRC metastasizes mainly to the liver, which has a unique tissue structure including macrophages and stromal cells in direct contact with metastatic tumor foci (3). Therefore, nanoparticles have difficulty to deliver therapeutic and imaging agents selectively to liver metastatic CRC tumor lesions without being taken up by Kupffer cells or hepatocytes.
Imaging dyes are another factor affecting diagnostic performance of theranostic nanoparticles. Although magnetic resonance imaging (MRI), positron emission tomography (PET), computerized tomography (CT), and other advanced imaging techniques are available, intraoperative imaging using fluorescent dyes is the most cost-effective and direct way to visualize tumors and cancer cells (4, 5). During intraoperative fluorescence imaging, clinicians visualize fluorescent dyes accumulating in solid tumors and determine the accurate size and shape of the tumor for resection from the healthy organ. Intraoperative fluorescence imaging can overcome some clinical limitations of fluorescence imaging such as limited tissue penetration. MRI and CT generally monitor contrast agents moving through healthy organs and identify structural abnormalities caused by tumor tissue, but these indirect imaging techniques often show imaging artifacts and fail to detect small metastatic tumors inducing little or no changes to tissue structure (6). Fluorescence imaging detects fluorescent dyes accumulating in tumor cells, and the direct imaging of cells can provide better imaging resolution than MRI or CT. However, fluorescent dyes have limited selectivity in distinguishing tumor from normal cells, and thus have poor diagnostic properties such as low signal-to-noise ratios, high background signals, short half-lives in tumor tissue, and rapid clearance from the blood (7, 8).
The third most common factor is physicochemical properties of theranostic nanoparticles, such as size, surface charge, and stability. Particles with an average diameter of 30 nm are known to accumulate in solid tumors most efficiently (9–11). Particles with an anionic surface can prevent protein adsorption in the body and prolong blood circulation time, but anionic particles avoiding opsonization do not necessarily improve tumor accumulation in comparison to particles with a neutral surface (12–14). Particle stability is most important to ensure preferential accumulation of nanoparticles in tumors (15–17). However, these properties change unpredictably during nanoparticle production, storage, and use (18–20).
To understand the complex interplay among these factors, we have developed polymer nanoassemblies (PNAs) with uniform particle size, enhanced physical and chemical stability, and functional versatility (21–25). PNAs are made from biocompatible polymers and small molecule components such as poly(ethylene glycol) (PEG), poly(ethylene imine) (PEI), poly(lysine) (PLL), and palmitic acid (PAL), which are tethered each other through a coupling reaction between a scaffold (PEI or PLL) and grafts (PEG and PAL). In previous studies, we confirmed that PNAs are uniform in shape and size with an average diameter of 30 nm, and they can fine-tune the entrapment and release of various model anticancer drugs in comparison to other FDA-approved injection formulations such as polymer micelles and modified cyclodextrin (26–29). PNAs were physically and chemically stable to prevent changes in particle diameter, surface charge, and shape while entrapping various therapeutic and imaging molecules concurrently in the core (21, 22, 27, 30–34).
We recently verified that PNAs entrapping imaging dyes that change fluorescence as a function of solvent pH (halofluorochromism) would be particularly useful to elucidate how nanoparticles distribute in tumors with acidic tissue environments(28, 35). Tumor tissue is acidic as rapidly proliferating cancer cells produce a large amount of lactic acid during proliferation. This phenomenon, also known as the Warburg effect (36, 37), is responsible for various changes in the accumulation, stability, and pharmacology of drugs in tumors. The acidic tumor tissue can be used to trigger drug release from nanoparticle carriers or differentiate tumor from normal tissue by using halofluorochromic dyes such as Nile blue (NB). Our previous observations revealed that NB quenches its fluorescence in water but remains fluorescent in the core of PNAs while the dye-loaded PNAs change fluorescence wavelength and intensity in response to environmental pH (26–28). We hypothesize that NB-loaded PNAs may detect subtle changes in tissue pH and thus allow for early and accurate detection of small liver metastatic CRC tumors for intraoperative imaging.
To test this hypothesis, this study focuses on experimental determination and computational simulation of PNA distribution in liver metastatic CRC tumors (Figure 1). PNAs entrapping fluorescent dyes are used to trace the accumulation, distribution, and clearance of nanoparticles in mice bearing patient-derived xenograft (PDX) or orthotopic liver metastatic CRC tumors. hfPNA accumulation in metastatic CRC tumors is analyzed via computational modeling simulating nanoparticle drug delivery. We previously confirmed that computer-assisted simulations accurately predict the clinical impact of nanoparticle design on drug delivery related to various biological parameters such as tumor size, blood vessel density, and cellular responses to a specific drug (35, 38–40). Therefore, the goal of the current study is to confirm the feasibility of hfPNAs to detect metastatic CRC tumors in the liver and thus better elucidate biological conditions that can maximize hfPNA theranostic utility in future applications.
Figure 1.
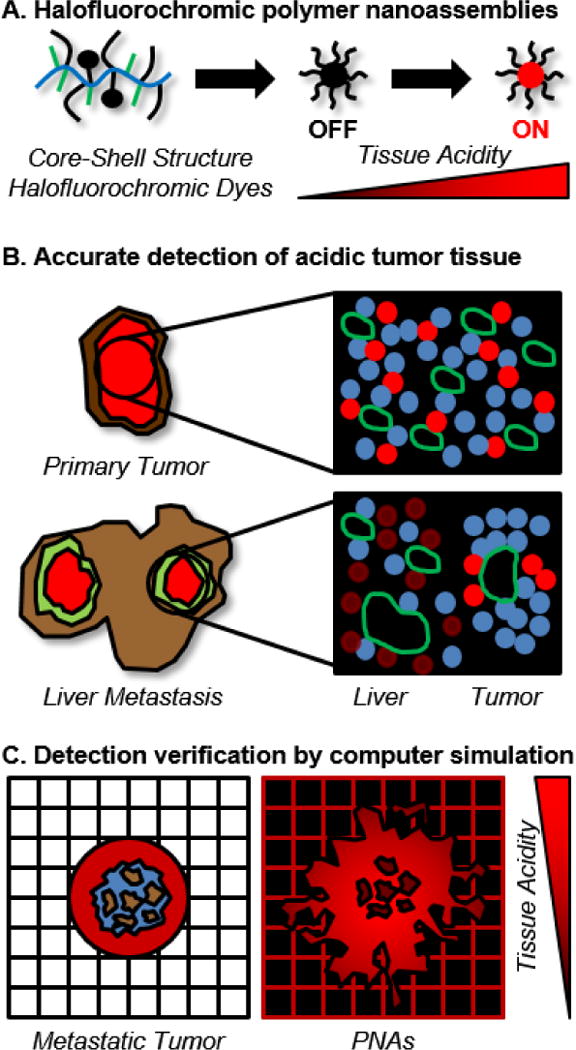
Conceptual description of approaches to detect liver metastatic CRC tumors by using halofluorochromic PNAs and computational simulations.
MATERIALS AND METHODS
Materials and cells
α-Succinimidyloxysuccinyl-ω-methoxy-PEG (5 kDa, NHS-activated PEG) was purchased from NOF America (White Plains, NY). Branched PEI (25 kDa), PLL (30–70 kDa, HBr salt), palmitoyl chloride, acetic anhydride, sucrose, HEPES sodium salt, agarose, NB, IR820 and NHS ester-activated Alexa Fluor® 546 dye (Alexa546) were purchased from Sigma Aldrich (St. Louis, MO). DMSO, THF, pyridine, methanol, diethyl ether, nuclear staining dye Hoechst 33342, DAPI, Mitotracker Green (MG), dialysis membrane with 3.5 or 100 kDa molecular weight cutoff (MWCO), chamber slides, preparative size exclusion columns (PD Minitrap, G-25, 3.5 mL), and phosphate buffer solutions (50 mM, pH 7.4, 7.0 and 6.0) were purchased from Fisher Scientific (Waltham, MA). Paraformaldehyde solution (4%) was purchased from Polysciences (Warrington, PA). Optimal cutting temperature compound (OCT) was purchased from Andwin Scientific (Schaumburg, IL). Mouse EpCAM antibodies were purchased from LSBio (Seattle, WA) and mouse CD31 and donkey anti-mouse IgG antibodies labelled with NL637 dyes were purchased from R&D Systems (Minneapolis, MN). An aqueous permanent mounting medium was purchased from Dako (Carpinteria, CA). McCoy’s 5A media, phosphate buffered saline (PBS) and 0.05% trypsin/EDTA were purchased from GE Healthcare (Logan, UT). The fetal bovine serum (FBS) was purchased from Atlanta Biologicals (Flowery Branch, GA). Human CRC cell lines (HT29 and HCT116) were purchased from the American Type Culture Collection (ATCC, Manassas, VA). CRC cells were cultured in a humidified environment with 5% CO2 at 37°C in McCoy’s 5A media supplemented with 10% FBS following the ATCC recommendations.
Animal models
Patient-derived xenograft (PDX) and orthotopic liver metastatic CRC tumor models were used in this study. NOD-SCID gamma mice between 6 to 8 weeks old were purchased from the Jackson Laboratory (Bar Harbor, ME) to develop PDX tumor models. All animal experiments were performed in accordance with the Institutional Animal Care and Use Committee (IACUC) and were approved by the Institutional Review Board (IRB) of the University of Kentucky. An original patient CRC tumor sample (F0) was implanted into mouse flanks to develop the first generation PDX tumor (F1). The F1 tumor (1 cm3) was resected, divided into small pieces (2 mm3), and implanted to mice to develop the second generation PDX tumors (F2) with a consistent tissue volume for further experiments. Male athymic NCr nude mice between 6 to 8 weeks old were purchased from Taconic (Hudson, NY) to develop the orthotopic metastatic tumor models as previously reported (41–45). Briefly, HCT 116 cells expressing green fluorescent protein (GFP) were injected into the spleen capsule of mice and allowed to develop liver metastatic CRC tumors for 6 weeks.
PNA synthesis
Figure 2 summarizes PNAs used for this study. These PNAs were synthesized according to previously reported methods (26–28, 30, 31, 46). Briefly, scaffolds (PEI or PLL) were reacted with NHS-activated PEG first in a mixed reaction solvent (water:DMSO:pyridine = 2:1:1) at room temperature for 2~3 days. PEG-conjugated scaffolds (PEG-PEI or PEG-PLL) were purified by dialysis in water and collected by freeze drying. PEG-PEI and PEG-PLL were then reacted with palmitoyl chloride in THF at 40°C for 2 h to produce PEG-PEI-PAL and PEG-PLL-PAL. Pyridine was added after 15 minutes to scavenge hydrochloric acid byproducts. PEG-PEI-PAL and PEG-PLL-PAL were purified by ether precipitation and dialysis in water and collected by freeze drying to obtain final products of PNAs.
Figure 2.
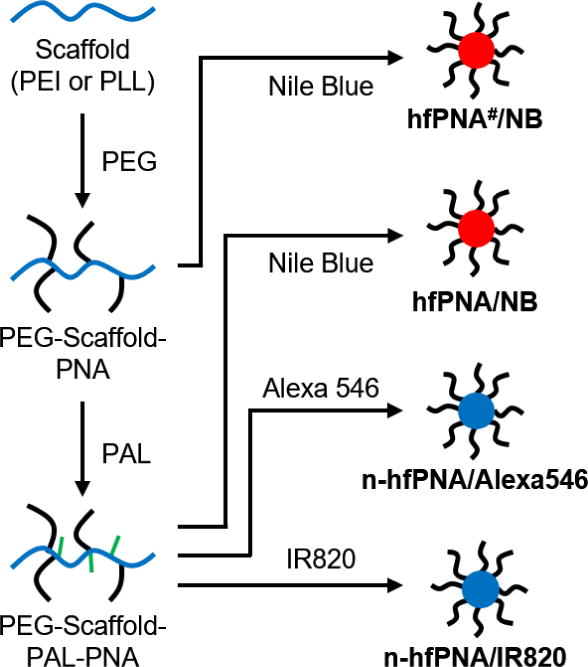
Synthesis scheme for halofluorochromic and non-halofluorochromic PNAs (hfPNAs and n-hfPNAs).
Preparation of halochromic and non-halochromic PNAs (hfPNA and n-hfPNA)
PNAs were labeled with a halofluorochromic dye (NB) or non-halofluorochromic dyes (Alexa546 or IR820) to produce hfPNA and n-hfPNA, respectively. NB and IR820 were conjugated to the primary amines in the core of PNAs by reacting the dyes with PEG-PEI-PAL or PEG-PLL-PAL in methanol at 40°C overnight in the presence of pyridine scavenging hydrochloric acid byproducts as previously reported (47). Alexa546 was conjugated to PEG-PLL-PLA through the NHS coupling reaction in DMSO at room temperature overnight. PEG-PEI(#) scaffold having no PAL was also used as comparison to determine the effect of PNA core environment with charge on halofluorochromism of the NB-conjugated particles (27, 28). All dye-labeled PNAs were dialyzed in water, purified by size exclusion gel columns, and collected by freeze-drying. In this paper, PNAs are denoted as hfPNA#/X, hfPNA/X and n-hfPNA/X, where ‘X’ indicates dyes conjugated to the core of particle and ‘#’ means the scaffold is PEG-PEI: hfPNA#/NB, hfPNA/NB, n-hfPNA/Alexa546, n-hfPNA/IR820. Unreacted primary amines of PNAs were either intact (hfPNA#/NB and n-hfPNA/Alexa546) or end-capped by acetylation using acetic anhydride (hfPNA/NB and n-hfPNA/IR820).
PNA characterization
The chemical compositions of PNAs were determined by proton NMR spectroscopy (Varian 400 MHz, d6-DMSO, referenced to TMS). Dye conjugation was confirmed by UV-VIS spectroscopy of free dye standards and dye-conjugated PNAs using a plate reader (SpectraMax M5, Sunnyvale, CA). The relative size distribution and chemical uniformity of PNAs were determined by gel permeation chromatography (GPC, Asahipak GF-7M, PBS, 0.5 mL/min, 40°C, calibrated using PEG standards). The diameter and surface charge of PNAs were determined by dynamic light scattering (DLS, Zetasizer Nano ZS, Malvern, UK). In vivo imaging system (IVIS, Xenogen IVIS-200, PerkinElmer, USA) was used to visualize fluorescence from PNAs in tissue mimics or animal tissue samples for ex vivo studies as further detailed below.
PNA diffusion and flux measurement in gel tissue mimics
Tissue mimics were prepared by using agarose gels. Agarose (0.5% or 1% w/v) in buffer solutions (pH 7.4, 7.0 and 6.0) was completely dissolved by heating, and the agarose solution was pipetted into wells of a 96 well plate (100 μL per well). The plate was allowed to cool at room temperature to create gels with varying agarose content mimicking normal and tumorous tissue conditions. Stock solutions of hfPNA/NB (10 mg/mL) and n-hfPNA/IR820 (1 mg/mL) were prepared in deionized water, and 100 μL of each PNA solution was added to the wells containing agarose tissue mimics. n-hfPNA/IR820 was allowed to diffuse into the tissue mimics at 37°C for 0.1, 0.5, 1, 3, 6 or 24 h, and hfPNA/NB was incubated for 24 h for comparison. The experiments were performed in a chamber with no additional or 16 kPa (120 mm Hg) external pressure to mimic capillary and interarterial pressure forcing PNAs into liver stroma, respectively. After incubation, PNA solutions were removed from the plates for spectroscopy measuring signals from particles in the gels. The measured values were normalized by subtracting background signals from untreated wells, and data was fitted to a linear regression. Absorbance changes of n-hfPNA/IR820 were converted into flux by dividing the slopes from the linear regression by the well surface area and multiplying the initial PNA concentration in each well. Fluorescence of hfPNA/NB was measured by using IVIS (Ex 640 nm/Em 700 nm) to determine halofluorochromic changes in tissue mimics with varying acidity.
PNA stability evaluation under opsonization conditions
PNAs were exposed to anionic, cationic, physiological, and serum-containing conditions that commonly induce nanoparticle aggregation as reported in literature (48–51). n-hfPNA/IR820 was dissolved at 2 mg/mL in stock solutions of magnesium sulfate (anionic, 1 M), calcium chloride (cationic, 30 mM), McCoy’s 5A media (physiological), and McCoy’s 5A containing FBS (serum-containing, 50% v/v) and incubated at 37°C for 0, 1, 3, 6 and 24 h. Potential particle aggregation was observed by monitoring absorbance changes at 650 nm. Absorbance increases above 0.3 indicating 50% turbidity were defined as significant aggregation of PNAs. The diameter of PNAs was also measured after 24 h of incubation and compared it to the initial particle size.
PNA cellular uptake measurement
HT29 cells were seeded at 15,000 cells per well in chamber slides. After overnight incubation, the media was replaced and cells were treated with hfPNA#/NB (1 mg/mL), hfPNA/NB (1 mg/mL), or MG (200 nM) at 37°C for 0.5, 1, 3, and 6 h. The treated cells were then placed on a heated stage at 37°C and imaged using a fluorescence microscope (Zeiss Axiovert 200M, Thornwood, NY). hfPNA#/NB and hfPNA/NB were imaged using a Texas red filter (Ex 568 nm/Broad Spectum Em) and MG was observed using an FITC filter (Ex 488 nm/Broad Spectrum Em). Fluorescence of hfPNA#/NB, hfPNA/NB, and MG was normalized to the background signals of each timepoint, and the average intracellular and extracellular fluorescence at each time point were calculated using ImageJ (NIH, Bethesda, MD). A ratio of intracellular to extracellular fluorescence was defined as the uptake quotient (Q) in equation 1.
| (1) |
PNA cellular uptake equilibrium was also determined by taking cell images every 10 seconds for 0.5 h immediately after sample treatment to the cells. hfPNA/NB and hfPNA#/NB were compared to determine the effect of PNA core environment on halofluorochromism involved with particle diffusion. A mathematical model of nanoparticle cellular uptake was derived for the comparison as previously reported (52). A full derivation of the model is included in the Supplementary Information, and equation 2 describes the cellular uptake of PNAs as a function of time.
| (2) |
KEQ is the cellular partition coefficient and k is the cellular uptake rate constant. The time for the uptake coefficient to reach 95 percent of the equilibrium value was also defined as t95.
PNA accumulation in PDX tumors
Mice bearing F2 PDX tumors were dosed with n-hfPNA/Alexa546 (10 mg/kg) by tail vein injection. Mice were euthanized at 1, 4, 8 and 24 h post injection to collect lung, liver, kidney, spleen, and PDX tumor tissue samples. PBS was used as a control. The fluorescence of n-hfPNA/Alexa546 in tissue samples was quantified by ex vivo imaging with IVIS. Fluorescence density maps were created for PNAs in each tissue sample using Living Image (Caliper Life Sciences, Hopkinson, MA), and the maps were represented as a color gradient centered at maximal fluorescence intensity.
PDX tumor tissue samples were further analyzed by fluorescence microscopy. Tissue samples were fixed in 4% paraformaldehyde solution containing 10% sucrose at 4°C. The fixed tissue samples were embedded in OCT on dry ice, sectioned at 10 μm thickness, and dried overnight in the dark. The tissue samples were washed with PBS, stained with Hoechst 33342 (or DAPI), and put in an aqueous permanent mounting medium. PDX tumor tissue samples were also treated with EpCAM or CD31 antibodies and NL637-labelled IgG secondary antibodies to visualize cancer cells and blood vessels for fluorescence imaging with a laser scanning confocal microscope (Olympus FV1000, Tokyo, Japan).
PNA accumulation in liver metastatic tumors
n-hfPNA/Alexa546 was injected at varying doses (0, 5, 10 and 20 mg/kg) into tumor-free mice through the tail vein to determine baseline fluorescence signals from lung, liver, kidney and spleen tissue samples for IVIS imaging (Ex 535 nm/Em 580 nm). Mice bearing orthotopic liver metastatic CRC tumors were then injected with n-hfPNA/Alexa546, hfPNA/NB, or PBS intravenously, and liver tissues samples were collected for macroscopic imaging with IVIS. Tissue samples fixed for a confocal microscopic imaging were stained with DAPI, EpCAM and CD31 antibodies, and NL637-labelled IgG secondary antibodies.
Fluorescence corresponding to cell nuclei (DAPI), blood vessels (CD31), cancer cells (EpCAM), and PNAs was then quantitatively analyzed from microscopic fluorescence images of liver metastatic CRC tissue samples. Fluorescence signals from liver metastatic CRC images were split into RGB channels. Signals isolated from each channel were normalized by converting the fluorescence intensity to binary signals using ImageJ to account for the differences in signal strength among dyes, dye-labelled antibodies, and PNAs. Regions of interest (80 × 80 μm) corresponding to metastatic tumor foci were selected and fluorescence per unit area was quantified in each region. Normalized fluorescence values per unit area were used to estimate the density of blood vessels and cancer cells in liver metastatic tumors for computational simulations in the next section.
Computational simulation of PNA distribution
Computational modeling to evaluate PNA distribution in metastatic CRC tumors was developed in our recent publication (53) and builds upon previous modeling work (54–56). In this study, the modeling was applied to describe PNA distribution in metastatic CRC tumors as a function of vascularization in the surrounding tissue. Accordingly, three vascular densities (termed “low”, “medium”, and “high”) were considered to evaluate PNA accumulation based on varying degrees of vascular access to the lesions. The model is described in detail in the Supplementary Information.
Statistics
All values are reported as mean ± standard deviation for triplicate measurements. Statistical analysis of multiple measurements was performed using the one-way ANOVA with Bonferroni’s post test correction. Analysis of pairs of measurements was performed using a Student’s t test. All values from mathematical modeling are reported as mean ± standard error of the mean. Statistical significance is represented with * (p<0.05), ** (p<0.01), or *** (p<0.001).
RESULTS
PNA Synthesis
DLS confirmed that all PNAs were uniform in size with an average diameter between 19 ~ 34 nm and neutral surface charge: hfPNA#/NB (26.5 ± 8.8 nm, ζ = −0.6 ± 0.4 mV), hfPNA/NB (34.3 ± 3.5 nm, ζ = −1.3 ± 0.3 mV), n-hfPNA/Alexa546 (23.2 ± 1.0 nm, ζ = −0.8 ± 0.4 mV), and n-hfPNA/IR820 (18.8 ± 0.3 nm, ζ = 0.3 ± 0.7 mV). NMR analysis revealed that PEG content on the PEI or PLL scaffold was 10 ~ 24 % with PAL substitution of 37 ~ 55% with respect to primary binding sites on the scaffold (Table 1). Characterization information of hfPNA#/NB and hfPNA/NB are provided from literature (47). The purity of PNAs were confirmed by GPC as shown in Supplementary Information (Figure S1). These results are consistent with our previous observations (26–28, 30, 31, 46), and indicate that conjugation of fluorescent dyes to the core of PNAs induces minimal changes to the uniformity and size of the nanoparticles used in this study.
Table 1.
Physicochemical properties of PNAs.
| PNA | Diameter (nm) |
Zeta potential (mV) |
PEG Substitution (%) |
PAL Substitution (%) |
Dye Substitution (%) |
|---|---|---|---|---|---|
| hfPNA#/NB | 26.5±8.8 | −0.6±0.4 | 10 | 0 | 50 |
| hfPNA/NB | 34.3±3.5 | −1.3±0.3 | 10 | 55 | 25 |
| n-hfPNA/Alexa546 | 23.2±1.0 | −0.8±0.4 | 24 | 37 | 1 |
| n-hfPNA/IR820 | 18.8±0.3 | 0.3±0.7 | 24 | 37 | 5 |
PNA diffusion into tissue mimics
Figure 3 shows the flux of n-hfPNA/IR820 into agarose gel tissue mimics with and without additional external pressure. The flux of n-hfPNA/IR820 decreased by ~40% in 1% gels compared to 0.5% gels. Decreases in gel pH did not affect the flux of n-hfPNA/IR820. Additional external pressure increased the flux at 0.1 and 0.5 h post treatment, but it did not significantly change the flux at 6 and 24 h post treatment. Calculated flux values for each gel density, pH, and pressure are summarized in Table 2. We confirmed that n-hfPNA/IR820 showed no significant change in fluorescence intensity as a function of solution pH (Figure S2). These results suggest that PNAs have limited diffusion into normal and tumor tissues and they may distribute mainly in the interstitial space of the liver while circulating through blood vessels post intravenous injection.
Figure 3.
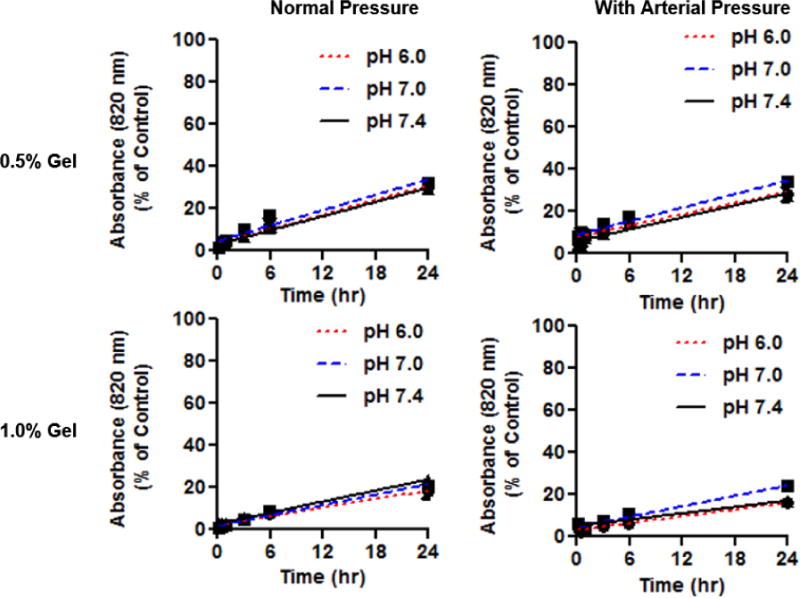
Diffusion of n-hfPNA/IR820 into 0.5% and 1% gels with and without effects of arterial pressure at pH 7.4, 7.0 and 6.0.
Table 2.
Calculated flux values for PNAs with 120 mm Hg external pressure.
| Flux (kg/(s*cm2))*1010 | ||||
|---|---|---|---|---|
| Pressure (mm Hg) | Gel % | pH 7.4 | pH 7.0 | pH 6.0 |
|
| ||||
| 0 | 0.5 | 9.62±0.63 | 10.08±0.51 | 10.55±0.71 |
| 1.0 | 7.12±0.39 | 5.97±0.41 | 7.12±0.39 | |
|
| ||||
| 120 | 0.5 | 8.23±0.55 | 9.31±0.44 | 7.73±0.75 |
| 1.0 | 4.35±0.42 | 7.18±0.43 | 4.66±0.40 | |
Halofluorochromic detection of tissue acidity
Figure 4 shows hfPNA/NB detecting pH changes in tissue mimics. hfPNA/NB increased fluorescence intensity in agarose gels representing acidosis in normal and tumor tissues (Figure 4A). Quantitative analysis shows that hfPNA/NB increased fluorescence in order of pH 7.4 < 7 < 6 (Figure 4B). PNAs showed greater fluorescence intensity in 0.5% gel than in 1% gel because they diffused into 0.5% agarose gel slightly better than 1% agarose gel as shown in Figure 3. It is unclear why PNAs showed the greatest fluorescence intensity in 1% gel at pH 6, but the spotted distribution of PNAs in the well might have increased the overall fluorescence. These results confirm that hfPNAs can detect pH changes in tissue mimics despite limited particle diffusion.
Figure 4.
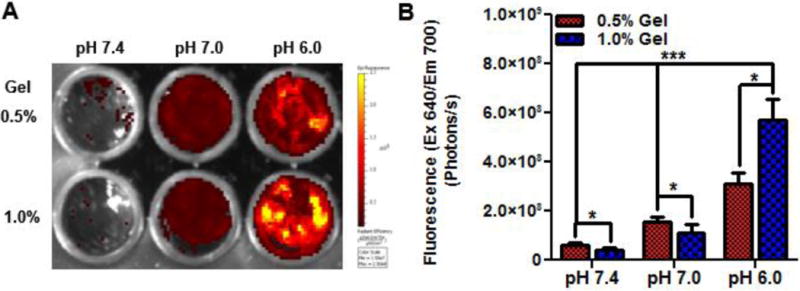
Halofluorochromism of hfPNA/NB diffused into gels for 24 hours (A). Fluorescence increases significantly below pH 7.4 for gels at high and low density (B).
PNA stability
Figure 5 shows that PNAs are stable enough to avoid precipitation under opsonization conditions for at least 24 h. PNAs incubated in a cationic solution and cell culture media showed turbidity at 650 nm absorbance decreasing slightly immediately after incubation yet remaining stable from 1 to 24 h (Figure 5A). Although PNAs showed the lowest absorbance at 650 nm in an anionic solution, there was no significant difference among PNAs in terms of particle size during incubation (Figure 5B). These results demonstrate that PNAs are suitable for carrying imaging agents in the body without inducing particle precipitation in the physiological condition for a long time.
Figure 5.
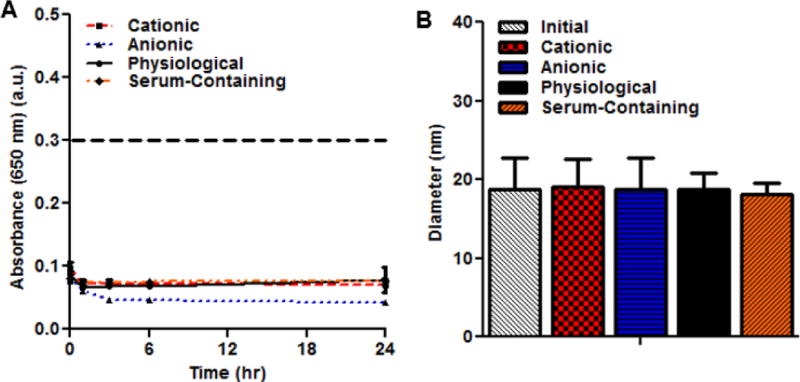
Aggregation of PNAs measured by absorbance changes (A). Particle size changes of PNAs after 24 h under aggregating conditions (B).
Cellular uptake
Figure 6 indicates low cellular uptake of PNAs as opposed to small molecule MG. Figure 6A and 6B display PNAs remaining outside cells for up to 6 h regardless of formulation (hfPNA#/NB vs hfPNA/NB). In contrast, MG entered cells quickly and increased its cellular uptake over time (Figure 6C). PNAs showed at least 12 times less cellular uptake than MG for 6 h of incubation (Figure 6D). Interestingly, cellular uptake of PNAs reached equilibrium in about 5 and 10 minutes for hfPNA/NB and hfPNA#/NB, respectively (Figure 6E). Figure 6A and 6B show truncated dark spots of cells, which suggest that PNAs accumulated neither in the cytosol nor cellular membrane at a detectable level. There are two possible explanations of these findings. PNAs may be taken up by cells quickly yet they are recycled back to the outside of the cell reaching apparent equilibrium at low cellular uptake. Another explanation of the low cellular uptake of PNAs is that the nanoparticles could accumulate mainly in the cellular membrane and reach equilibrium. The parameters from the mathematical modeling of PNA uptake are in Table 4. Differences in the cellular partition coefficient (p<0.001), cellular uptake rate constant (p<0.001), and the time to reach 95% of equilibrium (p<0.01) for hfPNA#/NB and hfPNA/NB are statistically significant. These results indicate that PNAs are not easily taken up by the cells and remain outside cells during incubation, which is favorable for the nanoparticles to detect tissue pH within liver metastatic CRC tumors in vivo.
Figure 6.
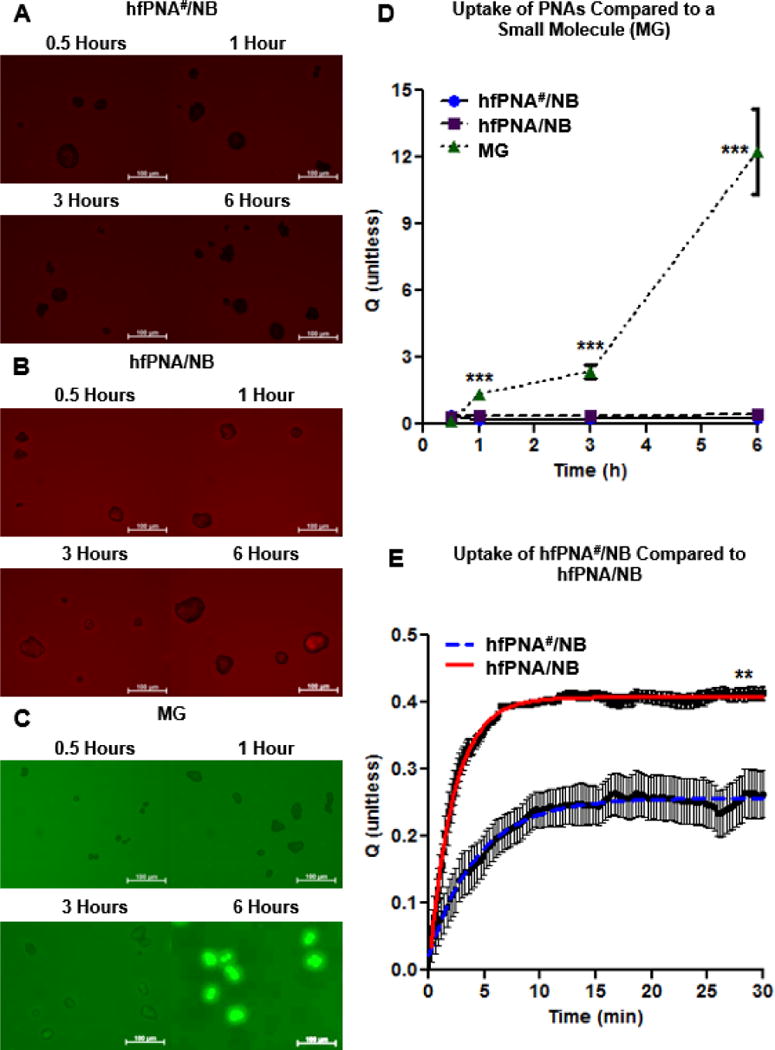
Cellular uptake imaging of hfPNA#/NB (A), hfPNA/NB (B) and MG (C). Uptake of PNAs and MG were compared up to 6 h (D). Uptake of hfPNA#/NB and hfPNA/NB was compared for 0.5 h (E).
Table 4.
Parameters for first order association model of PNA uptake.
| PNA | KEQ (unitless) | k (min−1) | t95 (min) |
|---|---|---|---|
| hfPNA#/NB | 0.25±0.01 | 0.23±0.01 | 13.2±0.8 |
| hfPNA/NB | 0.41±0.01 | 0.46±0.01 | 6.6±0.1 |
PNA accumulation in PDX Tumors
Figure 7 shows n-hfPNA/Alexa546 accumulating in PDX tumors. PNAs showed fluorescence increasing gradually in tumors for 24 h after intravenous injection, but their fluorescence remained low in other major organs such as lungs, kidney, spleen, and liver. Fluorescence from PNAs in lungs was its maxima at 1 h post injection and decreased over time. These results indicate that PNAs accumulate preferentially in tumors and avoid non-specific accumulation in other major organs. Low PNA accumulation in major organs is consistent with low cellular uptake of PNAs confirmed by in vitro studies (Figure 6). Enhanced PNA accumulation in tumors suggests that tissue microenvironment may differ between tumor and other major organs. Nanoparticles are known to stay longer in tumor tissue, a phenomenon generally known as the enhanced permeation and retention (EPR) effect (13, 57). According to the EPR effect, macromolecules penetrating disrupted blood vessels found in tumor or inflammation lesions can remain for an extended time if the lymphatic drainage is compromised (57). Another explanation is that tumor macrophages might have taken up PNAs and thus increased nanoparticle accumulation in tumors for enhanced fluorescence. However, as seen in Figure 5 and 6, PNAs show no opsonization and low cellular uptake and they may not interact with tumor macrophages easily. Although further studies are necessary to elucidate the detailed mechanism, PNAs are confirmed to accumulate in PDX tumors that retain a complicated tissue environment seen in patient tumors, and the nanoparticles are likely trapped in the interstitial space of PDX tumors. To test this hypothesis, we further investigated PNA distribution in PDX tumor tissue by fluorescence microscopy.
Figure 7.
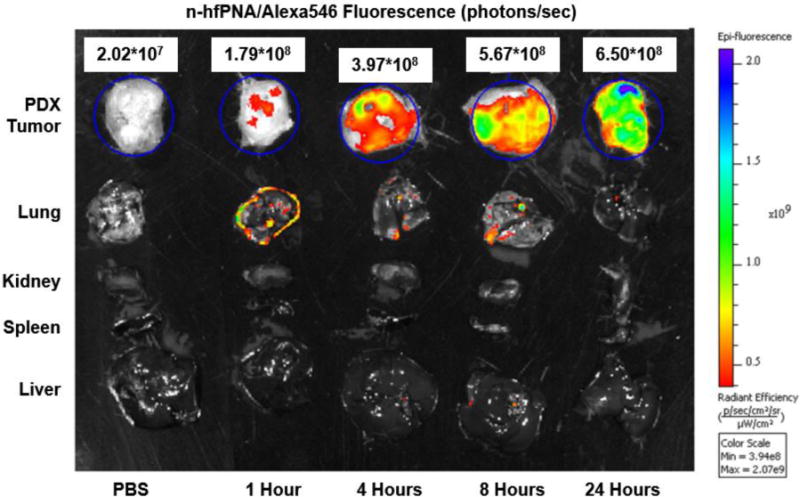
Fluorescence imaging of PDX tumors, liver, spleen, kidney and lung from mice that intravenously received n-hfPNA/Alexa546.
PNA distribution in PDX tumor tissue
Figure 8 shows distribution of n-hfPNA/Alexa546 in sliced tissue samples from PDX tumors shown in Figure 7. The images clearly display PNAs accumulating between tumor cells and increasing its fluorescence over time (Figure 8A). It must be noted that the fluorescence of PNAs remains near cell nuclei in all images, suggesting that the nanoparticles may be in the cytosol of tumor cells. These results are different from in vitro observations showing low cellular uptake of PNAs. PNAs may interact differently with various cell types other than tumor cells, which include endothelial cells forming tumor blood vessels. In Figure 8B, PNAs (red) seem to co-localize with cancer cells stained with EpCAM (green), although the signal is weak. Figure 8C shows that CD31-stained endothelial cells (green) do not always co-localize with PNAs (red), supporting low cellular uptake of PNAs. These results demonstrate that PNAs accumulate in or near endothelial cells forming tumor blood vessels and minimally enter endothelial or PDX tumor cells for 24 h post injection.
Figure 8.
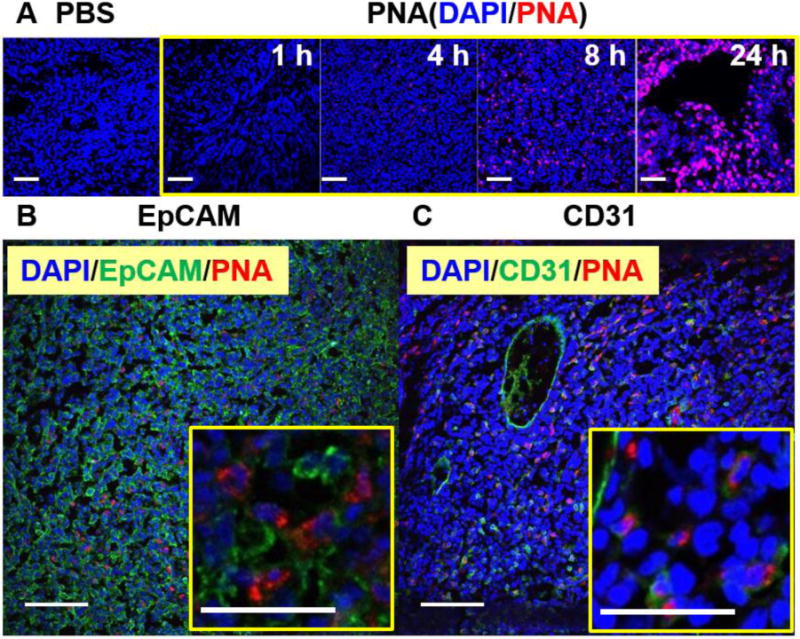
Microscopic fluorescence imaging of PDX tumors from mice. Blue represents cell nuclei (DAPI) and red represents n-hfPNA/Alexa546 (A). Tissue samples were also treated with either EpCAM (B) or CD31 antibodies (C), and green represents cancer and endothelial cells in respective images. (Bar = 100 μm)
PNA accumulation in orthotopic liver metastatic CRC tumors
Figure 9 compares distributions of n-hfPNA/Alexa546 and hfPNA/NB in liver with orthotopic metastatic CRC tumors. Although n-hfPNA/Alexa546 accumulating tumors in the liver increased fluorescence, the nanoparticle also shows strong fluorescence in liver, kidney, and lung tissues, and the high background signal makes it difficult to distinguish tumors from normal liver tissue (Figure 9A). In contrast, hfPNA/NB shows fluorescence selectively in tumors presumably because the nanoparticle is able to detect acidic tumor tissue in the liver (Figure 9B). Despite the encouraging results, the distribution pattern of hfPNA/NB (red) does not match to the areas where tumor cells (green) are in Figure 9B. These results indicate that hfPNA/NB can successfully detect acidic tissue of metastatic tumors but it may fail to pinpoint every metastatic tumor foci with no acidosis in macroscopic images.
Figure 9.
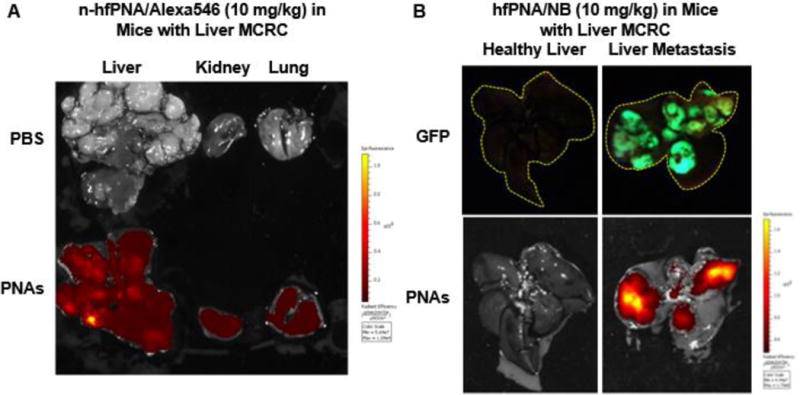
Fluorescence images of liver, kidney and lung tissue from mice bearing orthotopic liver metastatic CRC tumors treated with n-hfPNA/Alexa546 (A). Fluorescence imaging of liver from healthy mice or mice bearing orthotopic liver metastatic CRC tumors treated with hfPNA/NB (B).
Microscopic analysis of PNA distribution in orthotopic liver metastatic CRC tumors
Figure 10 shows distribution of n-hfPNA/Alexa456 in metastatic CRC tumors in the liver. PNAs (red) are near endothelial cells in the stromal tissue of liver (green) and they show low cellular uptake. PNAs distribute mainly in the interstitial space of metastatic tumors, showing a clear contrast to the nanoparticle distribution pattern in PDX tumors (Figure 8). The difference in PNA distribution between PDX and orthotopic liver metastatic CRC tumors suggest that halofluorochromism may be more useful to detect metastatic tumors than primary solid tumors by microscopic image analysis. PNAs accumulating in the interstitium of metastatic tumors clearly separate tumor foci from normal tissues by visualizing the ‘silhouette’ of tumors.
Figure 10.
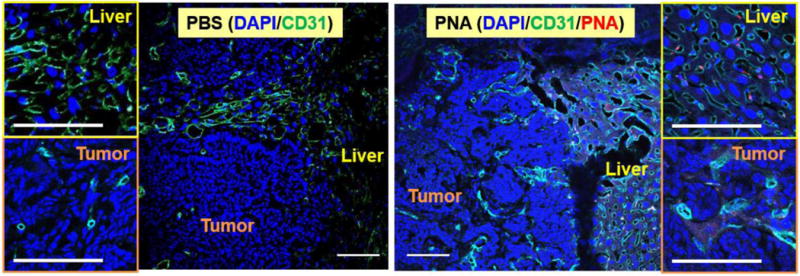
Microscopic fluorescence imaging of liver tissue and liver metastatic tumors treated with n-hfPNA/Alexa546. Blue, green, and red correspond to nucleus, CD31, and PNAs, respectively. (Bar = 100 μm)
Meanwhile, orthotopic liver metastatic tumors were confirmed to have less blood vessel density than the normal liver tissue, and PNAs seemed to show brighter fluorescence in the liver than metastatic tumors (Figure 10 and S4). DAPI staining of tissues indicates that nuclei (blue) are larger and less dense in healthy liver tissue compared to metastatic tumors. CD31 staining indicates that liver tissue contains more blood vessels than metastatic CRC tumors. The reduced density of blood vessels suggests that metastatic tumors are less perfused with blood than healthy liver tissue. Fluorescence signals corresponding to n-hfPNA/Alexa546 are weak throughout liver tissue because PNAs perfuse liver tissue. Weak fluorescence of n-hfPNA/Alexa546 is also observed in space surrounding dense colonies of cancer cells in metastatic tumors, and fluorescence decreases further near the interior of these colonies. These results suggest that PNAs diffusing away from blood vessels fail to perfuse metastatic tumors. Alternatively, PNAs could have washed away from the tissue during the sample preparation procedure involved with formaldehyde fixation, dye staining, fluorescent antibody immunostaining, and PBS washing. Therefore, hfPNAs could emit much stronger fluorescence in in situ intraoperative imaging of tumors in the clinic. It must be noted that small spots of PNA fluorescence were seen in the zoomed images of liver tissue and metastatic tumors. These spots may be attributed to accumulation of PNAs in lysosomes or vesicles inside the cells near blood vessels although the exact cause is unclear.
Computational simulation of PNA distribution in metastatic tumors
Figure 11 shows qualitative results displaying the accumulation of PNAs in simulated metastatic CRC tumors at 1.8 h and 12 h after intravenous injection. The PNA accumulation was computationally evaluated for low, medium, and high levels of surrounding tissue vascularization based on values experimentally determined in vivo. Regardless of tumor vascularization, most PNAs remain in the extracellular matrix surrounding the lesion and adjacent tumor tissue, and PNAs increased accumulation in the periphery of the simulated metastatic lesions as the vascular density increased (Figure 11A). Figure 11B shows that PNAs accumulating near a metastatic lesion decrease to about half of their initial amount at 12 h post injection.
Figure 11.
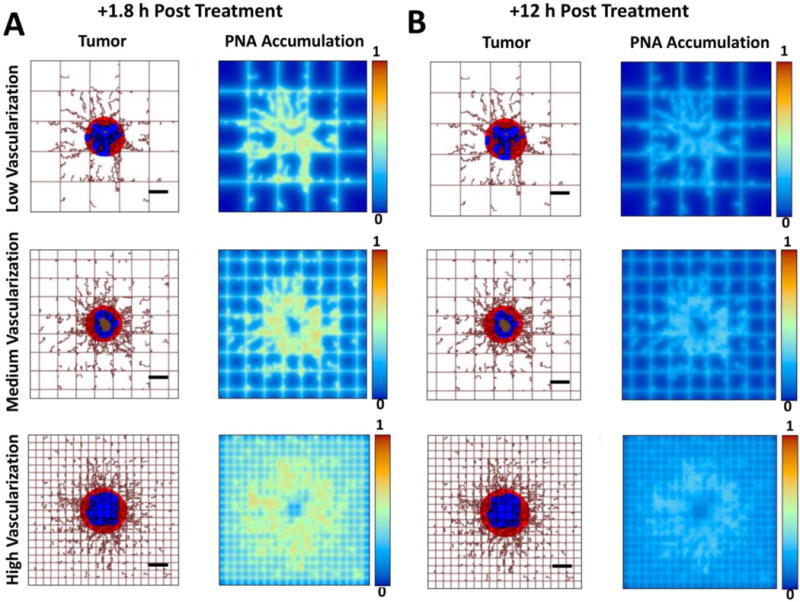
Computational simulations of PNA distribution in metastatic tumors at 1.8 h (A) and 12 h (B) after systemic injection of the nanoparticles for three varying degrees of vascularization (low, medium, high) in the surroundings of the tumor. Viable tumor tissue (red) is shown enclosing hypoxic (blue) and necrotic (brown) regions. Capillary network is represented by rectangular grid, with irregular sprouts simulating blood vessel growth via angiogenesis, driven by release of tumor angiogenic factors from the hypoxic tissue within the tumor. PNA concentration is normalized to the maximum value in the vessels. (Bar = 250 μm)
Figure 12 summarizes the simulated PNA accumulation in various tissue regions of liver metastatic tumors for up to 2.5 days after intravenous injection. The total PNA concentration based on vasculature area (μm2, based on vessel length × circumference) has the largest peak in the medium vascularization case (0.20), and the peak concentration in the hypoxic tissue is reached in the high vascularization case (0.057). One day after intravenous injection, the total PNA concentration decreased by 75%, 80%, and 90% for the low, medium and high vascularization cases, respectively. These results reflect increased PNA washout with a higher number of blood vessels present.
Figure 12.
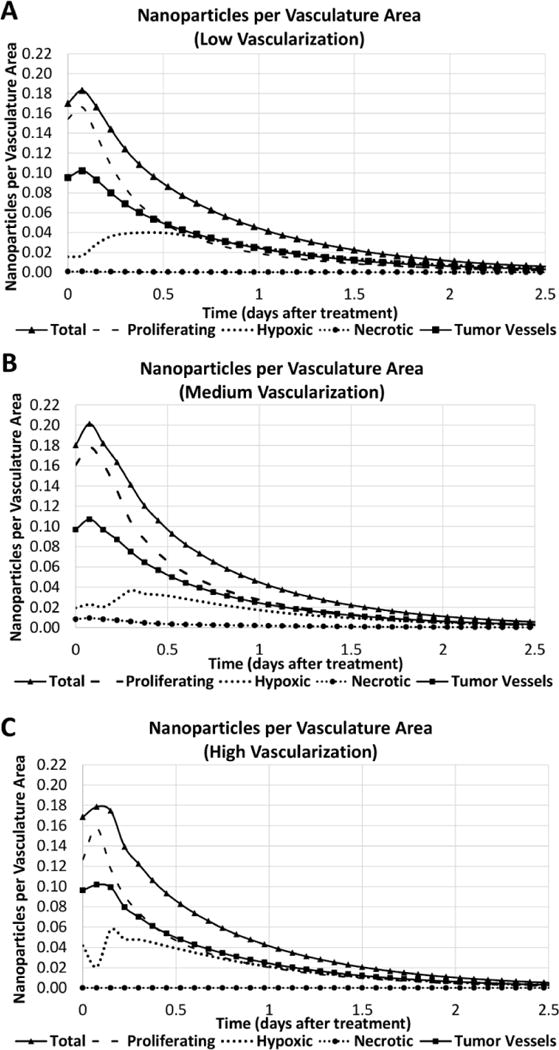
PNA accumulation per vasculature area (μm2, based on vessel length and circumference) for various tumor regions (proliferating, hypoxic, necrotic, and blood vessels) simulated for 2.5 days after systemic injection of the nanoparticles. Panels show cases of low (A), medium (B), and high (C) vascularization in the surrounding tissue.
Figure 13 quantifies the PNA accumulation per vasculature area at 1.8 h and 12 h post injection depending on vascularization and tumor region (proliferating, hypoxic, necrotic, and blood vessels). The PNA concentration in the proliferating regions at 1.8 h was 10, 7.8, and 7.5 times higher than in the hypoxic regions for the low, medium, and high vascularization conditions, respectively. PNA concentrations became more comparable by 12 h (1,8x, 2x, and 1.2x, respectively) with the nanoparticle accumulation decreasing by ~75% in the proliferating regions and by ~50% in the tumor blood vessels. PNAs accumulating in the hypoxic tissue increased by ~100% regardless of vascular density. In all cases, PNA accumulation in the necrotic regions was negligible.
Figure 13.

PNA accumulation per vasculature area (μm2) obtained via computational simulation at 1.8 h (A) and 12 h (B) after treatment as functions of tumor region (proliferating, hypoxic, necrotic, blood vessels) and tumor vascularization degree in the surrounding tissue.
The results of the computational modeling suggest that although a higher number of PNAs may be initially taken up by the proliferating regions, PNA accumulation in the hypoxic (and more acidic) tissue of the lesion would increase and remain steady for at least several hours after systemic injection. Most importantly, this accumulation pattern seems independent of the vascularization degree of the tissue surrounding the lesions.
DISCUSSION
Early and accurate detection of metastatic CRC tumors in the liver may significantly improve CRC treatment and reduce mortality in cancer patients, but traditional diagnostic methods have several limitations to identify small metastatic tumors that rarely affect the structure or morphology of surrounding tissues (58). For example, MRI, PET, CT, and other imaging systems for cancer diagnosis are ineffective to detect small metastatic tumors because contrast agents used for these diagnostic techniques fail to diffuse into such tumors and stay within them for a sufficient time (59). Fluorescent dyes are also widely used to visualize cancer cells and identify small tumors during intraoperative imaging, but common issues include poor diagnostic properties such as low signal-to-noise ratios and short half-lives in vivo (60). In order to overcome these limitations, nanoparticles entrapping small molecule imaging dyes have been recently developed.
Nanoparticles entrapping imaging dyes increased the intensity and durations of dye signals from solid tumors, which allowed for the fluorescence imaging-guided detection of tumors (61). In addition, nanoparticles entrapping fluorescent dyes may allow for the selection of metastatic tumors during surgery for further immunohistochemical analysis. Previous studies confirmed that nanoparticles accumulate in solid tumors through the EPR effect and extend blood retention time of small molecule drugs and dyes. Nanoparticles delivering therapeutic and diagnostic agents simultaneously to tumors can combine cancer therapy and diagnosis, which may be also beneficial to treat metastatic tumors. These ‘theranostic’ nanoparticles are often labeled with fluorescent dyes to trace their distribution in the body. However, fluorescent nanoparticles can increase background signals in normal tissues, particularly the liver, lungs, spleen, and kidneys, and hinder the detection of metastatic tumors (62, 63). To suppress background fluorescence and detect metastatic CRC tumors more accurately at an earlier stage of development, we developed PNAs entrapping halofluorochromic dyes (26–28).
Halofluorochromism is a unique optical property for dyes to change their fluorescence wavelength and intensity as a function of environmental pH. In this study, we focused on determining whether hfPNAs could differentiate tissue pH and detect liver metastatic CRC tumors with acidic tissue (Figure 1). We first prepared hfPNA and n-hfPNA formulations with uniform size to monitor distribution of PNAs using dyes that change or retain fluorescence signals as a function of tissue pH (Table 1 and Figure 2, S1, and S2). These PNAs appeared to poorly diffuse into normal and tumor tissues (Figure 3 and Table 2), although they can detect tissue pH regardless of tissue density (Figure 4). Limited tissue diffusion of PNAs is probably attributed to colloidal stability in maintaining ‘stealth’ properties for the PEG coating to prevent particle aggregation and opsonization (Figure 5). Stable PNAs showed low cellular uptake with minimal interaction with the cell membrane of cancer cells (Figure 6), which reached equilibrium in 10 minutes after incubation (Table 3 and 4). PNAs with poor tissue diffusion and low cellular uptake accumulated and stayed in PDX tumors for at least 24 h (Figure 7 and 8), which is beneficial to image tumors for a long time. It must be noted that PNAs showed these properties regardless of halofluorochromism. Interestingly, however, n-hfPNAs failed to detect small liver metastatic tumors as their background fluorescence signals spread over normal tissues of major organs (Figure 9).
Table 3.
Uptake quotients of cells treated with hfPNA#/NB, hfPNA/NB and MG.
| Time (h) | ||||
|---|---|---|---|---|
|
| ||||
| Treatment | 0.5 | 1 | 3 | 6 |
| hfPNA#/NB | 0.37±0.11 | 0.22±0.12 | 0.26±0.10 | 0.27±0.08 |
| hfPNA/NB | 0.33±0.10 | 0.39±0.11 | 0.38±0.11 | 0.40±0.07 |
| Mitotracker Green | 0.11±0.12 | 1.33±0.14 | 2.37±0.31 | 12.26±1.92 |
n-hfPNAs slightly increased fluorescence in a brightfield image of liver metastatic tumor lesions (Figure 9A), but they failed to provide an image resolution to differentiate tumors from liver stroma (Figure S3). In contrast, hfPNAs emitted fluorescence from tumor tissues with high accuracy, presumably by detecting acidic interstitial tissue between metastatic tumors and liver stroma (Figure 9B and Figure 10). This speculation is supported by the observation that the fluorescence signals from hfPNAs did not perfectly correspond to liver metastatic CRC tumors (green vs red signals in Figure 9B). Our observations suggest that hfPNAs may emit fluorescence only in some sections of acidic tumor tissue as they distribute differently in metastatic CRC tumors compared to the liver (64). It should be noted that halofluorochromism relies on the detection of an acidic tumor microenvironment, and that halofluorochromism may not detect very small metastatic tumor foci with no acidosis. In future clinical applications, the halofluorochromic PNAs should be used in combination with other diagnostic tools due to these limitations. To elucidate how hfPNAs detect small metastatic tumors, we further investigated microscopic distribution of PNAs in metastatic tumors with assistance of computational modeling.
We previously reported that PNAs could maximize accumulation of therapeutic agents in solid and metastatic tumors by fine-tuning their drug release (35). In this study, we expanded our computational approach to predict distribution of PNAs in metastatic tumors with varying surrounding tissue blood vessel densities (Figure 11) based on a range of experimentally observed values (Figure 8, 10, and S4). The simulations evaluated the effects of physical and biological factors such as tissue diffusion, cell interactions, and opsonization on metastatic CRC tumor detection in the liver up to 2.5 days post injection (Figure 12). The data shows that PNAs reach similar accumulation levels in the acidic interstitium of metastatic tumors within 12 h post injection irrespective of vascularization (hypoxic area data in Figure 12), while medium vascularization induced maximum PNA accumulation in metastatic tumor tissues (Figure 12B). It is noticeable that PNA accumulation in acidic tumor tissue is projected to increase over time while particle concentrations in other tissue areas are expected to decrease (Figure 13). These findings support the notion that hfPNAs hold promise to detect small liver metastatic CRC tumors and thus may be useful to develop novel theranostic tools.
Despite these exciting results, several questions remain to be addressed in future studies. Although PNAs accumulated in liver tissue with metastatic CRC tumors, the diffusion rate of PNAs into tissue was difficult to determine accurately due to fluctuations in tissue density, interstitial space volume, and tissue pH. To accurately measure tissue diffusion rates for PNAs, we used agarose gel tissue mimics with controllable mass transport properties such as density and pH. Low gel density (0.5% w/v) creates pores mimicking the extracellular space between healthy cells (200 to 500 nm), while high gel density (1.0% w/v) provides pores corresponding to the keratin mesh surrounding tumors (50 to 100 nm) (65). The acidity of the gels represents either healthy tissue (pH 7.4), tumor periphery (pH 7) or the tumor core (pH 6) (66). Mass transport in agarose gels has been well studied for physical separation methods such as electrophoresis and gel blotting. Unlike ionizable molecules that change their diffusion rates into agarose gels as a function of pH, PNAs lacking surface charge had consistent flux into agarose gels between pH 7.4 and 6 (Figure 3 and Table 2). There were small pH-dependent variations in flux, but these variations did not represent an overall trend. High gel density reduced PNA flux by ~40% compared to a low gel density. Pores in both gels are large enough (50 to 500 nm) for 30 nm PNAs to enter. If real tumors have smaller pores, it may increase interactions between pores and PNAs slowing long-range diffusion.
We also acknowledge that gel mimics have several physical and chemical limitations in accurately reproducing tissue conditions that could reduce the accuracy of gels to estimate in vivo PNA diffusion rates. For example, gel mimics lack biological components such as lipids and proteins that can affect pore structure and PNA interactions during diffusion (66). In addition, tumors have high interstitial tissue pressure due to disrupted lymphatic drainage, which can further influence PNA transport into metastatic CRC tumors (67). Previous studies show that high intratumoral pressure limits the diffusion of small molecules and nanoparticles into solid tumors (68, 69). In this study, we performed gel diffusion experiments in a high pressure chamber to simulate various tissue conditions. Additional external pressure mimicking blood pressure (120 mmHg) increased initial the entry of PNAs into tissue mimics (<0.5 h) but failed to further enhance PNA diffusion (> 0.5 h). These results conclude that external pressure may force small amounts of PNAs into tumor tissue initially, but blood pressure cannot force PNAs into tumors with high intratumoral pressure. PNAs may change tissue diffusion patterns in patient tumors altering tissue pressure and other microenvironmental factors in various disease states.
Opsonization and aggregation of PNAs with cancer targeting molecules on the surface can reduce tumor accumulation, decrease blood half-life, and increase interactions between PNAs and immune cells (70, 71). PNAs showed negligible opsonization or aggregation in vitro (Figures 5A and 5B). PEG shell seems to shield fluorescent dyes from molecules in solution and allow the dyes to detect the tumor microenvironment. However, fluorescence imaging of hfPNAs shows that the PEG shell does not prevent the diffusion of small acidic molecules into the PNA core, which allows for detection of the acidic tissue (Figures 4A and 4B). Taken together, these results suggest that PNAs with minimal opsonization allow fluorescent dyes to remain in blood and detect acidic tumors or tumor metastasis.
The accumulation of hfPNAs in the cytosol or endosomes of cancer cells may prevent detection of the acidic extracellular tumor microenvironment. Intracellular uptake of PNAs reached equilibrium at 0.5 h post treatment, but small molecule dye MG accumulated in cells up to 6 hours post treatment (Figure 6D). All PNAs showed low cellular uptake (Table 3) with < 0.01% of total PNAs found inside cells in chamber slides, which was estimated from intracellular volume, extracellular volume and measured equilibrium cellular partition coefficients (Table 4). Surprisingly, hydrophobic core modifications slightly increased the uptake of PNAs despite shielding of the hydrophobic core by the PEG shell, suggesting that core of PNAs may interact weakly with the cell membrane through hydrophobic interactions. Ex vivo tissue imaging also verified low cellular uptake of PNAs in liver metastatic CRC tumors (Figure 10). In metastatic CRC tumors, most PNAs were found near blood vessels (CD31-positive endothelial cells). However, PNAs were found throughout healthy liver tissue with high vasculature. These results suggest that hfPNAs remain in the extracellular space of liver stroma and detect the acidic extracellular microenvironment indicating metastatic CRC tumors, but tumor macrophages and other phagocytes in tumor tissue may be involved.
Results from this study suggest that PNAs diffuse throughout healthy and tumor tissue (Figure 3) yet remain in the extracellular space surrounding tumor cells (Figure 6). Macroscopic imaging of n-hfPNAs in liver tissue (Figure 9) implies that PNAs accumulate throughout the liver and metastatic lesions. Because of high background signals in healthy liver tissue and minimal accumulation in metastatic tumors, n-hfPNAs failed to identify metastatic tumors. Microscopic imaging of n-hfPNAs showed only small amounts of PNAs accumulating in the interstitium of metastatic tumors (Figure 10), probably because PNAs outside of cells were washed away during sample preparation for microscopy. In contrast, hfPNAs fluoresced strongly in acidic microenvironments (Figure 4) and identified metastatic tumors in the liver (Figure 9B). Computational simulations verified that accumulation of PNAs in hypoxic acidic regions of MCRC tumors following systemic administration (Figures 11, 12 and 13), although this accumulation was small compared to overall PNA signals from the liver. Therefore, hfPNAs may suppress background signals in healthy tissues surrounding metastatic tumors and accumulate in hypoxic regions to detect small metastatic tumors.
Computational modeling of hfPNAs accumulation in patient tissues from biopsy samples may facilitate clinicians to identify tumors and determine effective treatment regimens. The simulation results indicate that PNAs readily accumulate near the perimeter and within tumor metastases (Figure 11). This prediction agrees with the observed accumulation of PNAs in microscopic fluorescence imaging (Figure 10). The accumulation of PNAs is projected to remain steady within hypoxic (more acidic) tumor regions (Figures 12 and 13). The accumulation of PNAs in hypoxic regions of PNAs allows for the halofluorochromic detection of liver metastatic CRC tumors (Figure 4). This is consistent with our experimental results showing that PNAs near the perimeter of tumors can increase fluorescence and help identify the acidic environment of metastatic tumors. Future experimental work combined with computational modeling will need to determine the minimum size of metastatic CRC tumor foci that hfPNAs can detect.
CONCLUSIONS
In this study, we have confirmed that hfPNAs may be a promising tool for detection of liver metastatic CRC tumors. Data shows that PNAs would diffuse throughout healthy and tumor tissue, yet remain outside cancer cells. Macroscopic imaging implies that PNAs accumulate throughout the liver and emit halofluorochromic signal in the interstitial space between liver and tumor tissues. However, microscopic imaging showed only small amounts of PNAs accumulating in the interstitial space, probably because PNAs outside cells were washed away during sample preparation for microscopy. Nevertheless, hfPNAs fluoresce strongly in acidic microenvironments and identify metastatic CRC tumors as opposed to n-hfPNAs accumulating throughout liver tissue to falsely identify metastatic CRC tumors. Computational simulations evaluated hfPNAs accumulation in hypoxic, acidic regions of metastatic CRC tumors following systemic administration. The combined experimental and computational results suggest that hfPNAs may effectively detect liver metastatic CRC tumors.
Supplementary Material
Acknowledgments
This work was supported by the University of Kentucky Graduate School Allocated Year (GSAY) Fellowship (DR) and the National Institutes of Health grant R01CA195573 (BME and PR).
ABBREVIATIONS
- PNA
Polymer nanoassembly
- CRC
Colorectal cancer
- PEG
Poly(ethylene glycol)
- PEI
Poly(ethylene imine)
- PLL
Poly(lysine)
- PAL
Palmitatic acid
- NB
Nile blue
- hfPNA
Halofluorochromic PNA
- n-hfPNA
Non-halofluorochromic PNA
- hfPNA#/NB
hfPNA with PEG-PEI scaffold labeled with NB dye
- hfPNA/NB
hfPNA labeled with NB dye
- n-hfPNA/Alexa546
n-hfPNA labeled with Alexa546 dye
- n-hfPNA/IR820
n-hfPNA labeled with IR820 dye
- PDX
Patient-derived xenograft
References
- 1.Robinson PJ. The early detection of liver metastases. Cancer Imaging. 2002;2(2):1–3. [Google Scholar]
- 2.Spano D, Heck C, De Antonellis P, Christofori G, Zollo M. Molecular networks that regulate cancer metastasis. Semin Cancer Biol. 2012;22(3):234–249. doi: 10.1016/j.semcancer.2012.03.006. [DOI] [PubMed] [Google Scholar]
- 3.Hugen N, van de Velde CJH, de Wilt JHW, Nagtegaal ID. Metastatic pattern in colorectal cancer is strongly influenced by histological subtype. Annals of Oncology. 2014;25(3):651–657. doi: 10.1093/annonc/mdt591. [DOI] [PMC free article] [PubMed] [Google Scholar]
- 4.Van Cutsem E, Verheul HM, Flamen P, Rougier P, Beets-Tan R, Glynne-Jones R, Seufferlein T. Imaging in Colorectal Cancer: Progress and Challenges for the Clinicians. Cancers (Basel) 2016;8(9):81. doi: 10.3390/cancers8090081. [DOI] [PMC free article] [PubMed] [Google Scholar]
- 5.Kamiya M, Urano Y. Rapid and sensitive fluorescent imaging of tiny tumors in vivo and in clinical specimens. Curr Opin Chem Biol. 2016;33:9–15. doi: 10.1016/j.cbpa.2016.04.004. [DOI] [PubMed] [Google Scholar]
- 6.Maffione AM, Lopci E, Bluemel C, Giammarile F, Herrmann K, Rubello D. Diagnostic accuracy and impact on management of (18)F-FDG PET and PET/CT in colorectal liver metastasis: a meta-analysis and systematic review. Eur J Nucl Med Mol Imaging. 2015;42(1):152–163. doi: 10.1007/s00259-014-2930-4. [DOI] [PubMed] [Google Scholar]
- 7.Barnes KD, Shafirstein G, Webber JS, Koonce NA, Harris Z, Griffin RJ. Hyperthermia-enhanced indocyanine green delivery for laser-induced thermal ablation of carcinomas. Int J Hyperthermia. 2013;29(5):474–479. doi: 10.3109/02656736.2013.817615. [DOI] [PMC free article] [PubMed] [Google Scholar]
- 8.Wu L, Fang S, Shi S, Deng J, Liu B, Cai L. Hybrid polypeptide micelles loading indocyanine green for tumor imaging and photothermal effect study. Biomacromolecules. 2013;14(9):3027–3033. doi: 10.1021/bm400839b. [DOI] [PubMed] [Google Scholar]
- 9.Cabral H, Matsumoto Y, Mizuno K, Chen Q, Murakami M, Kimura M, Terada Y, Kano MR, Miyazono K, Uesaka M, Nishiyama N, Kataoka K. Accumulation of sub-100 nm polymeric micelles in poorly permeable tumors depends on size. Nat Nanotechnol. 2011;6(12):815–823. doi: 10.1038/nnano.2011.166. [DOI] [PubMed] [Google Scholar]
- 10.Mittapalli RK, Adkins CE, Bohn KA, Mohammad AS, Lockman JA, Lockman PR. Quantitative Fluorescent Microscopy to Measure Vascular Pore Sizes in Primary and Metastatic Brain Tumors. Cancer Res. 2016;77(2):238–246. doi: 10.1158/0008-5472.CAN-16-1711. [DOI] [PMC free article] [PubMed] [Google Scholar]
- 11.Ernsting MJ, Murakami M, Roy A, Li S-D. Factors controlling the pharmacokinetics, biodistribution and intratumoral penetration of nanoparticles. J Control Release. 2013;172(3):782–794. doi: 10.1016/j.jconrel.2013.09.013. [DOI] [PMC free article] [PubMed] [Google Scholar]
- 12.Rannard S, Owen A. Nanomedicine: Not a case of “One size fits all”. Nano Today. 2009;4(5):382–384. [Google Scholar]
- 13.Torchilin V. Tumor delivery of macromolecular drugs based on the EPR effect. Adv Drug Deliv Rev. 2011;63(3):131–135. doi: 10.1016/j.addr.2010.03.011. [DOI] [PubMed] [Google Scholar]
- 14.Svenson S. What nanomedicine in the clinic right now really forms nanoparticles? Nanomed Nanobiotech. 2014;6(2):125–135. doi: 10.1002/wnan.1257. [DOI] [PubMed] [Google Scholar]
- 15.Zamboni WC, Torchilin V, Patri AK, Hrkach J, Stern S, Lee R, Nel A, Panaro NJ, Grodzinski P. Best practices in cancer nanotechnology: perspective from NCI nanotechnology alliance. Clin Cancer Res. 2012;18(12):3229–3241. doi: 10.1158/1078-0432.CCR-11-2938. [DOI] [PMC free article] [PubMed] [Google Scholar]
- 16.Blanco E, Hsiao A, Mann Aman P, Landry Matthew G, Meric-Bernstam F, Ferrari M. Nanomedicine in cancer therapy: Innovative trends and prospects. Cancer Sci. 2011;102(7):1247–1252. doi: 10.1111/j.1349-7006.2011.01941.x. [DOI] [PMC free article] [PubMed] [Google Scholar]
- 17.Kim BYS, Rutka JT, Chan WCW. Current concepts: nanomedicine. New Engl J Med. 2010;363(25):2434–2443. doi: 10.1056/NEJMra0912273. [DOI] [PubMed] [Google Scholar]
- 18.Crist RM, Grossman JH, Patri AK, Stern ST, Dobrovolskaia MA, Adiseshaiah PP, Clogston JD, McNeil SE. Common pitfalls in nanotechnology: lessons learned from NCI’s Nanotechnology Characterization Laboratory. Integr Biol. 2013;5(1):66–73. doi: 10.1039/c2ib20117h. [DOI] [PMC free article] [PubMed] [Google Scholar]
- 19.Venditto VJ, Szoka FC. Cancer nanomedicines: so many papers and so few drugs! Adv Drug Del Rev. 2013;65(1):80–88. doi: 10.1016/j.addr.2012.09.038. [DOI] [PMC free article] [PubMed] [Google Scholar]
- 20.Moghimi SM, Farhangrazi ZS. Just so stories: the random acts of anti-cancer nanomedicine performance. Nanomedicine. 2014;10(8):1661–1666. doi: 10.1016/j.nano.2014.04.011. [DOI] [PubMed] [Google Scholar]
- 21.Lee HJ, Bae Y. Pharmaceutical differences between block copolymer self-assembled and cross-linked nanoassemblies as carriers for tunable drug release. Pharm Res. 2013;30(2):478–488. doi: 10.1007/s11095-012-0893-3. [DOI] [PubMed] [Google Scholar]
- 22.Dickerson M, Bae Y. Block copolymer nanoassemblies for photodynamic therapy and diagnosis. Ther Delivery. 2013;4(11):1431–1441. doi: 10.4155/tde.13.105. [DOI] [PubMed] [Google Scholar]
- 23.Lee HJ, Bae Y. Cross-linked nanoassemblies from poly(ethylene glycol)-poly(aspartate) block copolymers as stable supramolecular templates for particulate drug delivery. Biomacromolecules. 2011;12:2686–2696. doi: 10.1021/bm200483t. [DOI] [PubMed] [Google Scholar]
- 24.Lee HJ, Ponta A, Bae Y. Polymer nanoassemblies for cancer treatment and imaging. Ther Delivery. 2010;1(6):803–817. doi: 10.4155/tde.10.70. [DOI] [PubMed] [Google Scholar]
- 25.Bae Y. Drug delivery systems using polymer nanoassemblies for cancer treatment. Ther Delivery. 2010;1:361–363. doi: 10.4155/tde.10.28. [DOI] [PubMed] [Google Scholar]
- 26.Reichel D, Lee MJ, Lee W, Kim KB, Bae Y. Tethered Polymer Nanoassemblies for Sustained Carfilzomib Release and Prolonged Suppression of Proteasome Activity. Ther Delivery. 2016;7(10):665–681. doi: 10.4155/tde-2016-0041. [DOI] [PubMed] [Google Scholar]
- 27.Reichel D, Bae Y. Comparison of Dialysis-and Solvatofluorochromism-Based Methods to Determine Drug Release Rates from Polymer Nanoassemblies. Pharm Res. 2017;34(2):394–407. doi: 10.1007/s11095-016-2070-6. [DOI] [PubMed] [Google Scholar]
- 28.Reichel D, Rychahou P, Bae Y. Polymer nanoassemblies with solvato- and halo-fluorochromism for drug release monitoring and metastasis imaging. Ther Delivery. 2015;6(10):1221–1237. doi: 10.4155/tde.15.59. [DOI] [PMC free article] [PubMed] [Google Scholar]
- 29.Ao L, Reichel D, Hu D, Jeong H-Y, Kim KB, Bae Y, Lee W. Polymer micelle formulations of proteasome inhibitor carfilzomib for improved metabolic stability and anti-cancer efficacy in human multiple myeloma and lung cancer cell lines. J Pharmacol Exp Ther. 2015;355:168–173. doi: 10.1124/jpet.115.226993. [DOI] [PMC free article] [PubMed] [Google Scholar]
- 30.Rheiner S, Rychahou P, Bae Y. Effects of the Lipophilic Core of Polymer Nanoassemblies on Intracellular Delivery and Transfection of siRNA. AIMS Biophysics. 2015;2(3):284–302. [Google Scholar]
- 31.Rheiner S, Bae Y. Increased poly(ethylene glycol) density decreases transfection efficacy of siRNA/poly(ethylene imine) complexes. AIMS Bioengineering. 2016;3(4):454–467. [Google Scholar]
- 32.Dickerson M, Howerton B, Bae Y, Glazer E. Light-sensitive ruthenium complex-loaded cross-linked polymeric nanoassemblies for the treatment of cancer. J Mater Chem B Mater Biol Med. 2016;4:394–408. doi: 10.1039/C5TB01613D. [DOI] [PMC free article] [PubMed] [Google Scholar]
- 33.Dickerson M, Winquist N, Bae Y. Photo-inducible cross-linked nanoassemblies for controlled drug delivery. Pharm Res. 2013;31:1254–1263. doi: 10.1007/s11095-013-1246-6. [DOI] [PMC free article] [PubMed] [Google Scholar]
- 34.Dan M, Scott DF, Hardy PA, Wydra RJ, Hilt JZ, Yokel RA, Bae Y. Block copolymer cross-linked nanoassemblies improve particle stability and biocompatibility of superparamagnetic iron oxide nanoparticles. Pharm Res. 2013;30(2):552–561. doi: 10.1007/s11095-012-0900-8. [DOI] [PMC free article] [PubMed] [Google Scholar]
- 35.Curtis LT, Rychahou P, Bae Y, Frieboes HB. A computational/experimental assessment of antitumor activity of polymer nanoassemblies for ph-controlled drug delivery to primary and metastatic tumors. Pharm Res. 2016;33:2552–2564. doi: 10.1007/s11095-016-1981-6. [DOI] [PubMed] [Google Scholar]
- 36.Vazquez A, Liu J, Zhou Y, Oltvai ZN. Catabolic efficiency of aerobic glycolysis: the Warburg effect revisited. BMC Syst Biol. 2010;4:58. doi: 10.1186/1752-0509-4-58. [DOI] [PMC free article] [PubMed] [Google Scholar]
- 37.Vander Heiden MG, Thompson CB, Cantley LC. Understanding the Warburg effect: the metabolic requirements of cell proliferation. Science. 2009;324(5930):1029–1033. doi: 10.1126/science.1160809. [DOI] [PMC free article] [PubMed] [Google Scholar]
- 38.van de Ven AL, Abdollahi B, Martinez CJ, Burey LA, Landis MD, Chang JC, Ferrari M, Frieboes HB. Modeling of nanotherapeutics delivery based on tumor perfusion. New J Phys. 2013;15(5):55004. doi: 10.1088/1367-2630/15/5/055004. [DOI] [PMC free article] [PubMed] [Google Scholar]
- 39.Wu M, Frieboes HB, Chaplain MAJ, McDougall SR, Cristini V, Lowengrub JS. The effect of interstitial pressure on therapeutic agent transport: Coupling with the tumor blood and lymphatic vascular systems. J Theor Biol. 2014;355:194–207. doi: 10.1016/j.jtbi.2014.04.012. [DOI] [PMC free article] [PubMed] [Google Scholar]
- 40.Wu M, Frieboes HB, McDougall SR, Chaplain MAJ, Cristini V, Lowengrub J. The effect of interstitial pressure on tumor growth: Coupling with the blood and lymphatic vascular systems. J Theor Biol. 2013;320:131–151. doi: 10.1016/j.jtbi.2012.11.031. [DOI] [PMC free article] [PubMed] [Google Scholar]
- 41.Zaytseva YY, Elliott VA, Rychahou P, Mustain WC, Kim JT, Valentino J, Gao T, O’Connor KL, Neltner JM, Lee EY, Weiss HL, Evers BM. Cancer cell-associated fatty acid synthase activates endothelial cells and promotes angiogenesis in colorectal cancer. Carcinogenesis. 2014;35(6):1341–1351. doi: 10.1093/carcin/bgu042. [DOI] [PMC free article] [PubMed] [Google Scholar]
- 42.Elliott VA, Rychahou P, Zaytseva YY, Evers BM. Activation of c-Met and upregulation of CD44 expression are associated with the metastatic phenotype in the colorectal cancer liver metastasis model. PLoS One. 2014;9(5):e97432. doi: 10.1371/journal.pone.0097432. [DOI] [PMC free article] [PubMed] [Google Scholar]
- 43.Zaytseva YY, Rychahou PG, Gulhati P, Elliott VA, Mustain WC, O’Connor K, Morris AJ, Sunkara M, Weiss HL, Lee EY, Evers BM. Inhibition of fatty acid synthase attenuates CD44-associated signaling and reduces metastasis in colorectal cancer. Cancer Res. 2012;72(6):1504–1517. doi: 10.1158/0008-5472.CAN-11-4057. [DOI] [PMC free article] [PubMed] [Google Scholar]
- 44.Gulhati P, Bowen KA, Liu J, Stevens PD, Rychahou PG, Chen M, Lee EY, Weiss HL, O’Connor KL, Gao T, Evers BM. mTORC1 and mTORC2 regulate EMT, motility, and metastasis of colorectal cancer via RhoA and Rac1 signaling pathways. Cancer Res. 2011;71(9):3246–3256. doi: 10.1158/0008-5472.CAN-10-4058. [DOI] [PMC free article] [PubMed] [Google Scholar]
- 45.Rychahou PG, Kang J, Gulhati P, Doan HQ, Chen LA, Xiao SY, Chung DH, Evers BM. Akt2 overexpression plays a critical role in the establishment of colorectal cancer metastasis. PNAS. 2008;105(51):20315–20320. doi: 10.1073/pnas.0810715105. [DOI] [PMC free article] [PubMed] [Google Scholar]
- 46.Reichel D, Bae Y. Comparison of Dialysis- and Solvatofluorochromism-Based Methods to Determine Drug Release Rates from Polymer Nanoassemblies. Pharmaceutical Research. 2016:1–14. doi: 10.1007/s11095-016-2070-6. [DOI] [PubMed] [Google Scholar]
- 47.Reichel D, Rychahou P, Bae Y. Polymer nanoassemblies with solvato- and halo-fluorochromism for drug release monitoring and metastasis imaging. Ther Deliv. 2015;6(10):1221–1237. doi: 10.4155/tde.15.59. [DOI] [PMC free article] [PubMed] [Google Scholar]
- 48.Chaudhari KR, Ukawala M, Manjappa AS, Kumar A, Mundada PK, Mishra AK, Mathur R, Monkkonen J, Murthy RS. Opsonization, biodistribution, cellular uptake and apoptosis study of PEGylated PBCA nanoparticle as potential drug delivery carrier. Pharm Res. 2012;29(1):53–68. doi: 10.1007/s11095-011-0510-x. [DOI] [PubMed] [Google Scholar]
- 49.Zhang M, Liu Y-Q, Ye B-C. Colorimetric assay for sulfate using positively-charged gold nanoparticles and its application for real-time monitoring of redox process. Analyst. 2011;136(21):4558–4562. doi: 10.1039/c1an15632b. [DOI] [PubMed] [Google Scholar]
- 50.Rausch K, Reuter A, Fischer K, Schmidt M. Evaluation of Nanoparticle Aggregation in Human Blood Serum. Biomacromolecules. 2010;11(11):2836–2839. doi: 10.1021/bm100971q. [DOI] [PubMed] [Google Scholar]
- 51.Chaudhari KR, Ukawala M, Manjappa AS, Kumar A, Mundada PK, Mishra AK, Mathur R, Mönkkönen J, Murthy RSR. Opsonization, Biodistribution, Cellular Uptake and Apoptosis Study of PEGylated PBCA Nanoparticle as Potential Drug Delivery Carrier. Pharmaceutical Research. 2012;29(1):53–68. doi: 10.1007/s11095-011-0510-x. [DOI] [PubMed] [Google Scholar]
- 52.Opitz AW, Czymmek KJ, Wickstrom E, Wagner NJ. Uptake, efflux, and mass transfer coefficient of fluorescent PAMAM dendrimers into pancreatic cancer cells. Biochim Biophys Acta. 2013;1828(2):294–301. doi: 10.1016/j.bbamem.2012.09.016. [DOI] [PMC free article] [PubMed] [Google Scholar]
- 53.Curtis LT, Rychahou P, Bae Y, Frieboes HB. A Computational/Experimental Assessment of Antitumor Activity of Polymer Nanoassemblies for pH-Controlled Drug Delivery to Primary and Metastatic Tumors. Pharmaceutical Research. 2016;33(10):2552–2564. doi: 10.1007/s11095-016-1981-6. [DOI] [PubMed] [Google Scholar]
- 54.van de Ven AL, Wu M, Lowengrub J, McDougall SR, Chaplain MA, Cristini V, Ferrari M, Frieboes HB. Integrated intravital microscopy and mathematical modeling to optimize nanotherapeutics delivery to tumors. AIP Adv. 2012;2(1):11208. doi: 10.1063/1.3699060. [DOI] [PMC free article] [PubMed] [Google Scholar]
- 55.Wu M, Frieboes HB, Chaplain MA, McDougall SR, Cristini V, Lowengrub JS. The effect of interstitial pressure on therapeutic agent transport: coupling with the tumor blood and lymphatic vascular systems. J Theor Biol. 2014;355:194–207. doi: 10.1016/j.jtbi.2014.04.012. [DOI] [PMC free article] [PubMed] [Google Scholar]
- 56.Wu M, Frieboes HB, McDougall SR, Chaplain MA, Cristini V, Lowengrub J. The effect of interstitial pressure on tumor growth: coupling with the blood and lymphatic vascular systems. J Theor Biol. 2013;320:131–151. doi: 10.1016/j.jtbi.2012.11.031. [DOI] [PMC free article] [PubMed] [Google Scholar]
- 57.Fang J, Nakamura H, Maeda H. The EPR effect: Unique features of tumor blood vessels for drug delivery, factors involved, and limitations and augmentation of the effect. Adv Drug Deliv Rev. 2011;63(3):136–151. doi: 10.1016/j.addr.2010.04.009. [DOI] [PubMed] [Google Scholar]
- 58.Kekelidze M, D’Errico L, Pansini M, Tyndall A, Hohmann J. Colorectal cancer: current imaging methods and future perspectives for the diagnosis, staging and therapeutic response evaluation. World J Gastroenterol. 2013;19(46):8502–8514. doi: 10.3748/wjg.v19.i46.8502. [DOI] [PMC free article] [PubMed] [Google Scholar]
- 59.Terranova N, Girard P, Klinkhardt U, Munafo A. Resistance Development: A Major Piece in the Jigsaw Puzzle of Tumor Size Modeling. CPT Pharmacometrics Syst Pharmacol. 2015;4(6):320–323. doi: 10.1002/psp4.45. [DOI] [PMC free article] [PubMed] [Google Scholar]
- 60.Etrych T, Lucas H, Janouskova O, Chytil P, Mueller T, Mader K. Fluorescence optical imaging in anticancer drug delivery. J Control Release. 2016;226:168–181. doi: 10.1016/j.jconrel.2016.02.022. [DOI] [PubMed] [Google Scholar]
- 61.Cao P, Ponta A, Kim JA, Bae Y. Block copolymer crosslinked nanoassemblies co-entrapping acridine yellow and doxorubicin for cancer theranostics. British J Pharm Res. 2013;3(4):523–535. [Google Scholar]
- 62.Shao D, Lu MM, Zhao YW, Zhang F, Tan YF, Zheng X, Pan Y, Xiao XA, Wang Z, Dong WF, Li J, Chen L. The shape effect of magnetic mesoporous silica nanoparticles on endocytosis, biocompatibility and biodistribution. Acta Biomater. 2017;49:531–540. doi: 10.1016/j.actbio.2016.11.007. [DOI] [PubMed] [Google Scholar]
- 63.Kumar R, Roy I, Ohulchanskky TY, Vathy LA, Bergey EJ, Sajjad M, Prasad PN. In vivo biodistribution and clearance studies using multimodal organically modified silica nanoparticles. ACS Nano. 2010;4(2):699–708. doi: 10.1021/nn901146y. [DOI] [PMC free article] [PubMed] [Google Scholar]
- 64.Sindhwani S, Syed AM, Wilhelm S, Glancy DR, Chen YY, Dobosz M, Chan WCW. Three-Dimensional Optical Mapping of Nanoparticle Distribution in Intact Tissues. ACS Nano. 2016;10(5):5468–5478. doi: 10.1021/acsnano.6b01879. [DOI] [PubMed] [Google Scholar]
- 65.Verkman AS. Diffusion in the extracellular space in brain and tumors. Phys Biol. 2013;10(4):045003. doi: 10.1088/1478-3975/10/4/045003. [DOI] [PMC free article] [PubMed] [Google Scholar]
- 66.Shrinivas P, Kasapis S, Tongdang T. Morphology and mechanical properties of bicontinuous gels of agarose and gelatin and the effect of added lipid phase. Langmuir. 2009;25(15):8763–8773. doi: 10.1021/la9002127. [DOI] [PubMed] [Google Scholar]
- 67.Tufto I, Lyng H, Rofstad EK. Interstitial fluid pressure, perfusion rate and oxygen tension in human melanoma xenografts. Br J Cancer Suppl. 1996;27:S252–255. [PMC free article] [PubMed] [Google Scholar]
- 68.Watson KD, Lai CY, Qin S, Kruse DE, Lin YC, Seo JW, Cardiff RD, Mahakian LM, Beegle J, Ingham ES, Curry FR, Reed RK, Ferrara KW. Ultrasound increases nanoparticle delivery by reducing intratumoral pressure and increasing transport in epithelial and epithelial-mesenchymal transition tumors. Cancer Res. 2012;72(6):1485–1493. doi: 10.1158/0008-5472.CAN-11-3232. [DOI] [PMC free article] [PubMed] [Google Scholar]
- 69.Durymanov MO, Rosenkranz AA, Sobolev AS. Current Approaches for Improving Intratumoral Accumulation and Distribution of Nanomedicines. Theranostics. 2015;5(9):1007–1020. doi: 10.7150/thno.11742. [DOI] [PMC free article] [PubMed] [Google Scholar]
- 70.Beck-Broichsitter M, Nicolas J, Couvreur P. Design attributes of long-circulating polymeric drug delivery vehicles. Eur J Pharm Biopharm. 2015;97(Pt B):304–317. doi: 10.1016/j.ejpb.2015.03.033. [DOI] [PubMed] [Google Scholar]
- 71.Gao H, He Q. The interaction of nanoparticles with plasma proteins and the consequent influence on nanoparticles behavior. Expert Opin Drug Deliv. 2014;11(3):409–420. doi: 10.1517/17425247.2014.877442. [DOI] [PubMed] [Google Scholar]
Associated Data
This section collects any data citations, data availability statements, or supplementary materials included in this article.


