

Abstract
Abnormal deposition of aggregated wild-type (WT) human transthyretin (TTR) and its pathogenic variants is responsible for cardiomyopathy and neuropathy related to TTR amyloidosis. The tryptophan (Trp) fluorescence measurements typically used to study structural changes of TTR do not yield site-specific information on the two Trp residues per TTR protomer. To obtain such information, tryptophan labeled with fluorine at the 5 and 6 positions (5FW and 6FW) was incorporated into TTR. Fluorescence of 5FW and 6FW-labeled WT-TTR (WT-5FW and WT-6FW) and a single-Trp mutant W41Y showed that the photophysics of incorporated fluoro-Trp is consistent with site-specific solvation of the indole ring of W41 and W79. 19F-NMR showed that solvent accessibility depends on both the location of the Trp and the position of the fluorine substituent in the indole ring. Unexpectedly, differences were observed in the rates of aggregation, with WT-6FW aggregating more rapidly than WT-5FW or WT TTR. Real-time 19F-NMR urea unfolding experiments revealed that WT-5FW is kinetically more stable than WT-6FW, consistent with the aggregation assay. In addition, structural perturbations of residues distant from either Trp site are more extensive in WT-6FW. Notably, residues in the dimer interfaces are perturbed by 6FW at residue 79; pathogenic mutations in these regions are associated with reduced tetramer stability and amyloidogenesis. The differences in behavior that arise from the replacement of a fluorine at the 5-position of a tryptophan with one at the adjacent 6-position emphasizes the delicate balance of stability in the TTR tetramer.
Graphical Abstract

Introduction
Human amyloid diseases are directly associated with misfolding and aberrant aggregation of certain proteins.1 One of these aggregation-prone proteins, transthyretin (TTR), is a 55-kDa homotetramer present in plasma and cerebrospinal fluid.2 The normal function of TTR is to transport thyroxine and retinol-binding protein/retinol complex in the blood.3, 4 Amyloidogenic deposits of wild-type transthyretin (WT-TTR) in the heart cause senile systemic amyloidosis, which affects as much as 25% of the population over age 80.5 In addition, formation of mis-assembled aggregates of more than 100 autosomal dominant pathogenic TTR mutants results in familial amyloid cardiomyopathy and familial amyloid polyneuropathy.6 The V122I mutation, for example, leads to cardiac amyloidosis in 3–4% of African Americans.7 Because of the high prevalence and the causative connection to TTR amyloidosis, it is clear that understanding the molecular basis of TTR amyloidosis is of great importance.
Native TTR is a tetramer (formed as a dimer of dimers) in which each subunit consists of a β-sandwich fold formed from a pair of four-stranded β-sheets (DAGH and CBEF, Fig. 1A, B) that enclose a hydrophobic core. Extensive inter-protomer interactions contribute to the stabilization of the native tetrameric TTR architecture.8 To initiate amyloidogenic aggregation, the native TTR tetramer must first dissociate to form a folded and structured monomer,9–11 which undergoes conformational fluctuations12 and samples a partially unfolded state to self-assemble into fibrils in a downhill polymerization process.13 Importantly, the aggregation propensities of some well-studied pathogenic mutants correlate well with their tetramer dissociation rates as probed by the intrinsic tryptophan (Trp) fluorescence changes as a function of urea concentrations.14 These mechanistic observations point to tetramer dissociation as the rate-limiting step;13, 15 the energetics of the multi-step dissociation-unfolding-aggregation equilibrium is indeed encoded in the sequences of TTR variants. However, the molecular basis of the tetramer destabilization in pathogenic TTR mutants remains poorly understood.
Figure 1.

TTR structures. (A) Overlaid X-ray structure of WT-TTR (gray, PDB: 1BMZ)39 and modeled structures of WT-5FW (red) and WT-6FW (cyan). The heavy atoms of residues 41 and 79 are shown by green and orange spheres, respectively. (B) Structure of a TTR monomeric unit (PDB: 1BMZ) showing the topology of the two four-stranded β-sheets (CBEF and DAGH). (C) The chemical structures of 5FW and 6FW with the indole ring numbering indicated on 5FW.
There are two native Trp residues in WT-TTR: W41 is located at the beginning of the C strand and W79 is within the sole helix, between the E and F strands (the EF helix, Fig. 1B). Their well-separated locations provide a useful means to probe site-dependent structural information regarding TTR. In a routine Trp fluorescence measurement of TTR, however, such information is lost due to the overlapped emission spectra of the two tryptophans.16 To obtain site-specific information on changes in the Trp environment during structural rearrangements, we incorporated fluorotryptophan into the protein in place of Trp, and used 19F-NMR, which has high sensitivity, 100% natural abundance of the NMR-active nucleus and a large chemical shift dispersion range,17 to directly probe the local environment of the 19F nucleus in each fluorinated Trp. 19F-NMR has been applied to obtain site-specific structural information and conformational dynamics in a number of proteins.18–21 Here we report a 19F-NMR study of TTR, in conjunction with UV absorbance, Trp fluorescence spectroscopy and computational modeling. Two 19F probes, substituted at the 5- and 6-positions of the indole ring (Fig. 1C; 5FW and 6FW respectively) provide site-resolved structural information for Trp at residues 41 and 79. Acid-mediated aggregation assays and real-time 19F-NMR urea unfolding experiments show that WT-TTR containing 5FW (WT-5FW) is more stable than WT-TTR labeled by 6FW (WT-6FW). Backbone amide chemical shift perturbations indicate that remote structural changes not adjacent to either Trp site are more extensive in WT-6FW than WT-5FW, which could be related to the substituted fluorine at the 6-position in residue 79 (6F-W79). The 5-position substitution in this residue (5F-W79) appears to be better tolerated, consistent with the 19F-NMR observation and modeling results that 5F-W79 is solvent exposed whereas 6F-W79 is not. The site-specific information provided by the use of 19F-NMR with fluorotryptophan-substituted TTR, together with the changes in behavior induced by the position of the fluorine label at the 5- or 6-position, suggest that this approach will be particularly valuable in delineating the effects of disease-causing mutations on the delicately-balanced stability of the TTR tetramer.
Materials and Methods
Unless otherwise mentioned, 10 mM potassium phosphate and 100 mM KCl at pH 7.0 was used as buffer (NMR buffer) and experiments were performed at 298 K. Images of TTR structures were prepared using PyMOL.22
Site-directed mutagenesis
Primers for W41Y (5′-ggctgctgatgacacctatgagccatttgcctctgg-3′ and 5′-ccagaggcaaatggctcataggtgtcatcagcagcc-3′) were ordered from IDT and the site-directed mutagenesis PCR was performed using the QuikChange Kit (Agilent), according to the manufacturer’s instructions.
Protein expression and purification
The human TTR sequence that includes a N-terminal Met was encoded in a pET29a plasmid. A fresh transformation to the E. coli BL21 Star (DE3) strain was performed for every batch of protein expression. The M9 medium containing 1 g/L (14NH4)2SO4 or (15NH4)2SO4 (Cambridge Isotope Laboratories) and 3 g/L 12C-glucose was used in expression. Around 5 mL of the overnight M9 starter culture with 50 μg/mL kanamycin was used to inoculate a 50-mL M9 growth culture at 310 K. For 19F-labeling, 3 mg of 5FW or 6FW (Sigma) was added when the optical density at 600 nm (OD600) reached 0.6 and 1 mM isopropyl β-D-1-thiogalactopyranoside (IPTG) was added 30 min later. Cell culture was then expressed at 310 K for 4 hr. We found that the inclusion of glyphosate as an inhibitor of the shikimate aromatic amino acid biosynthetic pathway23 during expression for 5FW- or 6FW-labeling was not necessary for TTR (Fig. S1). Incorporation of 5FW and 6FW WT-TTR and in a single-tryptophan mutant W41Y was nearly complete, as indicated by electrospray ionization mass spectrometry (Table S1). The cell pellet was re-suspended in a buffer of 50 mM Tris, 150 mM NaCl (pH 7.6) supplemented with ethylenediaminetetraacetic acid (EDTA)-free protease inhibitor (Thermo Fisher), followed by ammonium sulfate precipitation twice (21% and 33%, w/v). The resultant TTR pellet was re-suspended and injected to a Superdex 75 and then a Capto Q ImpRes column (GE Healthcare Life Sciences) for purification. Protein fractions were pooled and exchanged to NMR buffer by a PD25 column (GE Healthcare Life Sciences).
Trp fluorescence
Trp fluorescence measurements were performed on a Fluorolog 3 spectrometer (Horiba/Jobin Yvon) in the L-format. Trp was excited at 280 nm and its emission was scanned from 320 nm to 420 nm with 1 nm as the wavelength interval. The slit width was 5 nm and the integration time was set as 0.2 s. The concentration of TTR was around 1 μM in the measurements.
Circular dichroism (CD)
CD measurements were performed using an Aviv 62DS/202 CD spectrometer. Approximately 0.4 mg/mL protein was used in a 1-mm cuvette and the wavelength was scanned from 260 nm to 200 nm in 1-nm steps with an integration time of 2 s. The bandwidth was set at 2 nm. Raw ellipticity was averaged from three scans and converted to mean residue ellipticity (Fig. S2).
Size-exclusion analysis
A Superdex 75 gel filtration column with a bed volume of 121 mL was used with NMR buffer as the running buffer at 0.7 mL/min. Approximately 100 μL of 100 μM protein was injected and the effective in-column concentration was around 1 μM after dilution. The elution was monitored by absorbance at 280 nm. Consistent with the computational modeling, we found that both WT-5FW and WT-6FW are predominantly tetrameric at 1 NM, as is WT-TTR (Fig. S3).
Electrospray ionization time-of-flight (ESI-TOF) mass spectrometry
An ESI-TOF spectrometer (Agilent) was used to measure the molecular mass of Trp-labeled TTR. Around 5 μL of 10 μM TTR was injected for analysis. For mass deconvolution, a window of 10000 to 20000 was used with the molecular weight agreement as 0.05%.
Aggregation assay
The aggregation assay was performed as previously reported.9 Briefly, un-agitated TTR samples (0.2 mg/mL) were incubated at 310 K for 2 days in 50 mM sodium acetate and 100 mM KCl at pH 4.4. At specified time points, the optical density at 330 nm (OD330) was measured after a thorough vortex mixing.
NMR experiments
19F-NMR measurements were performed on a Bruker Avance 601 spectrometer equipped with a QCI 1H/19F–13C/15N quadruple resonance cryoprobe and a shielded z-gradient coil. The NMR buffer was extensively degassed with argon and NMR tubes were purged by argon before use. For 19F-peak assignments, 100 μM TTR was used in NMR buffer in 10% D2O. For urea unfolding experiments, TTR in NMR buffer containing 10% D2O was mixed with an equal volume of urea buffer (12 M urea, 50 mM potassium phosphate, 100 mM KCl, 1 mM EDTA, 10 mM dithiothreitol (DTT) at pH 7.0 with 10% D2O) to initialize unfolding. 1H-coupled 19F spectra were collected due to the negative nuclear Overhauser effects for 5FW/6FW.19 Spectra were acquired with 4k complex points using a pulse length of 10 μs, sweep width of 40 ppm, carrier offset at -120 ppm, and inter-scan relaxation delay of 1 s. A 10-Hz exponential line-broadening factor was applied to enhance signal/noise and the time domain data were zero-filled to 16k before Fourier transformation. The 19F chemical shifts were referenced using an internal standard (free 5FW for 6FW-labeled samples, free 6FW for 5FW-labeled samples). The 19F longitudinal relaxation time constant T1 was measured using a standard inversion recovery pulse sequence with a relaxation delay of 5 s. Delays of 0.0001, 0.005, 0.01, 0.02, 0.05, 0.07, 0.1, 0.15, 0.2, 0.3, 0.5, 0.8, 1 and 2 s were used for unfolded TTR, delays of 0.02, 0.05, 0.1, 0.25, 0.5, 0.75, 1, 1.25, 1.5, 2 and 2.5 s were used for folded TTR. The peak intensity was fitted using a single exponential function using the nonlinear least square method.24 Uncertainties were calculated as one standard deviation of 50 bootstrapped datasets.25 Translational diffusion coefficients were measured on a Bruker Avance 900 MHz spectrometer using a transverse relaxation-optimized pulse field gradient experiment.26 A total of 11 x-gradient strengths from 6.8 G/cm to 23.8 G/cm were used with a diffusion delay of 200 ms and recycle delay of 1 s. All NMR data were acquired by XWinNMR/TopSpin NMR and processed by NMRPipe27 and results were analyzed and visualized by MATLAB and Python. CSP was calculated according to Ref28 using .
19F-NMR unfolding kinetics analysis
The line shapes of the unfolded 19F peaks were fitted using the appropriate number of Lorentzian function(s)29 and the integrated peak areas from the fitted Lorentzians were used to quantify the unfolding kinetics described by a single exponential function. The fitting uncertainty is reported as one standard deviation from 50 bootstrapped datasets. We noted that the numerical fitting of the time-dependent decrease in peak areas for peaks belonging to W41 and W79 in the folded species yields similar results (data not shown). The relative peak areas for unfolded W41 and W79 are expected to report the relative number of 19F nuclei at each Trp site due to the nearly identical T1 time constants (Table S2).
19F-Trp model-free relaxation analysis
The contribution of dipole-dipole coupling (DD, the first term) and chemical shift anisotropy (CSA, the second term) to 19F T1 and T2 relaxation is described by the following equations:30, 31
| (1) |
| (2) |
where ρ is the density for proton-containing spheres in proteins as 5.73 ×1028 m−3 from Sarker et al,32 rmin is the minimal distance from the nearest proton (2.6 Å) used for the spherical integral taken from Luck et al.31 J(ω) is the spectral density functions described by Abragam33 sampled at the angular frequencies of 19F or 1H nuclei (ωH or ωF at 14.1 T in our work) or linear combinations thereof, δz is the chemical anisotropy for 19F-Trp, η is the corresponding asymmetry and K = μ0γHγFħ/4π, where μ0 is the vacuum permeability constant, γx is the magnetogyric ratio for nucleus x and ħ is the reduced Planck constant. For 5FW, δz = −62.3 ppm and η = 0.24.31 For 6FW, δz = −65.4 ppm and η = 0.37.34 The model-free formalism for spectral density from Lipari and Szabo35, 36 under the isotropic tumbling condition takes on the following form:
| (3) |
where τc is the overall rotational correlation time for TTR, which can be approximated by:29
| (4) |
where η is the viscosity of the solvent, r is the hydrodynamic radius of TTR, kB is the Boltzmann constant and T is the temperature. Empirical formulas from Cho et al.37 were used to correct for the viscosity in the presence of 10% (v/v) D2O and values from Kawahara and Tanford38 were used to account for 6 M urea. The hydrodynamic radius of TTR can be roughly estimated by:
| (5) |
where V̄ is the specific volume (0.73 cm3/g), M is the molecular weight, NA is the Avogadro’s constant and rw is the thickness of the hydration shell (1.6–3.2 Å).29 Under these numerical conditions, the theoretical T1 and T2 values for 19F in TTR can be predicted using equations (1)(2).
Molecular modeling
The starting structure was taken from the X-ray structures of WT-TTR PDB: 1BMZ39 or PDB: 1F4140 (results not shown). The corresponding X-ray symmetry (C2 and D2, respectively) was used to create the tetramer structure from the crystallographic dimer structure. The choice of starting structures did not change the observation that the fluorine atoms can be tolerated by the TTR tetrameric structure in modeling. All 8 Trp residues in a TTR tetramer were replaced with 5FW or 6FW, the parameters of which were determined using AMBER Antechamber program using AM1-BCC model.41, 42 Each protein was placed in a cuboid TIP3 water43 box larger than TTR by a minimal 10-Å on all sides and Na+ was used as the counter ion. Energy minimization was performed using AMBER 12 with ff12SB as the force field.44 Solvent was minimized first with 500 cycles of steepest descent (SD) steps before conjugation gradient minimization. The maximal number of cycles of minimization was 10000. During the solvent minimization, all TTR residues were constrained by a force constant of 500 kcal/mol/Å2 around the X-ray structural positions. Constant volume periodic particle mesh Ewald45 boundaries were used with the non-bonded cutoff set to 10 Å. The system was minimized with 10 cycles of SD steps before the conjugation gradient minimization and the maximal step of minimization was 10000. The relative solvent accessible surface area (SASA) per residue was calculated using the GETAREA software46 with the input structure as PDB: 1BMZ.39 The radius of the water probe was set at 1.4 Å.
Results
Modeling the TTR tetramer with fluorinated Trp
To evaluate whether the fluorine atoms at the 5- or 6-position of the indole ring could be tolerated by TTR without causing substantial overall structural changes, in silico modeling was first performed to incorporate either 5FW or 6FW at residue 41 and 79, followed by a global energy minimization. As expected, the slight increase in van der Waals radius upon replacement of hydrogen by fluorine (~0.3 Å)47 at these locations seems to be well tolerated by the tetrameric structure, leading to minimal structural changes in the energy-minimized models when compared to non-labeled WT-TTR (root-mean-square deviation, RMSD ~0.3–0.4 Å for both WT-5FW and WT-6FW, Fig. 1A). However, modeling alone cannot exclude the possibility of subtle perturbations of the conformational dynamics of TTR (see below).
Photophysical characterization of fluoro-substituted Trp in TTR
We first characterized TTR labeled with fluorinated Trp by UV absorbance. Two π→π* electronic transitions, 1La and 1Lb, are responsible for the absorbance band of the Trp indole ring around 280 nm.16, 48 Consistent with a previous report,49 the introduction of 5FW to WT-TTR leads to a slight red-shift (by 2 nm) of the 280nm UV absorbance peak when compared to the unlabeled control (Fig. 2A). As previously noted,50, 51 it is likely that this shift is caused by an energy level change in the 1Lb transition, which has a more structured absorbance band than 1La.16, 48 The intensity of the absorbance side-band at 300 nm relative to the main band at 280 nm appears to be correlated with the number of incorporated 5FW residues, which conveniently serves as a spectroscopic hallmark for qualitative estimation of labeling efficiency (Fig. S1). In the case of WT-6FW (Fig. 2B), the ~300 nm side-band is not as pronounced as that for WT-5FW, though it still appears to be correlated with the number of labeled tryptophans.
Figure 2.

UV absorbance and fluorescence spectroscopic characterizations of unlabeled and labeled TTR variants. (A, B) Comparison of normalized absorbance spectra of 5FW-labeled (A) and 6FW-labeled TTR (B). The absorbance side band with fluorinated Trp is labeled with arrows. (C, D) Comparison of normalized tryptophan fluorescence emission spectra in various TTR variants with 5FW-labeled TTR in (C) and 6FW-labeled TTR in (D). Labeling of the solvent-exposed W41 with either 5FW or 6FW shows a red-shifted emission (~15 nm) indicated with arrows, which is due to larger solvation stabilization of 1La transition in substituted Trp. Inset in C: the two electronic transitions (1La and 1Lb) are indicated with arrows on the structure of indole, adapted from Lakowicz.16
Intrinsic Trp fluorescence spectroscopy offers useful information regarding the local environments surrounding the indole ring.9, 16 In aqueous solvents, 1La (Fig. 2C, inset) is identified as the main emitting state for the un-substituted Trp as well as for 5FW and 6FW;50 this electronic transition is more sensitive to solvent polarity changes than 1Lb.52 The 1La excited state in 5FW and 6FW has a larger dipole moment than that of un-substituted Trp.53, 54 Consequently, the excited state in fluoro-Trp derivatives is preferentially stabilized by solvation in polar environments compared to un-substituted Trp.55 Thus, incorporation of 5FW or 6FW at a solvent-exposed site is expected to lead to more strongly red-shifted fluorescence emission than for a buried site. Indeed, the fluorescence emission peak for 5F-W79 and 6F-W79 in the W41Y mutant exhibits little red shift compared to the un-substituted W41Y (< 4 nm, Fig. 2C, D) since the indole ring at residue 79 is almost completely buried (1% relative side chain solvent accessible surface area, SASA, Fig. 3B, D). In sharp contrast, the emission of substituted Trp in either WT-5FW or WT-6FW, with an additional fluoro-Trp at residue 41, is red-shifted by ~15 nm compared to W41Y-5F-W79 and W41Y-6F-W79, which is due to the increased stabilization of the 1La excited state of the partially solvent-exposed indole ring at residue 41 (24% relative side chain, Fig. 3A, C). The red-shift in the fluorescence spectrum upon 5FW- or 6FW-substitution in TTR is similar to previous reports for other proteins.50, 56, 57 Thus, the photophysics of the two Trp residues matches well with their structural features, for both 5FW and 6FW probes.
Figure 3.
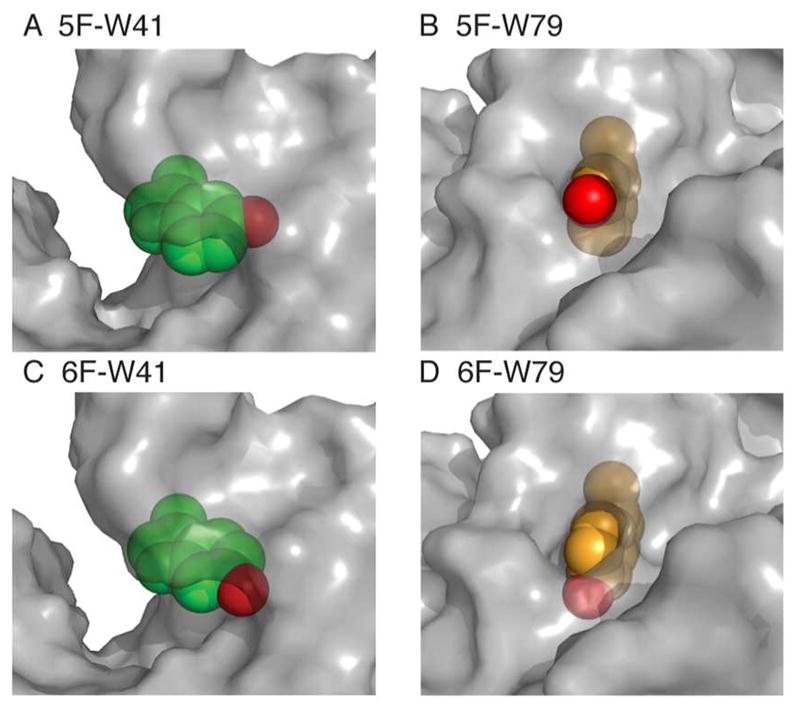
Surface close-up of the two 5FW (A, B) and 6FW (C, D) residues in WT-5FW and WT-6FW, derived from the modeled structures shown in Figure 1. The indole side chain at W41 (green spheres) is partially solvent accessible with 5- (red, A) fully buried and 6-position (red, C) partially buried. In the case of W79 (orange spheres), most of the indole, including the 6-position (red, D) is structurally buried except for the substituted fluorine atom on the 5-position, which is solvent exposed (red, B).
Higher aggregation propensity for WT-6FW than WT-5FW
The similarity in the photophysics of TTR substituted with 5FW and 6FW, together with their high incorporation yields, and the similarity of their secondary structures monitored by circular dichroism (Fig. S2) led us to expect similar aggregation kinetics for TTR substituted with these two labeled tryptophans. To our surprise, we observed a substantial difference: WT-6FW aggregated much faster than WT, while WT-5FW aggregated more slowly than WT (Fig. 4).
Figure 4.

Aggregation kinetics of TTR variants monitored by optical density at 330 nm (OD330) at 310 K. WT-6FW aggregates faster than WT-5FW. The error bars represent one standard deviation from three independent measurements.
19F-NMR assignment of folded and unfolded TTR
The relative stability of the substituted TTRs was investigated by measuring the 19F-NMR spectra of WT-5FW and WT-6FW. Two well-resolved 19F resonances are observed for each sample and could be assigned using the W41Y mutant, for both folded and urea-unfolded TTR (Fig. 5). The perturbation caused by the W41Y mutation is minimal; chemical shift changes in the 1H,15N-heteronuclear single quantum coherence (HSQC) spectra are small and are localized to residues in the nearby BC loop and its immediate environment (Fig. S4). No changes in the 19F chemical shifts for W79 were observed between the spectra of the W41Y and WT-5FW and WT-6FW samples (Fig. 5). Diffusion-ordered NMR experiments with 15N-labeled WT-5FW and WT-6FW at 100 μM concentration showed that both are present as the tetramer (Table S3). The relatively broad 19F resonances of the folded proteins are consistent with tetramer formation, and the observation of only two peaks in the 19F NMR spectra indicates that the structure is symmetric in solution.
Figure 5.

19F-NMR spectra of WT-5FW and W41Y-5FW in NMR buffer and 6 M urea (A), and WT-6FW and W41Y-6FW in NMR buffer and 6 M urea (B). A trace amount of free 6FW and 5FW was used as an internal standard for referencing in (A) and (B), respectively. The intensity is normalized to the highest peak. Base lines are offset for clarity. As a control, identical 19F chemical shifts were observed with and without addition of the reference compound (5FW and 6FW, Fig. S5).
Literature reports58, 59 indicate that a downfield shift usually signifies a more buried 19F probe. Figure 5B shows that both peaks in the WT-6FW spectrum are downfield shifted (6F-W41: −118.3 ppm, 6F-W79: −117.8 ppm) relative to free 6-fluorotryptophan (−121.6 ppm, shown as a reference in Fig. 5A). By contrast, the two peaks in the WT-5FW spectrum (Fig. 5A) move in opposite directions from free 5-fluorotryptophan (−124.8 ppm, shown as a reference in Fig. 5B): the 5F-W41 resonance moves downfield (−119.0 ppm) and the 5F-W79 peak shifts slightly upfield (−125.3 ppm). These chemical shifts can be rationalized based on the local environments of the Trp residues in the TTR tetramer: the downfield chemical shift changes for 5F-W41 and both peaks in WT-6FW are due to the burial of the 19F-probes in these locations (Fig. 3A, C, D), whereas the upfield shift of the 5F-W79 resonance is due to the fact that although the indole of W79 is almost completely buried, the 5-position is solvent accessible (Fig. 3B). Our 19F-NMR measurements clearly reveal atomic-level detail on the local environment of the Trp residues in TTR. As a control, 19F-NMR spectra recorded with and without addition of the reference compound (5FW and 6FW) showed identical chemical shifts (Fig. S5).
When TTR is unfolded by urea, both peaks in WT-6FW and the 5F-W41 peak in WT-5FW move upfield by 4–5 ppm, indicating greater solvent accessibility. The 5F-W79 chemical shift difference between folded and unfolded states is only 0.5 ppm, confirming its high solvent accessibility in the folded state (Fig. 5). For both 5FW and 6FW probes, the 19F chemical shifts of W79 and W41 differ only slightly (by 0.1 ppm) in the spectra of the unfolded protein.
19F relaxation in the TTR tetramer
Measurement of the T1 time constants of the 19F resonances gives insights into the oligomeric state. Measured T1 time constants and 19F linewidths for the 5FW and 6FW probes in both folded and unfolded TTR are shown in Table S2. For folded tetrameric TTR, the predicted T1 for 5FW or 6FW under isotropic tumbling conditions is 1.2–1.4 s, which is consistent with the experimental results (Table S2). The predicted line width (~70 Hz) in the absence of chemical exchange, however, is less than that observed (>100 Hz). Similar findings have been reported for the cyan fluorescent protein.19
The 19F-T1 values for unfolded TTR in the presence of 6 M urea decrease to ~0.7 s at 14.1 T and the linewidths are much narrower (~30 Hz, Table S2) than those of folded TTR for both 5FW and 6FW probes, consistent with a decrease in the rotational correlation time after unfolding. T1 for the unfolded monomer is predicted to be 0.6–0.7 s at 14.1 T and 298 K with a line width around 30 Hz, in agreement with the experimental results (Table S2). The measured T1 values, together with the diffusion coefficients shown in Table S3, are consistent with the presence of tetrameric TTR in the folded state and monomer in the unfolded state.
Urea-induced unfolding monitored by 19F-Trp probes at two sites
NMR measurements are normally too slow to measure protein folding and unfolding transitions. However, tetrameric TTR is unfolded by urea on a slow (~ hours) time scale, which makes this system ideal for monitoring the unfolding reaction by real-time NMR. Tetrameric WT-5FW and WT-6FW TTR were unfolded by the addition of urea, and the unfolding kinetics were monitored by measuring the changes in 19F peak areas belonging to the folded and unfolded protein as a function of time (Fig. 6A, B). The data were fitted to single exponential functions (Fig. 6C, D). Corrections were made for the ~5–15 min dead time associated with pipetting, matching/tuning and shimming the probe. The incubation time with urea was limited to 4 days as previously reported for TTR.15 At a time resolution of 1 hr, the two Trp residues (41 and 79) report the same unfolding rates (~0.02 hr−1 for WT-5FW and ~0.14 hr−1 for WT-6FW). The reported unfolding kinetics of WT-TTR by 6 M urea at 298K measured by Trp fluorescence is 0.031 hr−1,14 which is slightly greater than that for WT-5FW and smaller than that for WT-6FW. This ranking is fully consistent with the relative aggregation propensity for these three constructs (Fig. 4).
Figure 6.

Time-dependent changes in 19F peak intensity during unfolding of WT-5FW (A) and WT-6FW (B) in 6 M urea. Each spectrum was recorded for one hour and the spectra are displayed in chronological order colored from blue to red. (C, D). Unfolding kinetics quantified by peak areas for unfolded W41 and W79 resonances. C. WT-5FW. Open red circles: 5F-W41 (unfolding rate 0.02 ± 0.001 hr−1); filled red circles: 5F-W79 (unfolding rate 0.02 ± 0.001 hr−1); black crosses: 6FW internal standard. D. WT-6FW. Open blue circles: 6F-W41 (unfolding rate 0.14 ± 0.004 hr−1); filled blue circles: 6F-W79 (unfolding rate 0.14 ± 0.004 hr−1); black crosses: 5FW internal standard. Single exponential fits are shown in black. In both labeled samples, the unfolding rates reported by W41 and W79 are indistinguishable. Uncertainties calculated as one standard deviation from 50 bootstrapped datasets. For reference, the peak areas for the internal standards remain constant during the measurements.
Structural perturbations probed by backbone amide chemical shifts
The different behavior of WT-5FW and WT-6FW proteins was further analyzed by measuring the backbone amide chemical shift perturbation (CSP) between the fluoro-Trp substituted proteins and WT-TTR using 1H-15N HSQC (Fig. S6). A plot of the CSP according to the amino acid sequence is shown in Figure 7A and B. The residues that display significant CSP (greater than one or two standard deviations) are mapped on the modeled structures of WT-5FW and WT-6FW in Figure 8A and B. The chemical shift perturbations caused by 5F-W41 and 5F-W79 substitution are localized to the immediate environment of the tryptophans, especially W41. In contrast, the chemical shift perturbations caused by 6FW substitution of both tryptophans are more widely spread through the protein structure, with large changes in chemical shift for residues near W79. Considering that the mutation of W79, not W41, destabilizes the tetrameric TTR,9 we hypothesized that the 6F-W79 substitution is responsible for the more extensive structural perturbations in WT-6FW. The W41Y mutant was used to test this hypothesis. Comparison of the 1H-15N HSQC spectra of W41Y and W41Y-6F-W79 shows that the 6-fluoro atom on W79 causes large chemical shift perturbations for residues in the AB loop, EF loop, and H strand (Fig. 7C, 8C,D, Fig. S4). Labeling W41Y with 6FW rendered it more aggregation-prone (Fig. S7), suggesting a correlation between structural changes in these regions and TTR aggregation propensity.
Figure 7.

Backbone amide chemical shift comparisons of WT-5FW and WT-6FW. (A, B) Weighted average backbone amide CSP comparison for WT-5FW (A) and WT-6FW (B) with WT. (C) The CSP comparison for W41Y-6FW with W41Y. The dashed lines denote one or two standard deviations. Letter a denotes ambiguous CSP, x for missing peaks and p for proline residues. Two Trp residues at 41 and 79 and secondary structures are labeled on top of figure.
Figure 8.

CSP perturbations mapped on TTR structure. Residues with weighted average 1H, 15N CSP larger than one or two standard deviations (σ, from Figure 7) close to W79 (magenta > 2σ; pink > 1σ, A, B, C) and or to W41 (deep teal > 2σ; pale cyan > 1σ, A, B) and are mapped onto the modeled 1BMZ-based structures of WT-5FW (A) and WT-6FW (B, C) in Cα sphere presentation, respectively. TTR tetramer is colored in light gray and residues 41 and 79 are showed as green and orange spheres, respectively. The fluorine atom is colored in red at 5- in (A) and 6-position in (B, C), respectively. (D) Close-up of the central hydrophobic cavity in (C) with perturbed residues by the 6F-W79 substituent.
Discussion
Much of our information on the stability and folding of TTR comes from intrinsic Trp fluorescence measurements in the absence and presence of denaturants.14, 60 In this work, we complement the Trp fluorescence measurements with 19F-NMR by using two commercially available fluoro-Trp probes (5FW and 6FW). The urea denaturation of TTR tetramer over hours or days to yield unfolded TTR monomer can be readily followed by monitoring the 19F-NMR signals in real time. Since the unfolding of the TTR monomer is 5–6 orders of magnitude faster than the TTR tetramer,14, 15, 61 no unfolding intermediate could be identified in the 19F-NMR unfolding assays under our experimental conditions. By comparing 19F-NMR urea unfolding experiments and turbidity aggregation assays, we were able to show that the 19F-labels can reliably report on the relative kinetic stabilities of TTR variants. In addition, 19F-NMR offers an advantage by providing site-specific information on structure and stability. Two well-resolved 19F resonances were observed for W41 and W79 using either the 5FW or 6FW probe with distinct site-dependent solvent accessibilities. By contrast, such residue-specific information is absent in Trp fluorescence measurements. The intrinsic Trp emission is very broad at room temperature in aqueous solutions, which, without mutagenesis, prevents deconvolution of each contributing Trp spectrum.16 For 19F-NMR with fluorinated Trp, not only are the resonances of the individual Trp residues in folded TTR well separated, but they are also dispersed in the unfolded state, allowing direct quantification of the relative populations of the unfolded and folded states, without the need for small-molecule probes such as resveratrol14 or stilbene vinyl sulfonamide.62 The 19F-probes at residues 41 and 79 report nearly identical unfolding kinetics, indicating cooperative global unfolding of the TTR tetramer at the time resolution of 1hr reported in this work.
19F-NMR can also probe position-dependent structural properties for each Trp site in TTR. For W41, the ~3–6ppm downfield shift of the 19F resonances relative to the corresponding free compounds suggests that both the 5- and 6- positions of the indole are buried within the structure of the TTR tetramer. On the other hand, the 5- and 6-positions on the indole at residue 79 have very different local environments within the TTR tetramer that result in distinct chemical shift changes relative to free 5FW and 6FW (Fig. 5): although the bulk of the W79 side chain is buried in both proteins, the fluorine atom at the 6-position is buried whereas that in the 5-position is solvent-exposed (Fig. 3B, D). By comparison, the fluorescence emission spectra are nearly indistinguishable for W41Y-5FW/W41Y-6FW and WT-5FW/WT-6FW (compare Fig. 2C with Fig. 2D). This is because the dipole moment is an electronic property of the whole indole π-electron system; therefore the position-dependent solvent accessibility at 5- or 6-position on the substituted indole does not play a critical role in differentiating the corresponding emission spectra in TTR, but such solvent accessibility or chemical environmental difference among 19F nuclei is clearly distinguishable by 19F-NMR.
Interestingly, we noted an unexpected stability difference between WT-5FW and WT-6FW TTR, in which both Trp residues were substituted. As shown by turbidity and 19F-NMR unfolding assays, the WT-5FW tetramer is kinetically more stable than WT-6FW. The increased aggregation propensity appears to be correlated with fluorotryptophan incorporation at W79. Previous studies have shown that in contrast to the W41F mutation, which has little effect on tetramer stability, the W79F mutation greatly destabilizes the TTR tetramer.9 This is consistent with the aggregation propensities measured here; W41Y TTR exhibits similar aggregation properties to WT TTR, whereas substitution of 6F-Trp at position 79 of the W41Y mutant greatly increases its aggregation propensity (Fig. S7). Notably, the effects of fluorotryptophan substitution on TTR aggregation depend on the site of fluorine incorporation in the W79 indole ring, with 6F-W79 promoting aggregation while 5F-W79 does not. We suggest that structural rearrangements required to accommodate 6F-W79 may be linked to the reduced kinetic stability in WT-6FW, whereas the 5F-W79 substitution can be more readily accommodated since it is solvent-exposed (Fig. 3B).
The structural perturbations caused by the fluorotryptophan substitutions were probed using 1H-15N HSQC spectra. The 5F and 6F substitutions on W41 appear to cause only localized structural perturbations in the immediate vicinity of the tryptophan ring. The changes in the 1H-15N HSQC spectra caused by the W41Y mutation and the 5F-W41 substitution are similar and are localized to residues located in the BC loop or in contact with it (Fig. 7A, Fig. S4). Turbidity assays show that the localized structural perturbations detected by NMR do not lead to tetramer destabilization or enhanced aggregation (Fig. 4, Fig. S7).
To probe the structural perturbations caused by 6F-W79 substitution, chemical shift differences between the 1H-15N HSQC spectra of the W41Y mutant and W41Y-6F-W79 were evaluated (Fig. 7C, Fig. 8C,D). Large chemical shift perturbations are observed for residues in the AB loop, H88, and S117, with smaller changes in the EF region near W79. Similar shift perturbations are observed in the HSQC spectrum of WT-6FW (where both W41 and W79 are substituted by 6FW) relative to that of the WT protein, with additional shift changes for residues located close to W41. The chemical shift changes in the AB loop, which forms part of the weak dimer interface, most likely reflect subtle structural perturbations that arise from steric clash between the 6-fluoro atom on W79 and the side chains of D18 and R21 (Fig. 9A). The perturbations appear to propagate from the AB loop across the DAGH β-sheet to S117 in the H strand, which forms part of the strong dimer interface (Fig. 9B).63, 64 Alternatively, the 6F atom could potentially hydrogen bond to V20NH based on their proximity in the modeled structure (Fig. 9A). However, this mechanism is less likely given that fluorine is a very weak hydrogen bond acceptor.65 These structural perturbations associated with 6-fluoro substitution at W79 are more extensive than those arising from 5FW labeling, and led to destabilization of the TTR tetramer and enhanced aggregation.
Figure 9.

Close-up of structural perturbations caused by fluoro-Trp labeling. (A) Possible perturbations of V20NH and side chains of D18 and R21 by 6F-W79 in the modeled WT-6FW structure. (B) Water-mediated hydrogen bond network around W79 and H88. The ND1 atom in the side chain of H88 is connected to the ε amide in the indole ring of W79 via two waters. The NE2 in H88 also forms a water-mediated hydrogen bond with the OG1 in T118 from a neighboring protomer across the strong dimer interface (PDB ID: 3U2J from Yokoyama et al.63). S117 next to T118 is perturbed by 6F-W79.
The structural perturbations in the AB loop caused by substitution of W79 by 6F-W79 are likely to be quite subtle, given that the radius of the fluorine atom is only 0.3 Å larger than the hydrogen it replaces. Nevertheless, the changes are sufficient to perturb the subunit packing across the weak dimer interface, destabilize the tetramer, and increase the propensity for aggregation. It is noteworthy that many of the chemical shift perturbations observed for WT-6FW involve residues that are linked to TTR pathogenic mutations. The AB loop, which forms part of the weak dimer interface, contains pathogenic variants of D18G, A19D, V20I, S23N, P24S A25T and V28M.2, 66 Among these mutants, D18G and A25T are highly unstable and aggregation-prone.60, 61 The observed chemical shift changes also suggest that the AB loop perturbations may propagate across the DAGH β-sheet to A109, L110 and V71, and thence to S117 in the strong dimer interface (Fig. 8B, C, D). Alternatively, perturbations of the AB loop could propagate to H88. The 6F-W79 substitution also appears to perturb a water-bridged hydrogen bond network involving H8863, 64 (Fig. 9B), which has been suggested to play a role in stabilizing tetrameric TTR and may serve as a structural basis for pH-dependent conformational changes.63, 67 Notably, four of these perturbed distal sites (V71, H88, A109 and S117) are associated with pathogenic TTR variants.68–70 In addition, mutations of residues L111, S112, P113, and Y114 in the GH loop, which packs against the W79 indole ring and contacts the AB loop to form part of the weak dimer interface, are also pathogenic.2, 71
In summary, we have introduced two convenient 19F probes of 5FW and 6FW at two distinct sites (W41 and W79) in the TTR tetramer. 19F-NMR affords the direct observation of residue-level and position-resolved magnetization signals in both folded and unfolded states of TTR, and reveals urea-mediated unfolding kinetics that is well correlated with the acid-mediated aggregation. We anticipate that the 19F-NMR approaches reported here will be generally applicable to assorted TTR pathogenic mutants to provide valuable and quantitative insights into their relative stabilities and to probe the fibrillization process, where the site-dependent changes are expected to be critical.
Supplementary Material
Acknowledgments
We thank Gerard Kroon for expert assistance in NMR experiments, Euvel Manlapaz for technical support, Ke Yang for assistance in ESI-MS, Bryn Fenwick for suggestions on computational modeling, and Ben Leach for providing expression/purification protocols and backbone amide assignments of WT-TTR.
Funding Sources
This work was supported by National Institutes of Health Grant DK34909 (P.E.W.), the Skaggs Institute for Chemical Biology, and by American Heart Association Grant #17POST32810003 (X.S.).
Footnotes
Three tables containing validation of protein constructs by mass spectrometry, longitudinal relaxation times and translational diffusion coefficients for TTR samples, together with 7 figures showing size exclusion profiles, UV absorbance, fluorescence and circular dichroism spectra for labeled TTR, a comparison of 19F NMR spectra of labeled TTR in the presence and absence of internal reference, a series of 1H-15N HSQC spectra overlaid to show differences arising from mutagenesis and fluorine labeling, and a comparison of the aggregation of mutant and fluorine labeled TTR.
References
- 1.Knowles TPJ, Vendruscolo M, Dobson CM. The amyloid state and its association with protein misfolding diseases. Nat Rev Mol Cell Biol. 2014;15:384–396. doi: 10.1038/nrm3810. [DOI] [PubMed] [Google Scholar]
- 2.Connors LH, Lim A, Prokaeva T, Roskens VA, Costello CE. Tabulation of human transthyretin (TTR) variants, 2003. Amyloid Int J Exp Clin Invest. 2003;10:160–184. doi: 10.3109/13506120308998998. [DOI] [PubMed] [Google Scholar]
- 3.Monaco HL, Rizzi M, Coda A. Structure of a complex of two plasma proteins: transthyretin and retinol-binding protein. Science. 1995;268:1039–1041. doi: 10.1126/science.7754382. [DOI] [PubMed] [Google Scholar]
- 4.Hamilton JA, Benson MD. Transthyretin: a review from a structural perspective. Cell Mol Life Sci. 2001;58:1491–1521. doi: 10.1007/PL00000791. [DOI] [PMC free article] [PubMed] [Google Scholar]
- 5.Westermark P, Sletten K, Johansson B, Cornwell GG., III Fibril in senile systemic amyloidosis is derived from normal transthyretin. Proc Natl Acad Sci USA. 1990;87:2843–2845. doi: 10.1073/pnas.87.7.2843. [DOI] [PMC free article] [PubMed] [Google Scholar]
- 6.Sekijima Y. Recent progress in the understanding and treatment of transthyretin amyloidosis. J Clin Pharm Ther. 2014;39:225–233. doi: 10.1111/jcpt.12145. [DOI] [PubMed] [Google Scholar]
- 7.Ruberg FL, Berk JL. Transthyretin (TTR) cardiac amyloidosis. Circulation. 2012;126:1286–1300. doi: 10.1161/CIRCULATIONAHA.111.078915. [DOI] [PMC free article] [PubMed] [Google Scholar]
- 8.Palaninathan SK. Nearly 200 X-ray crystal structures of transthyretin: what do they tell us about this protein and the design of drugs for TTR amyloidoses? Curr Med Chem. 2012;19:2324–2342. doi: 10.2174/092986712800269335. [DOI] [PubMed] [Google Scholar]
- 9.Lai Z, Colon W, Kelly JW. The acid-mediated denaturation pathway of transthyretin yields a conformational intermediate that can self-assemble into amyloid. Biochemistry. 1996;35:6470–6482. doi: 10.1021/bi952501g. [DOI] [PubMed] [Google Scholar]
- 10.Colon W, Kelly JW. Partial denaturation of transthyretin is sufficient for amyloid fibril formation in vitro. Biochemistry. 1992;31:8654–8660. doi: 10.1021/bi00151a036. [DOI] [PubMed] [Google Scholar]
- 11.Quintas A, Vaz DC, Cardoso I, Saraiva MJ, Brito RM. Tetramer dissociation and monomer partial unfolding precedes protofibril formation in amyloidogenic transthyretin variants. J Biol Chem. 2001;276:27207–27213. doi: 10.1074/jbc.M101024200. [DOI] [PubMed] [Google Scholar]
- 12.Lim KH, Dyson HJ, Kelly JW, Wright PE. Localized structural fluctuations promote amyloidogenic conformations in transthyretin. J Mol Biol. 2013;425:977–988. doi: 10.1016/j.jmb.2013.01.008. [DOI] [PMC free article] [PubMed] [Google Scholar]
- 13.Hurshman AR, White JT, Powers ET, Kelly JW. Transthyretin Aggregation under Partially Denaturing Conditions Is a Downhill Polymerization. Biochemistry. 2004;43:7365–7381. doi: 10.1021/bi049621l. [DOI] [PubMed] [Google Scholar]
- 14.Hammarström P, Jiang X, Hurshman AR, Powers ET, Kelly JW. Sequence-dependent denaturation energetics: A major determinant in amyloid disease diversity. Proc Natl Acad Sci USA. 2002;99(Suppl 4):16427–16432. doi: 10.1073/pnas.202495199. [DOI] [PMC free article] [PubMed] [Google Scholar]
- 15.Jiang X, Smith CS, Petrassi HM, Hammarström P, White JT, Sacchettini JC, Kelly JW. An engineered transthyretin monomer that is nonamyloidogenic, unless it is partially denatured. Biochemistry. 2001;40:11442–11452. doi: 10.1021/bi011194d. [DOI] [PubMed] [Google Scholar]
- 16.Lakowicz JR. Principles of Fluorescence Spectroscopy. 2. Kluwer Academic/Plenum Publishers; New York: 1999. [Google Scholar]
- 17.Gerig JT. Fluorine NMR of Proteins. Pergamon Press; 1994. [Google Scholar]
- 18.Ye L, Van Eps N, Zimmer M, Ernst OP, Prosser RS. Activation of the A2A adenosine G-protein-coupled receptor by conformational selection. Nature. 2016;533:265–268. doi: 10.1038/nature17668. [DOI] [PubMed] [Google Scholar]
- 19.Seifert MHJ, Ksiazek D, Azim MK, Smialowski P, Budisa N, Holak TA. Slow exchange in the chromophore of a green fluorescent protein variant. J Am Chem Soc. 2002;124:7932–7942. doi: 10.1021/ja0257725. [DOI] [PubMed] [Google Scholar]
- 20.Liu JJ, Horst R, Katritch V, Stevens RC, Wuthrich K. Biased signaling pathways in beta2-adrenergic receptor characterized by 19F-NMR. Science. 2012;335:1106–1110. doi: 10.1126/science.1215802. [DOI] [PMC free article] [PubMed] [Google Scholar]
- 21.Bann JG, Pinkner J, Hultgren SJ, Frieden C. Real-time and equilibrium 19F-NMR studies reveal the role of domain-domain interactions in the folding of the chaperone PapD. Proc Natl Acad Sci USA. 2002;99:709–714. doi: 10.1073/pnas.022649599. [DOI] [PMC free article] [PubMed] [Google Scholar]
- 22.Schrödinger, LLC. The PyMOL molecular graphics system, version 1.8.2.3. 2017. [Google Scholar]
- 23.Khan F, Kuprov I, Craggs TD, Hore PJ, Jackson SE. 19F NMR studies of the native and denatured states of green fluorescent protein. J Am Chem Soc. 2006;128:10729–10737. doi: 10.1021/ja060618u. [DOI] [PubMed] [Google Scholar]
- 24.Press WH, Teukolsky SA, Vetterling WT, Flannery BP. Numerical Recipes 3rd Edition: The Art of Scientific Computing. Cambridge University Press; 2007. [Google Scholar]
- 25.Efron B. 1977 Rietz lecture—bootstrap methods—another look at the jackknife. Ann Stat. 1979;7:1–26. [Google Scholar]
- 26.Horst R, Horwich AL, Wüthrich K. Translational diffusion of macromolecular assemblies measured using transverse-relaxation-optimized pulsed field gradient NMR. J Am Chem Soc. 2011;133:16354–16357. doi: 10.1021/ja206531c. [DOI] [PMC free article] [PubMed] [Google Scholar]
- 27.Delaglio F, Grzesiek S, Vuister GW, Guang Z, Pfeifer J, Bax A. NMRPipe: a multidimensional spectral processing system based on UNIX pipes. J Biomol NMR. 1995;6:277–293. doi: 10.1007/BF00197809. [DOI] [PubMed] [Google Scholar]
- 28.Bhabha G, Ekiert DC, Jennewein M, Zmasek CM, Tuttle LM, Kroon G, Dyson HJ, Godzik A, Wilson IA, Wright PE. Divergent evolution of enzyme dynamics in dihydrofolate reductase. Nat Struct Mol Biol. 2013;20:1243–1249. doi: 10.1038/nsmb.2676. [DOI] [PMC free article] [PubMed] [Google Scholar]
- 29.Cavanagh J, Fairbrother WJ, Palmer AG, III, Rance M, Skelton NJ. Protein NMR Spectroscopy: Principles and Practice. 2. Elsevier Academic Press; Burlington MA: 2007. [Google Scholar]
- 30.Hull WE, Sykes BD. Fluorotyrosine alkaline phosphatase: Internal mobility of individual tyrosines and role of chemical shift anisotropy as a F-19 nuclear spin relaxation mechanism in proteins. J Mol Biol. 1975;98:121–153. doi: 10.1016/s0022-2836(75)80105-7. [DOI] [PubMed] [Google Scholar]
- 31.Luck LA, Vance JE, O’Connell TM, London RE. 19F NMR relaxation studies on 5-fluorotryptophan- and tetradeutero-5-fluorotryptophan-labeled E. coli glucose/galactose receptor. J Biomol NMR. 1996;7:261–272. doi: 10.1007/BF00200428. [DOI] [PubMed] [Google Scholar]
- 32.Sarker M, Orrell KE, Xu L, Tremblay ML, Bak JJ, Liu XQ, Rainey JK. Tracking transitions in spider wrapping silk conformation and dynamics by 19F nuclear magnetic resonance spectroscopy. Biochemistry. 2016;55:3048–3059. doi: 10.1021/acs.biochem.6b00429. [DOI] [PMC free article] [PubMed] [Google Scholar]
- 33.Abragam A. Principles of Nuclear Magnetism. Clarendon Press; Oxford: 1961. [Google Scholar]
- 34.Durr UH, Grage SL, Witter R, Ulrich AS. Solid state 19F NMR parameters of fluorine-labeled amino acids. Part I: aromatic substituents. J Magn Reson. 2008;191:7–5. doi: 10.1016/j.jmr.2007.11.017. [DOI] [PubMed] [Google Scholar]
- 35.Lipari G, Szabo A. Model-free approach to the interpretation of nuclear magnetic resonance relaxation in macromolecules. 1 Theory and range of validity. J Am Chem Soc. 1982;104:4546–4559. [Google Scholar]
- 36.Lipari G, Szabo A. Model-free approach to the interpretation of nuclear magnetic resonance relaxation in macromolecules. 2 Analysis of experimental results. J Am Chem Soc. 1982;104:4559–4570. [Google Scholar]
- 37.Cho CH, Urquidi J, Singh S, Robinson GW. Thermal offset viscosities of liquid H2O, D2O, and T2O. J Phys Chem B. 1999;103:1991–1994. [Google Scholar]
- 38.Kawahara K, Tanford C. Viscosity and density of aqueous solutions of urea and guanidine hydrochloride. J Biol Chem. 1966;241:3228–3232. [PubMed] [Google Scholar]
- 39.Peterson SA, Klabunde T, Lashuel HA, Purkey H, Sacchettini JC, Kelly JW. Inhibiting transthyretin conformational changes that lead to amyloid fibril formation. Proc Natl Acad Sci USA. 1998;95:12956–12960. doi: 10.1073/pnas.95.22.12956. [DOI] [PMC free article] [PubMed] [Google Scholar]
- 40.Hörnberg A, Eneqvist T, Olofsson A, Lundgren E, Sauer-Eriksson AE. A comparative analysis of 23 structures of the amyloidogenic protein transthyretin. J Mol Biol. 2000;302:649–669. doi: 10.1006/jmbi.2000.4078. [DOI] [PubMed] [Google Scholar]
- 41.Jakalian A, Bush BL, Jack DB, Bayly CI. Fast, efficient generation of high-quality atomic Charges. AM1-BCC model: I Method. J Comput Chem. 2000;21:132–146. doi: 10.1002/jcc.10128. [DOI] [PubMed] [Google Scholar]
- 42.Jakalian A, Jack DB, Bayly CI. Fast, efficient generation of high-quality atomic charges. AM1-BCC model: II Parameterization and validation. J Comput Chem. 2002;23:1623–1641. doi: 10.1002/jcc.10128. [DOI] [PubMed] [Google Scholar]
- 43.Price DJ, Brooks CL., 3rd A modified TIP3P water potential for simulation with Ewald summation. J Chem Phys. 2004;121:10096–10103. doi: 10.1063/1.1808117. [DOI] [PubMed] [Google Scholar]
- 44.Case DA, Darden TA, Cheatham TE, Simmerling CL, Wang J, Duke RE, Luo R, Walker RC, Zhang W, Merz KM, Roberts B, Hayik S, Roitberg A, Seabra G, Swails J, Goetz AW, Kolossváry I, Wong KF, Paesani F, Vanicek J, Wolf RM, Liu J, Wu X, Brozell SR, Steinbrecher T, Gohlke H, Cai Q, Ye X, Wang J, Hsieh MJ, Cui G, Roe DR, Mathews DH, Seetin MG, Salomon-Ferrer R, Sagui C, Babin V, Luchko T, Gusarov S, Kovalenko A, Kollman PA. AMBER 12. University of California; San Francisco: 2012. [Google Scholar]
- 45.Darden T, York D, Pedersen L. Particle mesh Ewald: An N·log(N) method for Ewald sums in large systems. J Chem Phys. 1993;98:10089–10092. [Google Scholar]
- 46.Fraczkiewicz R, Braun W. Exact and efficient analytical calculation of the accessible surface areas and their gradients for macromolecules. J Comput Chem. 1998;19:319–333. [Google Scholar]
- 47.Batsanov S. Van der Waals radii of elements. Inorg Mat. 2001;37:871–885. [Google Scholar]
- 48.Valeur B, Weber G. Resolution of the fluorescence excitation spectrum of indole into the 1La and 1Lb excitation bands. Photochem Photobiol. 1977;25:441–444. doi: 10.1111/j.1751-1097.1977.tb09168.x. [DOI] [PubMed] [Google Scholar]
- 49.Pfefferkorn CM, Lee JC. 5-Fluoro-D,L-tryptophan as a dual NMR and fluorescent probe of α-synuclein. In: Uversky VN, Dunker AK, editors. Intrinsically Disordered Protein Analysis: Volume 1, Methods and Experimental Tools. Humana Press; Totowa, NJ: 2012. pp. 197–209. [DOI] [PMC free article] [PubMed] [Google Scholar]
- 50.Liu T, Callis PR, Hesp BH, de Groot M, Buma WJ, Broos J. Ionization potentials of fluoroindoles and the origin of nonexponential tryptophan fluorescence decay in proteins. J Am Chem Soc. 2005;127:4104–4113. doi: 10.1021/ja043154d. [DOI] [PubMed] [Google Scholar]
- 51.McCaul CP, Ludescher RD. Room temperature phosphorescence from tryptophan and halogenated tryptophan analogs in amorphous sucrose. Photochem Photobiol. 1999;70:166–171. [Google Scholar]
- 52.Eftink MR, Selvidge LA, Callis PR, Rehms AA. Photophysics of indole derivatives: experimental resolution of La and Lb transitions and comparison with theory. J Phys Chem. 1990;94:3469–3479. [Google Scholar]
- 53.Weiler-Feilchenfeld H, Pullman A, Berthod H, Giessner-Prettre C. Experimental and quantum-chemical studies of the dipole moments of quinoline and indole. J Mol Structure. 1970;6:297–304. [Google Scholar]
- 54.Cotten M, Tian C, Busath DD, Shirts RB, Cross TA. Modulating dipoles for structure-function correlations in the gramicidin A channel. Biochemistry. 1999;38:9185–9197. doi: 10.1021/bi982981m. [DOI] [PubMed] [Google Scholar]
- 55.Meng X, Harricharran T, Juszczak LJ. A spectroscopic survey of substituted indoles reveals consequences of a stabilized 1Lb transition. Photochem Photobiol. 2013;89:40–50. doi: 10.1111/j.1751-1097.2012.01219.x. [DOI] [PMC free article] [PubMed] [Google Scholar]
- 56.Visser NV, Westphal AH, Nabuurs SM, van Hoek A, van Mierlo CPM, Visser AJWG, Broos J, van Amerongen H. 5-Fluorotryptophan as dual probe for ground-state heterogeneity and excited-state dynamics in apoflavodoxin. FEBS Lett. 2009;583:2785–2788. doi: 10.1016/j.febslet.2009.07.022. [DOI] [PubMed] [Google Scholar]
- 57.Chadegani F, Lovell S, Mullangi V, Miyagi M, Battaile KP, Bann JG. 19F nuclear magnetic resonance and crystallographic studies of 5-fluorotryptophan-labeled anthrax protective antigen and effects of the receptor on stability. Biochemistry. 2014;53:690–701. doi: 10.1021/bi401405s. [DOI] [PMC free article] [PubMed] [Google Scholar]
- 58.Abbott GL, Blouse GE, Perron MJ, Shore JD, Luck LA, Szabo AG. 19F NMR studies of plasminogen activator inhibitor-1. Biochemistry. 2004;43:1507–1519. doi: 10.1021/bi035618a. [DOI] [PubMed] [Google Scholar]
- 59.Robertson DE, Kroon PA, Ho C. Nuclear magnetic resonance and fluorescence studies of substrate-induced conformational changes of histidine-binding protein J of Salmonella typhimurium. Biochemistry. 1977;16:1443–1451. doi: 10.1021/bi00626a032. [DOI] [PubMed] [Google Scholar]
- 60.Sekijima Y, Wiseman RL, Matteson J, Hammarström P, Miller SR, Sawkar AR, Balch WE, Kelly JW. The biological and chemical basis for tissue-selective amyloid disease. Cell. 2005;121:73–85. doi: 10.1016/j.cell.2005.01.018. [DOI] [PubMed] [Google Scholar]
- 61.Hammarström P, Wiseman RL, Powers ET, Kelly JW. Prevention of transthyretin amyloid disease by changing protein misfolding energetics. Science. 2003;299:713–716. doi: 10.1126/science.1079589. [DOI] [PubMed] [Google Scholar]
- 62.Suh EH, Liu Y, Connelly S, Genereux JC, Wilson IA, Kelly JW. Stilbene vinyl sulfonamides as fluorogenic sensors of and traceless covalent kinetic stabilizers of transthyretin that prevent amyloidogenesis. J Am Chem Soc. 2013;135:17869–17880. doi: 10.1021/ja408230k. [DOI] [PMC free article] [PubMed] [Google Scholar]
- 63.Yokoyama T, Mizuguchi M, Nabeshima Y, Kusaka K, Yamada T, Hosoya T, Ohhara T, Kurihara K, Tomoyori K, Tanaka I, Niimura N. Hydrogen-bond network and pH sensitivity in transthyretin: Neutron crystal structure of human transthyretin. J Struct Biol. 2012;177:283–290. doi: 10.1016/j.jsb.2011.12.022. [DOI] [PubMed] [Google Scholar]
- 64.Banerjee A, Dasgupta S, Mukhopadhyay BP, Sekar K. The putative role of some conserved water molecules in the structure and function of human transthyretin. Acta Cryst D. 2015;71:2248–2266. doi: 10.1107/S1399004715016004. [DOI] [PubMed] [Google Scholar]
- 65.Dalvit C, Vulpetti A. Weak intermolecular hydrogen bonds with fluorine: detection and implications for enzymatic/chemical reactions, chemical properties, and ligand/protein fluorine NMR screening. Chemistry. 2016;22:7592–7601. doi: 10.1002/chem.201600446. [DOI] [PubMed] [Google Scholar]
- 66.Ferreira P, Sant’Anna R, Varejao N, Lima C, Novis S, Barbosa RV, Caldeira CM, Rumjanek FD, Ventura S, Cruz MW, Foguel D. Structure-based analysis of A19D, a variant of transthyretin involved in familial amyloid cardiomyopathy. PLoS ONE. 2013;8:e82484. doi: 10.1371/journal.pone.0082484. [DOI] [PMC free article] [PubMed] [Google Scholar]
- 67.Yokoyama T, Hanawa Y, Obita T, Mizuguchi M. Stability and crystal structures of His88 mutant human transthyretins. FEBS Lett. 2017 doi: 10.1002/1873-3468.12704. [DOI] [PubMed] [Google Scholar]
- 68.Date Y, Nakazato M, Kangawa K, Shirieda K, Fujimoto T, Matsukura S. Detection of three transthyretin gene mutations in familial amyloidotic polyneuropathy by analysis of DNA extracted from formalin-fixed and paraffin-embedded tissues. J Neurol Sci. 1997;150:143–148. doi: 10.1016/s0022-510x(97)00077-4. [DOI] [PubMed] [Google Scholar]
- 69.Haagsma EB, Scheffer H, Altland K, De Jager AE, Hazenberg BP. Transthyretin Val71Ala mutation in a Dutch family with familial amyloidotic polyneuropathy. Amyloid Int J Exp Clin Invest. 2000;7:218–221. doi: 10.3109/13506120009146837. [DOI] [PubMed] [Google Scholar]
- 70.Chen Q, Yuan L, Deng X, Yang Z, Zhang S, Deng S, Lu H, Deng H. A missense variant p.Ala117Ser in the transthyretin gene of a Han chinese family with familial amyloid polyneuropathy. Mol Neurobiol. 2017 doi: 10.1007/S12035-017-0694-0. [DOI] [PubMed] [Google Scholar]
- 71.Mizuguchi M, Yokoyama T, Nabeshima Y, Kawano K, Tanaka I, Niimura N. Quaternary structure, aggregation and cytotoxicity of transthyretin. Amyloid Int J Exp Clin Invest. 2012;19(Suppl 1):5–7. doi: 10.3109/13506129.2012.666510. [DOI] [PubMed] [Google Scholar]
Associated Data
This section collects any data citations, data availability statements, or supplementary materials included in this article.