Abstract
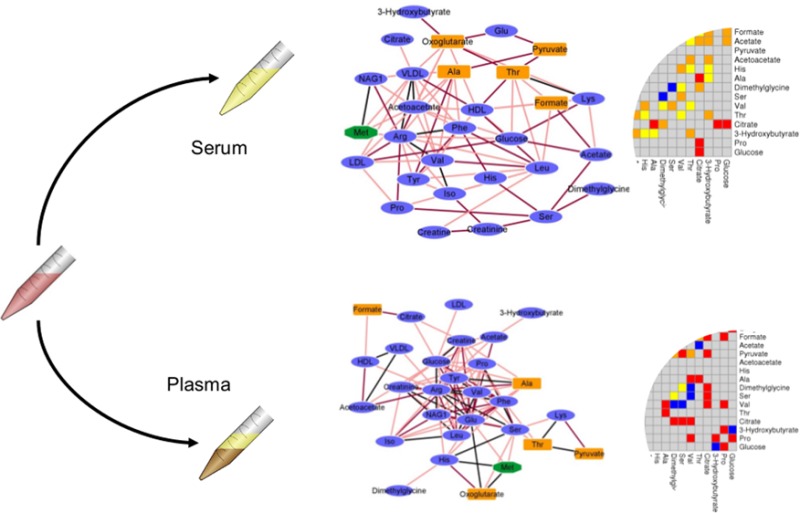
Blood is one of the most used biofluids in metabolomics studies, and the serum and plasma fractions are routinely used as a proxy for blood itself. Here we investigated the association networks of an array of 29 metabolites identified and quantified via NMR in the plasma and serum samples of two cohorts of ∼1000 healthy blood donors each. A second study of 377 individuals was used to extract plasma and serum samples from the same individual on which a set of 122 metabolites were detected and quantified using FIA–MS/MS. Four different inference algorithms (ARANCE, CLR, CORR, and PCLRC) were used to obtain consensus networks. The plasma and serum networks obtained from different studies showed different topological properties with the serum network being more connected than the plasma network. On a global level, metabolite association networks from plasma and serum fractions obtained from the same blood sample of healthy people show similar topologies, and at a local level, some differences arise like in the case of amino acids.
Keywords: blood, serum, plasma, low molecular weight metabolites, correlations, mutual information, network inference, differential network analysis, network topology
Introduction
A large variety of omics data can be collected from a sample, providing information about the biological system under investigation at different levels and from different angles; the analysis and integration of these aspects is one of the hallmarks of systems biology.
Metabolomics profiling and analysis of blood samples has been successfully applied to investigate a variety of diseases, such as cancer,1−3 kidney diseases,4 cardiovascular diseases,5,6 diabetes, and celiac disease.7−9 Blood bathes every tissue and every organ in the body and collects and transports the molecules that are being assimilated, secreted, excreted, or discarded by different tissues.10
In most metabolomics studies, either plasma or serum matrices are used as a proxy for blood. Blood is composed of cellular components (red and white cells and platelets) suspended in a straw-colored liquid carrier, the plasma, that accounts for ∼50–55% of blood volume.10 Plasma is separated from the cellular component via centrifugation after the addition of anticoagulants. Serum is obtained by letting the blood coagulate and removing the supernatant. Both plasma and serum are aqueous solutions (∼95% water) and contain proteins and peptides, carbohydrates, lipids, amino acids, electrolytes, organic wastes, and a variety of other small organic molecules dissolved in them. Many target clinical parameters, such as metal ions, proteins, and enzymes, have been found to show different concentrations11−13 in the two different media, but in terms of small molecules the compositions of plasma and serum are considered to be very similar.10 Recent studies have reported higher metabolite concentrations in serum than in plasma10,14,15 but suggested that either matrix should generate similar results in clinical and biological studies.15 However, to the best of our knowledge, there are no available studies in which biological or clinical results obtained using plasma have been confirmed using serum or vice versa.
We are interested in the associations between the concentration levels of metabolites in blood. Specifically, we wish to determine how similar the association networks inferred using metabolite concentration levels measured in plasma and serum are. As already anticipated, a great deal of biological information is encoded in the relationships among metabolite concentration levels rather than in their levels alone.16 For these reasons, it is important to understand which biological information is contained in both plasma and serum and to what extent plasma and serum contain unique or shared information.
In metabolomics, networks are usually reconstructed using Pearson’s, Spearman’s, or partial correlations (referred to as CORR).17−20 Here we complement a correlation-based approach with methods adapted from gene network inference to investigate metabolite association networks in blood samples. Four alternative methods for network inference were applied to avoid bias in network estimations, standard Pearson’s correlation, two well-characterized algorithms to infer gene regulatory networks, ARACNE (Algorithm for the Reconstruction of Accurate Cellular Networks),21 CLR (Context Likelihood of Relatedness),22 and PCLRC (Probabilistic Context Likelihood of Relatedness on Correlations), which we recently developed to infer metabolite associations.6
The aim of the present study is to investigate whether possible (dis)similarity exists between serum and plasma metabolite association networks obtained from the same blood samples or from different samples obtained from equivalent populations of healthy subjects. Two groups of ∼1000 healthy blood donors each were sampled for either their plasma or serum and analyzed using 1H nuclear magnetic resonance spectroscopy (NMR). An additional study, formed by 377 individuals, was considered for plasma and serum extracted from the same blood samples and analyzed using flow injection analysis-tandem mass spectrometry (FIA–MS/MS). For the purpose of investigating whether (dis)similarity of plasma and serum profiles obtained from the same sample was retained also in the presence of pathophysiological conditions, a small study on subjects suffering from various hematological malignancies was also considered.
Materials and Methods
Studies Description
Studies Ia and Ib
The participating subjects were recruited in collaboration with the Tuscan section of the Italian Association of Blood Donors (AVIS) in the Transfusion Service of Pistoia Hospital (Ospedale del Ceppo, AUSL 3 - Pistoia, Italy) (Study Ia) and in the Service of Immunohematology and Blood Transfusion of the Azienda Ospedaliero-Universitaria Careggi (Florence, Italy) (Study Ib). In brief, a total of 864 adult healthy volunteers (678 males, 186 females, mean age 41 ± 11 years) were enrolled in Pistoia.6,23 994 adult healthy volunteers (723 males, 271 females, mean age 41 ± 12 years) were enrolled in Florence.5 Plasma samples (study Ia) were obtained after overnight fasting, and EDTA was used as an anticoagulant; samples were stored at −80 °C immediately after collection. For more details, see Bernini et al.23 Samples were collected, preprocessed, and stored according to the standard operating procedures previously described.24 All subjects in the study provided informed consent.
Both studies Ia and Ib consisted of blood donors living in the same geographical area (within a ∼50 km radius from Florence, Tuscany in Italy) who must comply with the requirements for blood donation according to the Italian legislation. Among others: age 18–60 years, body weight >50 kg, systolic blood pressure 110–148 mmHg, diastolic blood pressure 60–100 mmHg, absence of (manifested) infectious diseases, absence of chronic diseases (such as diabetes, tumors, autoimmune diseases), no current menstruation, no consumption of medicines within 1 week before donation (bd), no common diseases (such as flu, cold, bronchitis) within 2 weeks bd, no surgery within 3 months bd, no endoscopic exams within 4 months bd, no pregnancy within 12 months bd, no abortion within 4 months bd, no travels to tropical countries within 6 months bd, and no (heavy) sport activity within 24 h bd. All samples were collected under a fasting condition. The two large studies could then be considered to be rather homogeneous. Plasma and serum samples were prepared for NMR analysis in the same laboratory using the same standard protocols for blood derivatives NMR analysis. EDTA was used on the plasma samples, as the effect of EDTA on the quality of the samples for NMR analysis has been found to be negligible.25 Samples were analyzed on the same instrument operating with the same operative setting. NMR spectra were postprocessed (phasing and baseline correction) with automated routines. Under these conditions, NMR experiments have been found to be extremely reproducible in inter/intra laboratory comparative investigations.26−29 Metabolites were then quantified using the same automated routine.
Study II
The subjects were recruited in the KORA (Cooperative Health Research in the Region of Augsburg) cohort, a population-based research platform with subsequent follow-up studies in the fields of epidemiology, health economics and health care research consisting of interviews in combination with medical and laboratory examinations, as well as the collection of biological samples.30
Plasma and serum samples from 377 individuals (180 females, 197 males, age range from 51 to 84 years) from the population-based cohort KORA F331 were used. For each participant, fasting blood was simultaneously drawn into serum and EDTA plasma gel tubes between 8 and 10 a.m. Plasma tubes were shaken gently and thoroughly for 15 min, followed by centrifugation at 2750g for 15 min at 15 °C. In the meantime, serum tubes were gently inverted twice, followed by 45 min of resting at room temperature to obtain complete coagulation before performing the same centrifugation process as for plasma. All samples were stored at −80 °C until the metabolomics analysis.15 All KORA participants gave written informed consent. The KORA study was approved by the ethics committee of the Bavarian Medical Association, Germany.
Study III
We were also interested in investigating the equivalence between plasma and serum profiles in the case of pathophysiological alterations. For this we considered a third study where serum and plasma were extracted from the same blood of subjects affected by different various hematological malignancies, and the samples were analyzed using NMR.
This data set comprises 30 patients (18 males, 12 females, median age 45 years, range 18 to 68) suffering from various hematological malignancies (9 acute myeloid leukemia, 7 acute lymphoblastic leukemia, 9 lymphoma, 3 myelodysplastic syndrome, 2 multiple myeloma) who underwent allogeneic (n = 24) or autologous (n = 6) hematopoietic stem cell transplantation at the Bone Marrow Transplantation Unit of the University Hospital of Patras, Greece. In addition, plasma and serum samples were collected from 13 healthy individuals. In total the study data set consisted of 43 serum and plasma samples obtained from the same blood specimen. Samples were collected, preprocessed, and stored according to the standard operating procedures previously described.24 All subjects in the study provided informed consent.
Metabolite Quantification and Analysis
Serum and plasma metabolite concentrations in the samples from studies I and III were analyzed using 1H NMR using a Bruker 600 MHz spectrometer (Bruker BioSpin) operating at 600.13 MHz using standard CPMG experiments and standard protocols for sample preparation as previously described.23 All resonances of interest were manually checked, and signals were assigned on template 1D NMR profiles by using matching routines of AMIX 7.3.2 (Bruker BioSpin) in combination with the BBIOREFCODE (Version 2-0-0; Bruker BioSpin) reference database and published literature when available. The relative concentrations of each metabolite were calculated by integrating the signals in the spectra. The 29 quantified metabolites are given in Table 1. We refer the reader to the original publications for more details of the experimental procedures.6,23
Table 1. List of Metabolites Measureda.
| no. p | studies I and III - NMR1 | study II FIA-MS/MS2 | ||||||
|---|---|---|---|---|---|---|---|---|
| 1 | 3-hydroxybutyrate | arginine | 33 | SM OH C14:1b | 65 | PC aa C38:4b | 97 | PC ae C40:0b |
| 2 | acetate | glutamine | 34 | SM OH C16:1b | 66 | PC aa C38:5b | 98 | PC ae C40:1b |
| 3 | acetoacetate | glycine | 35 | SM OH C22:1b | 67 | PC aa C38:6b | 99 | PC ae C40:2b |
| 4 | alanine | histidine | 36 | SM OH C22:2b | 68 | PC aa C40:1b | 100 | PC ae C40:3b |
| 5 | arginine | methionine | 37 | SM OH C24:1b | 69 | PC aa C40:4b | 101 | PC ae C40:4b |
| 6 | citrate | ornithine | 38 | SM C16:0b | 70 | PC aa C40:5b | 102 | PC ae C40:5b |
| 7 | creatine | phenylalanine | 39 | SM C16:1 | 71 | PC aa C40:6b | 103 | PC ae C40:6b |
| 8 | creatinine | proline | 40 | SM C18:0b | 72 | PC aa C42:0b | 104 | PC ae C42:1b |
| 9 | dimethylglycine | serine | 41 | SM C18:1b | 73 | PC aa C42:1b | 105 | PC ae C42:2b |
| 10 | formate | threonine | 42 | SM C24:0b | 74 | PC aa C42:2b | 106 | PC ae C42:3b |
| 11 | glucose | tryptophan | 43 | SM C24:1b | 75 | PC aa C42:5b | 107 | PC ae C42:4b |
| 12 | glutamine | tyrosine | 44 | PC aa C24:0 | 76 | PC aa C42:6b | 108 | PC ae C42:5 |
| 13 | HDL | valineb | 45 | PC aa C28:1 | 77 | PC ae C30:0b | 109 | PC ae C44:3b |
| 14 | histidine | xLeucine | 46 | PC aa C30:0b | 78 | PC ae C30:2 | 110 | PC ae C44:4b |
| 15 | isoleucine | C0 | 47 | PC aa C32:0b | 79 | PC ae C32:1b | 111 | PC ae C44:5b |
| 16 | LDL | C10b | 48 | PC aa C32:1b | 80 | PC ae C32:2 | 112 | PC ae C44:6b |
| 17 | leucine | C10:1b | 49 | PC aa C32:2b | 81 | PC ae C34:0b | 113 | lysoPC a C14:0 |
| 18 | lysine | C12b | 50 | PC aa C32:3 | 82 | PC ae C34:1b | 114 | lysoPC a C16:0b |
| 19 | methionine | C12:1b | 51 | PC aa C34:1b | 83 | PC ae C34:2b | 115 | lysoPC a C16:1 |
| 20 | N-acetylglucosamine | C14:1b | 52 | PC aa C34:2b | 84 | PC ae C34:3 | 116 | lysoPC a C17:0 |
| 21 | oxoglutarate | C14:2 | 53 | PC aa C34:3b | 85 | PC ae C36:1b | 117 | lysoPC a C18:0b |
| 22 | phenylalanine | C16b | 54 | PC aa C34:4 | 86 | PC ae C36:2b | 118 | lysoPC a C18:1b |
| 23 | proline | C18b | 55 | PC aa C36:0b | 87 | PC ae C36:3b | 119 | lysoPC a C18:2 |
| 24 | pyruvate | C18:1b | 56 | PC aa C36:1b | 88 | PC ae C36:4b | 120 | lysoPC a C20:3b |
| 25 | serine | C18:2 | 57 | PC aa C36:2b | 89 | PC ae C36:5 | 121 | lysoPC a C20:4 |
| 26 | threonine | C2 | 58 | PC aa C36:3b | 90 | PC ae C38:0b | 122 | lysoPC a C28:0b |
| 27 | tyrosine | C3b | 59 | PC aa C36:4b | 91 | PC ae C38:1b | ||
| 28 | valine | C4b | 60 | PC aa C36:5b | 92 | PC ae C38:2b | ||
| 29 | VLDL | C5b | 61 | PC aa C36:6b | 93 | PC ae C38:3b | ||
| 30 | C8b | 62 | PC aa C38:0b | 94 | PC ae C38:4b | |||
| 31 | C8:1 | 63 | PC aa C38 1b | 95 | PC ae C38:5b | |||
| 32 | H1 | 64 | PC aa C38 3b | 96 | PC ae C38:6b | |||
(1) Study I and III: Metabolites (p = 29) measured (NMR) in serum and plasma obtained from different blood specimens. (2) Study II: Metabolites (p = 122) measured (FIA-MS/MS) in serum and plasma obtained from the same blood specimens. The metabolites common to both data sets are in italics. xLeucine refers to the sum of leucine and isoleucine.
Concentrations are isotope-corrected.33
Plasma and serum metabolite concentrations in Study II were quantified using a commercially available metabolomics kit (AbsoluteIDQ p150 Kit, Biocrates Life Sciences AG, Innsbruck, Austria), which is based on flow injection analysis-triple quadrupole mass spectrometry (FIA-MS/MS). Out of the 10 μL sample, 163 metabolites were quantified simultaneously. Of these, n = 122 (25 quantified and 97 semiquantified metabolites passed both criteria) passing the data quality control (see material and methods in ref (15) for further details) were retained for further analysis.
The assay procedures and the full biochemical names have been described in more detail in previous publications.15,32 Metabolite concentrations in the original samples were updated due to new insights according to the isotope correction, as previously described.33
Network Reconstruction
In the graphical representation of a biological network, the molecular components (here metabolite concentrations) are represented as nodes and the edges (or links) represent their interactions, either direct or indirect. Here interactions represented coordinated changes in metabolite concentration levels. In brief, three different methods for network inference were used to infer metabolite network using default parameters as previously detailed,34 together with the standard correlation approach. We present here a brief description of the methods based on ref (34). We refer to the original publications for more details. All methods were used with default parameters.
Method Based on Correlations
The association between any pair of metabolites was measured through the absolute value of Pearson’s correlation (the method is referred to as CORR in this study).
CLR Algorithm
The CLR (Context Likelihood of Relatedness) algorithm22 uses mutual information as a measure of the similarity between the profiles of the two chosen variables data. Indicating with X and Y the concentration of two metabolites, the mutual information MI between X and Y is defined as
| 1 |
where p(xi,yj) is the joint probability distribution function of X and Y and p(xi) (respectively, p(yj)) indicates the probability that X = xi (respectively, Y = yj). It should be noted that to compute MI continuous data are discretized. The relationships between pairs of metabolites expressed by MI are then compared against the local context for each possible interaction so that possible spurious (indirect) associations are removed.
ARACNE Algorithm
As CLR, ARACNE (Algorithm for the Reconstruction of Accurate Cellular Networks)21 uses MI as a measure of the similarity between two chosen variables. The properties of MI are used to prune the network of spurious interactions: The weakest edge of each triplet is interpreted as an indirect interaction and is removed if the difference between the two lowest weights is above a threshold γ. We used the ARANCE implementation presented in the R package “minet”35 with default parameters (γ = 0).
PCLRC Algorithm
PCRLC (Probabilistic Context Likelihood of Relatedness on Correlations) was based on a modification of the CLR algorithm (using correlation instead of MI to measure similarity between profiles) and on iteratively sampling the data set, resulting in a weighted adjacency matrix containing an estimate of the likeliness of the association between any two metabolites expressed as probability in the range 0 to 1. We deemed significant those associations for which the probability was >0.95. An ‘R’ implementation of this algorithm is available at semantics.systemsbiology.nl. More details are provided in ref (6).
Construction of Serum and Plasma Metabolite Networks
The serum and plasma metabolite–metabolite association networks were constructed taking a so-called wisdom of crowds approach as detailed in ref (36). The following methodological description is based on ref (36), to which we refer for more details. For each set of samples obtained from Studies Ia, Ib, and II four adjacency matrices {aij}m (with m = 1 to 4) were obtained using the above-described methods. The entries of such matrices are real numbers in the range [−1, 1] for correlation matrices, in the [0, +∞) range for mutual information matrices, or [0, 1] for probabilistic networks, indicating the strength or the likelihood of the metabolite–metabolite associations. It should be noted that each of the considered algorithms uses different approaches to estimate the weight of the associations. As a result, the weights produced by different methods cannot be directly compared.
These matrices are binarized to 0 and 1, imposing a threshold, τm, on the {aij}m values
| 2 |
The values of τm depend on the method considered: 0.95 for PCLRC and 0.6 on the absolute value of the correlation for the CORR method. ARACNE and CLR follow different approaches to remove spurious correlations, and the weight of all associations deemed spurious is already set to zero. As a result, no further threshold is needed for these methods, and a τm value of zero was selected, as further detailed in ref (34). The choice of 0.6 for the correlation is based on the threshold, as discussed by Camacho et al.37 The four networks were then superimposed
| 3 |
The final adjacency matrix, representing the metabolite network, was defined by retaining only those links inferred by two or more methods.
| 4 |
We set Q = 2, but other options were also explored as detailed in the Results and Discussion. In total, four networks were defined, two for studies Ia and Ib (plasma and serum obtained from different subjects, respectively) and two for study II (serum and plasma obtained from the same subjects). All networks were constructed using a large sample size (>900 samples for studies Ia and Ib and >350 for study II), ensuring the reliability of the inferred networks, as previously described.34
The node degree δi for the ith metabolite is the number of links connecting those particular metabolites and was obtained as
| 5 |
Indices for Assessing Network Differences
To compare analytically different networks we used the Frobenius norm of a matrix X defined as38
| 6 |
It holds that ∥X∥ = 0 if and only if X = 0. It follows that ∥X – Y∥ = 0 if and only if the two matrices are equal. In this case, X and Y are two binary adjacency matrices representing metabolite–metabolite association networks. The Frobenius norm was used solely to conveniently quantify and summarize the difference between two adjacency matrices. Network differences were derived on the basis of different node (metabolite)-degree observed in serum and plasma networks.
Pathway Enrichment Analysis
The MetaboAnalyst server 3.0 (www.metaboanalyst.ca)39 was used to perform pathway enrichment analysis. For the over-representation analysis, the hypergeometric test was chosen and the pathway topology analysis was based on the relative-betweenness centrality.
Results and Discussion
Plasma is obtained from a blood sample, after the addition of an anticoagulant (usually citrate, heparin, or, in the present case, EDTA), by centrifuging the sample and removing or decanting the most buoyant (noncellular) portion. Serum is obtained by letting the blood clot and then collecting the supernatant. Recent studies have addressed the problem of the stability, in plasma and serum, of low-molecular-weight metabolites for metabolomics studies with respect to sample handling and storing.
Serum and plasma extraction procedures have been thoroughly investigated in the past, and variations in several analyte concentrations were observed depending on extraction and storage protocols.11−14
During the coagulation process, blood cells are metabolically active, and this might lead to some changes in metabolite concentrations. Thus it can be speculated that metabolite association networks inferred in serum may also be influenced by the undergoing coagulation process. For these reasons it is of interest to construct and compare metabolite–metabolite association networks considering serum and plasma fractions extracted from different as well as from the same blood specimen.
Comparison of Reconstructed Networks from Plasma and Serum from Different Blood Specimens
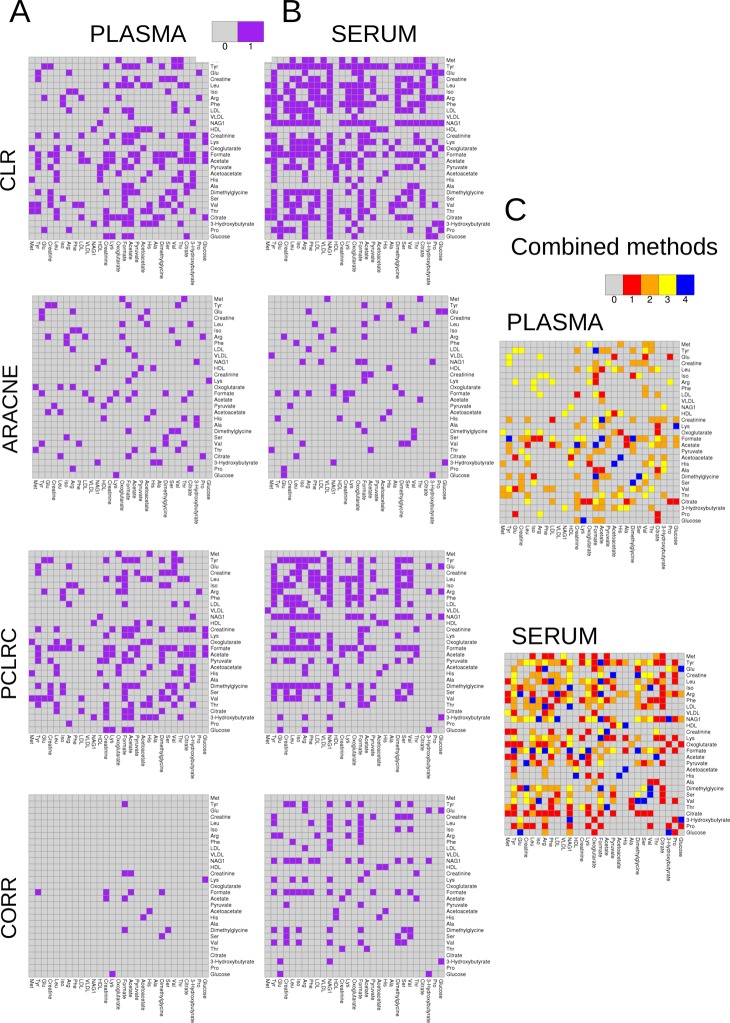
Using the samples collected within studies Ia and Ib (864 and 994 samples, respectively) we built metabolite association networks using the four described methods. The networks are shown in Figure 1 (panels A and B for plasma and serum, respectively). It can be observed that for both plasma and serum the networks obtained using different methods show different topology. Figure 2A shows the relationship between the node degree (i.e., the number of connecting metabolites) for metabolites in serum and plasma as inferred from different methods.
Figure 1.
(A) Plasma metabolites association networks obtained using the four different methods. (B) Serum metabolites association networks obtained using the four different methods. (C) Consensus association network for serum and plasma. Data from studies Ia (plasma) and Ib (serum) (NMR, 29 metabolites from different blood specimens). (CLR denotes Context Likelihood of Relatedness, ARACNE is Algorithm for the Reconstruction of Accurate Cellular Networks, PCLRC is Probabilistic Context Likelihood of Relatedness on Correlations, and CORR is Pearson's correlation.)
Figure 2.
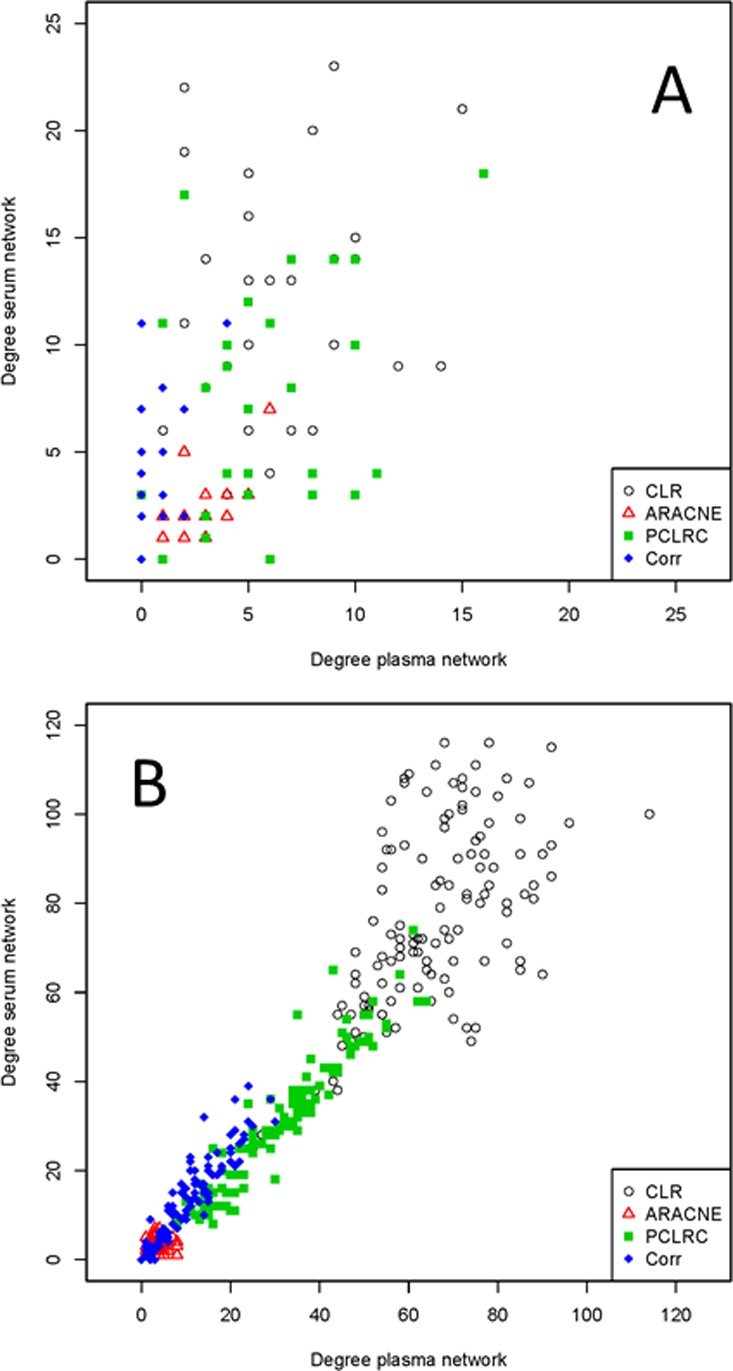
Scatter plot of metabolite degree (connectivity) observed in the plasma and serum networks reconstructed with different methods. (A) Serum and plasma networks reconstructed from different blood samples (studies Ia and Ib, NMR data, 29 metabolites). (B) Serum and plasma networks reconstructed from the same blood samples (Study II, MS data, 122 metabolites). (CLR denotes Context Likelihood of Relatedness, ARACNE is Algorithm for the Reconstruction of Accurate Cellular Networks, PCLRC is Probabilistic Context Likelihood of Relatedness on Correlations, and CORR is Pearson's correlation.)
Within each data set, the association networks among metabolites inferred using different methods have inherently different topology: This means that edges between the same nodes can be present in a network and absent in another and vice versa. It can be argued that different connectivity patterns arise because of the arbitrary choice imposed on the weighted adjacency matrices, but it can be shown34 that by varying the thresholds it is not possible to transform the connectivity matrix obtained with one method into another. A pragmatic approach to arrive at serum and plasma specific association networks is to take a so-called wisdom of crowds approach, that is, aggregating the results of the four methods, as suggested in the comparative study from the DREAM challenge.40Figure 3A–D shows scatter plots of the serum metabolite degree versus the plasma metabolite degree as a function of the number of methods considered to obtain a consensus: The best agreement is obtained, in this case of NMR data (studies Ia and Ib), when the consensus network (see eq 3) is obtained by considering the results of at least three methods; in this case, the correlation between node degree in the two matrices is r = 0.6 (Pearson’s correlation, P value <10–6). Consensus networks are presented in Figure 1C. However, some differences in the topology of the networks still remain that are worthy of comment: Metabolite degrees are given in Supporting Table S1. Consistent changes in metabolite connectivity can be observed: Alanine, citrate, and proline are disconnected in the serum network but not in the plasma network; conversely, VLDL is disconnected in plasma but not in serum. Other metabolites, like NAG1, creatine, valine, and formate, are densely connected in serum but not in plasma, indicating a substantially differential behavior.
Figure 3.
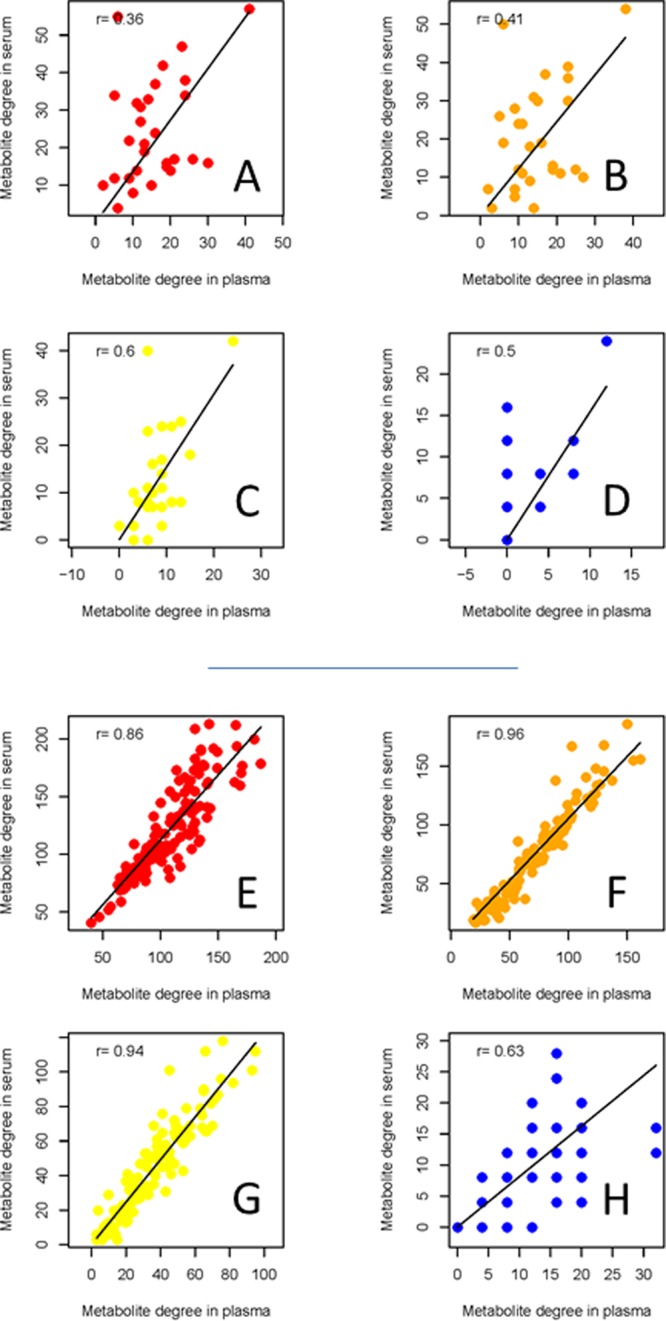
Metabolite degree (connectivity) observed in the consensus plasma and serum networks reconstructed by combining the results of different network inference methods. (A–D) Networks obtained from different blood specimens (Studies Ia and Ib, NMR data, 29 metabolites) using the consensus of 1, 2, 3, and 4 methods, respectively. The best agreement between metabolites in serum and plasma is obtained when the consensus of three methods is taken (r = 0.6, panel C). (E–H) Networks obtained from different blood specimens (Study II, FIA-MS/MS data, 122 metabolites) using the consensus of 1, 2, 3, and 4 methods, respectively. The best agreement between metabolites in serum and plasma is obtained when the consensus of two methods is taken (r = 0.96, panel F).
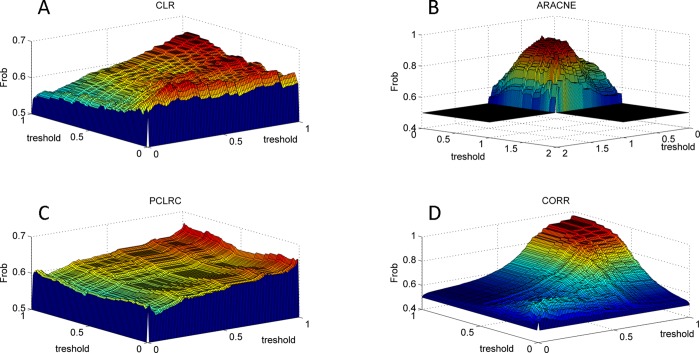
It can again be argued that different connectivity patterns arise because of the arbitrary choice imposed on the weighted adjacency matrices: As shown in Figure 4, it is not possible to transform the serum network into the plasma one (or vice versa) by varying the thresholds τm (see eq 2) imposed on the weighted adjacency matrix.
Figure 4.
Transformation of the serum network into the plasma network (or vice versa) by varying the thresholds imposed on the weighted adjacency matrices. The Frobenius norm is used to assess differences between the connectivity matrices. The Frobenius norm is always larger than 0; therefore, it can be concluded that it is not possible to transform one network into the other: The metabolites association networks obtained from samples in studies Ia and Ib (NMR, 29 metabolites, plasma and serum from different blood samples) are inherently different in plasma and serum. (CLR denotes Context Likelihood of Relatedness, ARACNE is Algorithm for the Reconstruction of Accurate Cellular Networks, PCLRC is Probabilistic Context Likelihood of Relatedness on Correlations, and CORR is Pearson's correlation.)
Exploring Differences between the Plasma and Serum Data Sets
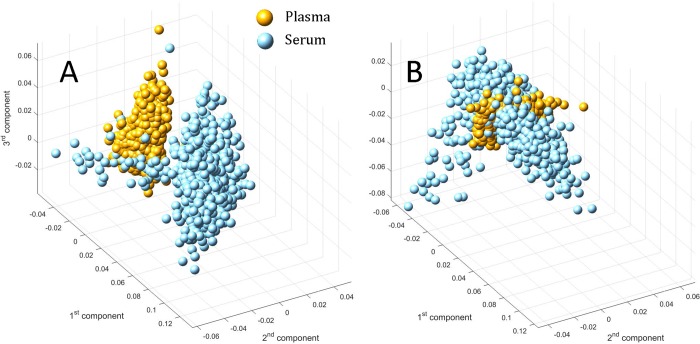
The differences observed in the plasma and serum networks obtained using NMR on studies Ia and Ib may be attributed to the two fractions being extracted from different biological specimens (see description in the Material and Methods). By performing principal component analysis (PCA) on the two large combined data sets we found separation between the plasma and serum samples (Figure 5A), as already noted in other studies, even when plasma and serum were extracted from the same samples.14,41 Independent centering of the two data sets removed the separation, indicating differences in the average concentrations (Figure 5B): We found that 23 out of the 29 measured metabolites had lower levels in plasma with respect to serum (two-tailed t test with adjustment for unequal variances, with P value <0.0001 after Bonferroni correction42), whereas for the others (formate, pyruvate, alanine, threonine, and oxoglutarate) the concentrations were significantly higher in plasma than in serum (results are summarized in Supporting Table S2). Only 3-hydroxybutyrate showed no significant difference between the two data sets. However, given the large sample size, the analysis may be overpowered and the result, although statistically significant, may not be also biologically relevant because these may be trivial effects.43−45 Moreover, the difference observed in the networks originates from a multivariate data analysis approach, which does not necessarily reflect differences observed in the univariate analysis.16 However, an increased level of metabolites in serum with respect to plasma has also been observed in previous studies.15,46
Figure 5.
(A) Score plot for a PCA model on the data set obtained from union of the plasma and serum metabolite data sets from studies Ia and Ib (NMR, 29 metabolites, plasma and serum obtained from different blood specimens). The separation between the two blood fractions is evident as a result of different concentration levels of the same metabolites. (B) Score plot for a PCA model on the union of the plasma and serum metabolites (studies Ia and Ib), which have been independently centered to remove the concentration offset: The separation is removed and the two groups overlap. However, differences in the networks remain; See the text for more details.
Although the two study populations are highly homogeneous being blood donor volunteers (see Study Ia and Ib description in the Materials and Methods section), we may be observing a possible batch effect, probably due to the procedures for blood withdrawal and processing performed in the two distinct clinical units. Differences in laboratory conditions, reagent and consumables lots, and personnel habits could affect the final measurements with behaviors that are unrelated to the biological or scientific variables in the study.47 To compensate for these, we applied a correction method for the removal of batch effects based on a mixed model with simultaneous estimation of the correlation matrix48 before re-estimating the metabolite–metabolite association networks. We observed a slight reduction in the dissimilarity between the serum and plasma networks (not shown): However, the overall topology of the two networks remained different.
Comparison of Reconstructed Networks from Plasma and Serum from the Same Blood Specimen
We sought experimental validation of the existence of a difference between the two networks using the samples obtained from study II, where serum and plasma were obtained from the same blood specimens. The resulting networks are shown in Figure 6 (panels A and B for plasma and serum, respectively).
Figure 6.
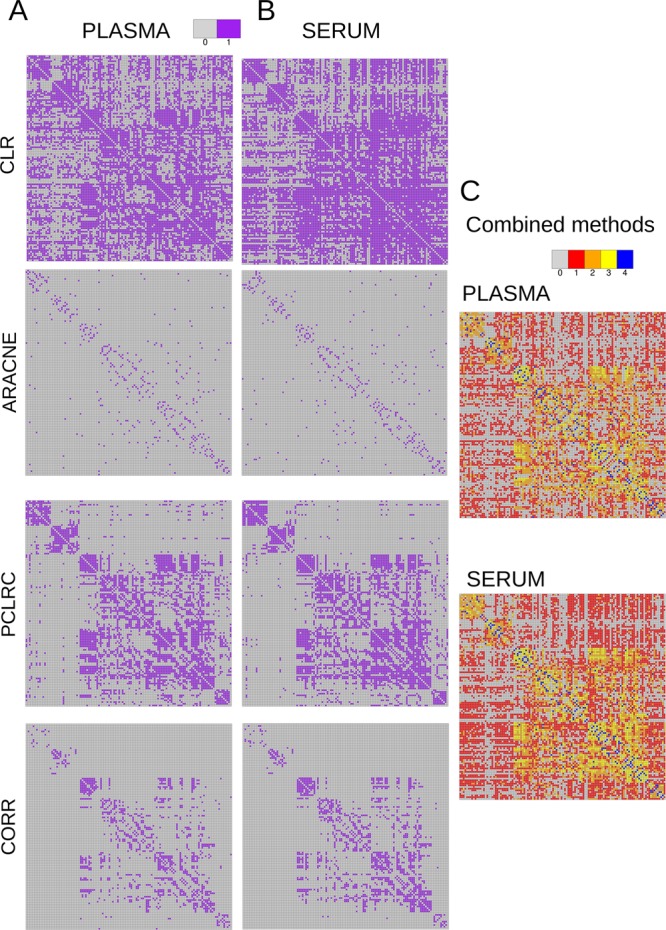
(A) Plasma metabolites association networks obtained using the four different methods. (B) Serum metabolites association networks obtained using the four different methods. (C) Consensus association network for serum and plasma. (CLR denotes Context Likelihood of Relatedness, ARACNE is Algorithm for the Reconstruction of Accurate Cellular Networks, PCLRC is Probabilistic Context Likelihood of Relatedness on Correlations, and CORR is Pearson's correlation.)
When a consensus is sought using the same strategy, the overall topologies of the plasma and serum networks are very similar: The best agreement in terms of metabolite degree is obtained, in this case, when two methods are considered, as derived from the scatter plots in Figure 3E–H. The correlation between the metabolite degree is rather high (r = 0.96; Pearson’s correlation, P value < 10–10), indicating an almost perfect equivalence between serum and plasma metabolite association networks. This suggests that from a network analysis point of view the two fractions carry essentially the same information and can be used interchangeably. It is interesting to note that the best consensus here is obtained with two methods, while in the case of the NMR data (studies Ia and Ib, plasma and serum from different blood specimens) the best consensus was obtained with three methods. This difference may arise from the use of different analytical platforms: Data obtained using NMR and MS have different characteristics49,50 especially concerning the error structure and its correlation, and this may hamper network inference and reconstruction,18 leading to both false-negatives and false-positives; the latter could indeed be avoided by deploying different methods that exploit different data characteristics. We also remark here that no preprocessing, such as normalization, was applied to the data because normalization affects the correlation data structure and ultimately network inference,51 and we wanted to avoid artifacts in the inferred networks. However, some local topological differences remain that are worthy of further investigation, as in the case of amino acids.
Comparison of Plasma and Serum Amino Acids Association Networks
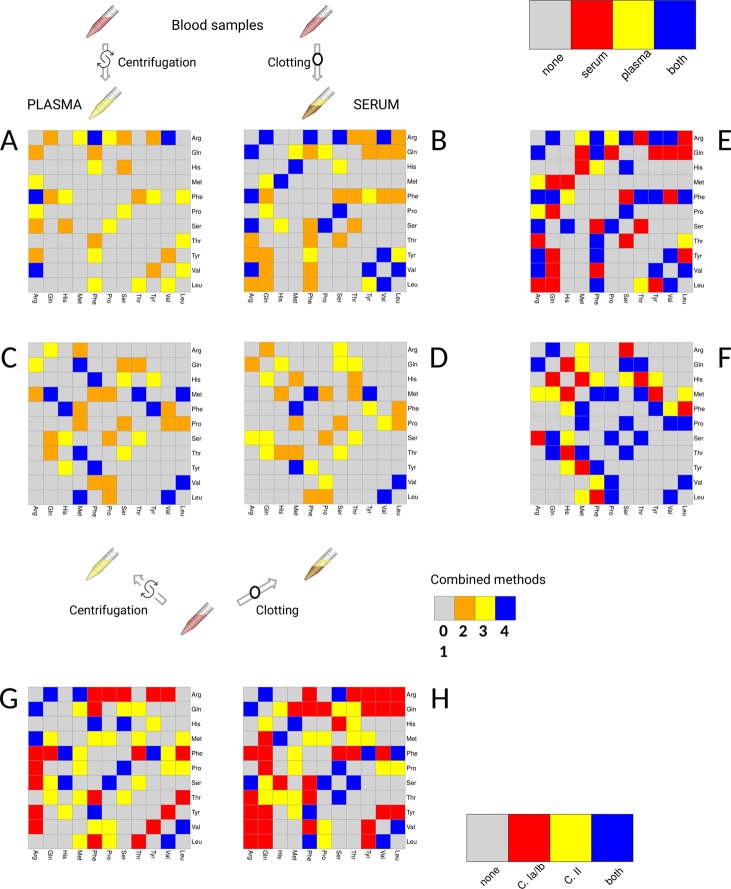
The array of metabolites measured on the same study spans a different class of compounds than those measured using NMR, but 11 amino acids have been measured in both studies I and II (see Table 1), and the association networks can be directly compared across the two situations, where serum and plasma have been obtained from different and from the same blood specimens. The networks are shown in Figure 7 (panels A and B different specimens; panels C and D same specimens).
Figure 7.
Association network for serum and plasma amino acids obtained from the different blood specimens (networks A and B, Studies Ia and Ib, NMR data) and from the same blood specimens (networks C and D, Study II, FIA-MS/MS data, 122 metabolites). Note that here Leu (= xLeu) refers to the sum of leucine and isoleucine).(E) Consensus networks between plasma and serum extracted from different specimens (Studies Ia and Ib). (F) Consensus networks between plasma and serum extracted from the same specimens (Study II). (G) Plasma consensus networks among different analytical platforms. (H) Consensus networks between plasma and serum extracted from different specimens (Study I).
In general, if amino acids are or share common substrates, then they can be expected to be correlated, like, for instance, proline/arginine, whose association we observed only in the plasma network derived from study Ia (NMR data) and not in the other networks. In contrast, an association between leucine and valine (that share enzymes for catabolizing the first two steps in their metabolism and that can be metabolically interconverted) is observed in all the networks. Arginine was found to be connected only in the networks obtained from study I, with several associations found in both serum and plasma networks (see consensus network shown Figure 7E). It is also important to note that correlations between amino acids might be a result not only of their common biosynthetic pathways and their tight regulation but also of their coordinated participation in protein synthesis or conversely a result of amino acids release after protein degradation.52 The consensus network for plasma and serum derived from the same blood specimen given in Figure 7F shows a core of conserved metabolite–metabolite associations, such as the strong connectivity among proline, valine, serine, methionine, leucine (here signifying both leucine and isoleucine, which were not distinguishable), and glutamine and threonine with serine, methionine, and glutamine. Differences mostly arise in the connectivity patterns of histidine, where no association was found to be in common between the two networks: those metabolites (histidine, tyrosine, threonine, serine, phenylalanine, methionine, and glutamine). Overall, network differences related to these amino acids can be associated with differences in aminoacyl-tRNA biosynthesis pathways (P value = 2.1 × 10⁻¹¹, Holm-corrected P value = 1.7 × 10⁻⁹). These results point to the hypothesis that the representation of this pathway may be not the same in the two blood fractions. It is interesting to note that aminoacyl-tRNA synthetases have been recently associated with inflammation,53,54 which are also triggered by the blood coagulation process: In this respect the differences observed between serum and plasma could be explained. Differences in amino acid correlation patterns have been observed in different tissues, a behavior that we observed in serum and plasma.55 The reliability of metabolite measurements was higher in serum compared with plasma samples and was good for most saturated short-and medium-chain acylcarnitines, amino acids, biogenic amines, glycerophospholipids, sphingolipids, and hexose; however, serum amino acids may become unstable,46 and this may explain some of the differences observed in networks.
Comparison of Plasma and Serum Amino Acids Profiles in the Presence of Pathophysiological Alterations
Owing to the limited number of samples and their heterogeneity, we did not attempt to infer networks or covariance/correlation matrices for these data. Instead, samples from study III were subject to PCA to investigate possible differences in metabolites concentration patterns. The two biofluids bear significant metabolic profile similarities at the local level, as shown in Figure 8, where the considerable overlap of the NMR spectra of serum and plasma sample obtained from the same blood specimen is displayed. This is also confirmed by the PCA performed on the data set of the metabolites quantified in the serum and plasma of the same subjects, as shown in Figure 9A.
Figure 8.
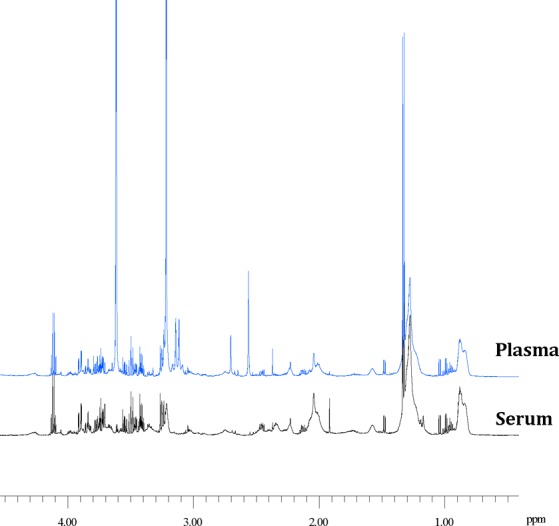
Superimposition of the NMR spectra (aliphatic region) of a plasma (top) and a serum (bottom) sample obtained by the same blood specimen.
Figure 9.
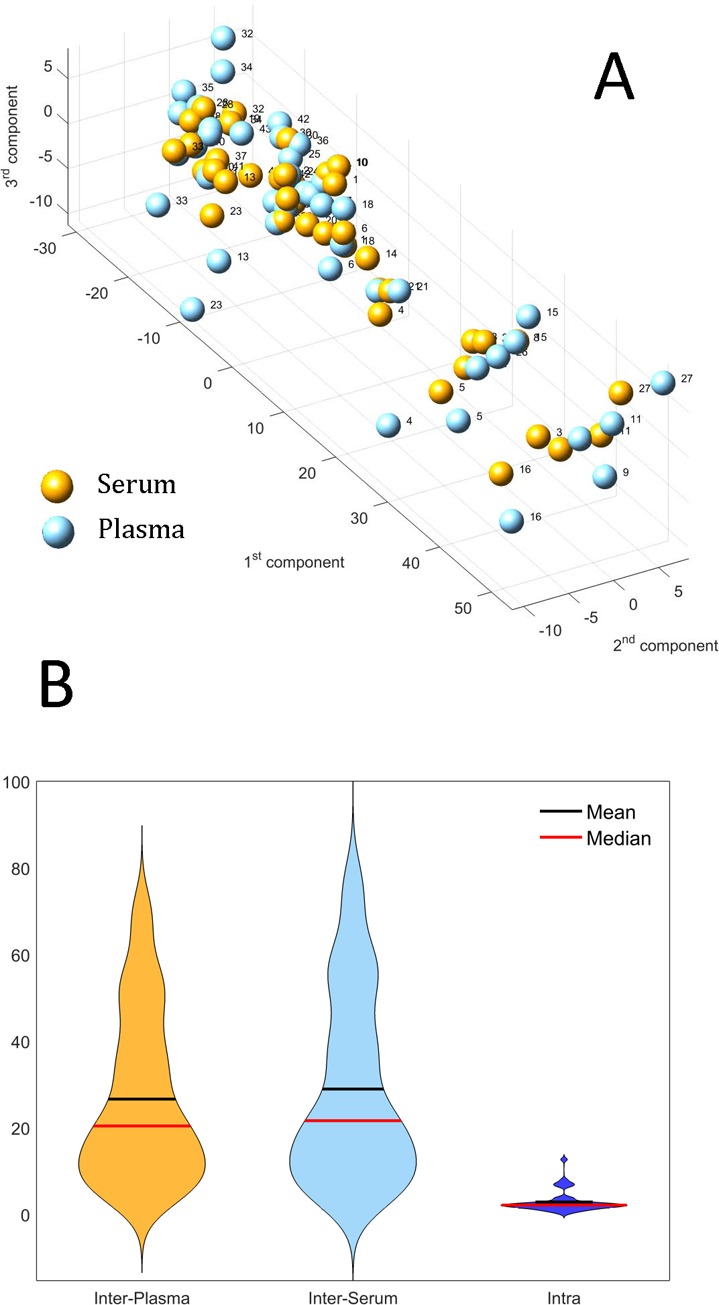
(A) Score plot for the PCA model of the data set containing the metabolite concentrations measured in serum and plasma extracted from the same blood sample: The profiles of serum and plasma samples are very similar, as indicated by the closeness of the point representing serum and plasma profiles from the same sample. (B) Violin plot of the distribution of the distances between profiles of different subjects (plasma and serum, denoted as Interplasma and Interserum, respectively) and the distribution of the distance between the plasma and serum profile of each subject (Intra). The average Intra distance is one order of magnitude smaller than the interdistance. Data are scaled by a factor of 10–3 for better visualization.
Pearson’s correlation of the first principal component for the serum and plasma is r = 0.995, P value <10–12, indicating the high similarity of plasma and serum profiles. (Similar results hold for higher order components.) Working in the PCA subspace defined by the first three components (which explain >99% of the variation in the data), we observe that the average Euclidean distance between the serum and plasma sample of each subject (∼2.5 au) is one order of magnitude smaller than the average distance between the serum (or plasma) sample of two different subjects (∼26 and ∼29 au, respectively). The distribution of the distance values is shown in the form of violin plots in Figure 9B. These differences are statistically significant (P value <1.3 × 10⁻⁸ for both comparisons using a Wilcoxon test).
However, it is possible that this equivalence may not be observed in other types of pathophysiological alterations given the large spectrum of disease manifestation, which often results in very nonhomogeneous clinical samples. In fact, that serum and plasma may not be biologically equivalent under pathological conditions is not a new concept. For instance, they are not equivalent for what concerns inflammation markers. The clotting of blood stimulates blood cell eicosanoid biosynthesis,56 and thus serum levels of these metabolites do not reflect physiological concentrations.10 Moreover, results can be affected by the choice of the algorithm used. Although, here we presented an approach that should reduce the bias toward a given network inference method.
Conclusions
Networks and network analysis are being extensively used in systems biology, and they have proven to be valuable tools to investigate and understand many aspects of the complex biological machinery underlying the function of living organisms. Through a comparative approach and using well-assessed and recently developed methods for network inference, we have shown that plasma and serum metabolite networks possess the same topological characteristics. To the best of our knowledge this is the first study to address plasma and serum differences from a network analysis perspective. Our findings suggest that plasma and serum may be biologically equivalent at a global network level. Nevertheless, some local differences arise, as in the case of amino acids, which should be taken into account when analyzing, comparing, and interpreting blood metabolite association networks.
However, when the plasma and serum fractions are extracted from different samples (even when samples are collected, processed, and analyzed under controlled conditions), the topological characteristics of the two networks are different. Further validation of these results should also be sought considering samples from more heterogeneous studies involving, for instance, broader age span of the participants and pathophysiological conditions.
Through a standard multivariate analysis, we also observed that the difference between serum and plasma profiles obtained from the same blood specimen is on average an order of magnitude smaller than the average difference between serum/plasma samples from different blood specimen. However, this result was observed on a rather small data set and will require further validation in a larger study.
Acknowledgments
We acknowledge AVIS Toscana (in the person of Mr. Luciano Franchi and Mrs. Donata Marangio), AVIS Pistoia (in the person of Mr. Alessandro Pratesi), and the technical staff of Transfusion Service of the Pistoia Hospital for helping us with volunteers recruitment and samples collection. This work was partly supported by the European Commission-funded project INFECT (contract number: 305340). This work was also partially supported by Fondazione Veronesi that granted L.T. the Post-Doctoral Fellowship-2015. We express our appreciation to all KORA study participants for donating their blood and time. We thank the field staff in Augsburg conducting the KORA studies. We are grateful to the staff from the Institute of Epidemiology at the Helmholtz Zentrum München and the Genome Analysis Center Metabolomics Platform who helped in the sample logistics and metabolomic measurements. The KORA study was initiated and financed by the Helmholtz Zentrum München – German Research Center for Environmental Health, which is funded by the German Federal Ministry of Education and Research (BMBF) and by the State of Bavaria. Furthermore, KORA research was supported within the Munich Center of Health Sciences (MC-Health), Ludwig-Maximilians-Universität, as part of LMUinnovativ. Part of this project was supported by EU FP7 grant HEALTH-2013-2.4.2-1/602936 (Project CarTarDis).
Supporting Information Available
The Supporting Information is available free of charge on the ACS Publications website at DOI: 10.1021/acs.jproteome.7b00106.
Table S1. Metabolite degree. Table S2. Average plasma and serum concentration (NMR). (PDF)
Author Contributions
● M.S.-D. and E.S. contributed equally to this work. Authors’ names, other than the first and the last, are listed in alphabetical order.
The authors declare no competing financial interest.
Supplementary Material
References
- Oakman C.; Tenori L.; Claudino W.; Cappadona S.; Nepi S.; Battaglia A.; Bernini P.; Zafarana E.; Saccenti E.; Fornier M.; et al. Identification of a serum-detectable metabolomic fingerprint potentially correlated with the presence of micrometastatic disease in early breast cancer patients at varying risks of disease relapse by traditional prognostic methods. Ann. Oncol. 2011, 22, 1295–1301. 10.1093/annonc/mdq606. [DOI] [PubMed] [Google Scholar]
- Wen H.; Yoo S. S.; Kang J.; Kim H. G.; Park J.-S.; Jeong S.; Lee J. I.; Kwon H. N.; Kang S.; Lee D.-H.; et al. A new NMR-based metabolomics approach for the diagnosis of biliary tract cancer. J. Hepatol. 2010, 52, 228–233. 10.1016/j.jhep.2009.11.002. [DOI] [PubMed] [Google Scholar]
- Carrola J.; Rocha C. M.; Barros A. S.; Gil A. M.; Goodfellow B. J.; Carreira I. M.; Bernardo J. O.; Gomes A.; Sousa V.; Carvalho L.; et al. Metabolic signatures of lung cancer in biofluids: NMR-based metabonomics of urine. J. Proteome Res. 2011, 10, 221–230. 10.1021/pr100899x. [DOI] [PubMed] [Google Scholar]
- Weiss R. H.; Kim K. Metabolomics in the study of kidney diseases. Nat. Rev. Nephrol. 2011, 8, 22–33. 10.1038/nrneph.2011.152. [DOI] [PubMed] [Google Scholar]
- Tenori L.; Hu X.; Pantaleo P.; Alterini B.; Castelli G.; Olivotto I.; Bertini I.; Luchinat C.; Gensini G. F. Metabolomic fingerprint of heart failure in humans: a nuclear magnetic resonance spectroscopy analysis. Int. J. Cardiol. 2013, 168, e113–e115. 10.1016/j.ijcard.2013.08.042. [DOI] [PubMed] [Google Scholar]
- Saccenti E.; Suarez-Diez M.; Luchinat C.; Santucci C.; Tenori L. Probabilistic networks of blood metabolites in healthy subjects as indicators of latent cardiovascular risk. J. Proteome Res. 2015, 14, 1101–1111. 10.1021/pr501075r. [DOI] [PubMed] [Google Scholar]
- Bertini I.; Calabrò A.; De Carli V.; Luchinat C.; Nepi S.; Porfirio B.; Renzi D.; Saccenti E.; Tenori L. The metabonomic signature of celiac disease. J. Proteome Res. 2009, 8, 170–177. 10.1021/pr800548z. [DOI] [PubMed] [Google Scholar]
- Calabrò A.; Gralka E.; Luchinat C.; Saccenti E.; Tenori L. A metabolomic perspective on coeliac disease. Autoimmune Dis. 2014, 2014, 1–13. 10.1155/2014/756138. [DOI] [PMC free article] [PubMed] [Google Scholar]
- Bernini P.; Bertini I.; Calabro A.; La Marca G.; Lami G.; Luchinat C.; Renzi D.; Tenori L. Are patients with potential celiac disease really potential? The answer of metabonomics. J. Proteome Res. 2011, 10, 714–721. 10.1021/pr100896s. [DOI] [PubMed] [Google Scholar]
- Psychogios N.; Hau D. D.; Peng J.; Guo A. C.; Mandal R.; Bouatra S.; Sinelnikov I.; Krishnamurthy R.; Eisner R.; Gautam B.; et al. The human serum metabolome. PLoS One 2011, 6, e16957. 10.1371/journal.pone.0016957. [DOI] [PMC free article] [PubMed] [Google Scholar]
- Boyanton B. L.; Blick K. E. Stability studies of twenty-four analytes in human plasma and serum. Clin. Chem. 2002, 48, 2242–2247. [PubMed] [Google Scholar]
- Miles R. R.; Roberts R. F.; Putnam A. R.; Roberts W. L. Comparison of serum and heparinized plasma samples for measurement of chemistry analytes. Clin. Chem. 2004, 50, 1704–1706. 10.1373/clinchem.2004.036533. [DOI] [PubMed] [Google Scholar]
- Oddoze C.; Lombard E.; Portugal H. Stability study of 81 analytes in human whole blood, in serum and in plasma. Clin. Biochem. 2012, 45, 464–469. 10.1016/j.clinbiochem.2012.01.012. [DOI] [PubMed] [Google Scholar]
- Liu L.; Aa J.; Wang G.; Yan B.; Zhang Y.; Wang X.; Zhao C.; Cao B.; Shi J.; Li M.; Zheng T.; Zheng Y.; Hao G.; Zhou F.; Sun J.; Wu Z. Differences in metabolite profile between blood plasma and serum. Anal. Biochem. 2010, 406, 105–112. 10.1016/j.ab.2010.07.015. [DOI] [PubMed] [Google Scholar]
- Yu Z.; Kastenmüller G.; He Y.; Belcredi P.; Möller G.; Prehn C.; Mendes J.; Wahl S.; Roemisch-Margl W.; Ceglarek U.; Polonikov A.; Dahmen N.; Prokisch H.; Xie L.; Li Y.; Wichmann H. E.; Peters A.; Kronenberg F.; Suhre K.; Adamski J.; Illig T.; Wang-Sattler R. Differences between human plasma and serum metabolite profiles. PLoS One 2011, 6, e21230. 10.1371/journal.pone.0021230. [DOI] [PMC free article] [PubMed] [Google Scholar]
- Saccenti E.; Hoefsloot H. C.; Smilde A. K.; Westerhuis J. A.; Hendriks M. M. Reflections on univariate and multivariate analysis of metabolomics data. Metabolomics 2014, 10, 361–374. 10.1007/s11306-013-0598-6. [DOI] [Google Scholar]
- Cakır T.; Hendriks M. M.; Westerhuis J. A.; Smilde A. K. Metabolic network discovery through reverse engineering of metabolome data. Metabolomics 2009, 5, 318–329. 10.1007/s11306-009-0156-4. [DOI] [PMC free article] [PubMed] [Google Scholar]
- Kaduk M.; Hoefsloot H. C. J.; Vis D. J.; Reijmers T.; van der Greef J.; Smilde A. K.; Hendriks M. M. W. B. Correlated measurement error hampers association network inference. J. Chromatogr. B: Anal. Technol. Bimed. Life Sci. 2014, 966, 93–99. 10.1016/j.jchromb.2014.04.048. [DOI] [PubMed] [Google Scholar]
- Dileo M. V.; Strahan G. D.; den Bakker M.; Hoekenga O. A. Weighted correlation network analysis (wgcna) applied to the tomato fruit metabolome. PLoS One 2011, 6, e26683. 10.1371/journal.pone.0026683. [DOI] [PMC free article] [PubMed] [Google Scholar]
- Ursem R.; Tikunov Y.; Bovy A.; van Berloo R.; van Eeuwijk F. A correlation network approach to metabolic data analysis for tomato fruits. Euphytica 2008, 161, 181–193. 10.1007/s10681-008-9672-y. [DOI] [Google Scholar]
- Margolin A. A.; Nemenman I.; Basso K.; Wiggins C.; Stolovitzky G.; Favera R. D.; Califano A. ARACNE: An algorithm for the reconstruction of gene regulatory networks in a mammalian cellular context. BMC Bioinf. 2006, 7, s7–s7. 10.1186/1471-2105-7-S1-S7. [DOI] [PMC free article] [PubMed] [Google Scholar]
- Faith J. J.; Hayete B.; Thaden J. T.; Mogno I.; Wierzbowski J.; Cottarel G.; Kasif S.; Collins J. J.; Gardner T. S. Large-scale mapping and validation of Escherichia coli transcriptional regulation from a compendium of expression profiles. PLOS Biol. 2007, 5, e8. 10.1371/journal.pbio.0050008. [DOI] [PMC free article] [PubMed] [Google Scholar]
- Bernini P.; Bertini I.; Luchinat C.; Tenori L.; Tognaccini A. The cardiovascular risk of healthy individuals studied by NMR metabonomics of plasma samples. J. Proteome Res. 2011, 10, 4983–4992. 10.1021/pr200452j. [DOI] [PubMed] [Google Scholar]
- Bernini P.; Bertini I.; Luchinat C.; Nincheri P.; Staderini S.; Turano P. Standard operating procedures for pre-analytical handling of blood and urine for metabolomic studies and biobanks. J. Biomol. NMR 2011, 49, 231–243. 10.1007/s10858-011-9489-1. [DOI] [PubMed] [Google Scholar]
- Barton R. H.; Waterman D.; Bonner F. W.; Holmes E.; Clarke R.; Nicholson J. K.; Lindon J. C. The influence of EDTA and citrate anticoagulant addition to human plasma on information recovery from NMR-based metabolic profiling studies. Mol. Biosyst. 2009, 6, 215–224. 10.1039/b907021d. [DOI] [PubMed] [Google Scholar]
- Ward J. L.; Baker J. M.; Miller S. J.; Deborde C.; Maucourt M.; Biais B.; Rolin D.; Moing A.; Moco S.; Vervoort J.; et al. An inter-laboratory comparison demonstrates that [1H]-NMR metabolite fingerprinting is a robust technique for collaborative plant metabolomic data collection. Metabolomics 2010, 6, 263–273. 10.1007/s11306-010-0200-4. [DOI] [PMC free article] [PubMed] [Google Scholar]
- Dumas M.-E.; Maibaum E. C.; Teague C.; Ueshima H.; Zhou B.; Lindon J. C.; Nicholson J. K.; Stamler J.; Elliott P.; Chan Q.; Holmes E. Assessment of analytical reproducibility of 1H NMR spectroscopy based metabonomics for large-scale epidemiological research: the intermap study. Anal. Chem. 2006, 78, 2199–2208. 10.1021/ac0517085. [DOI] [PMC free article] [PubMed] [Google Scholar]
- Beckonert O.; Keun H. C.; Ebbels T. M. D.; Bundy J.; Holmes E.; Lindon J. C.; Nicholson J. K. Metabolic profiling, metabolomic and metabonomic procedures for NMR spectroscopy of urine, plasma, serum and tissue extracts. Nat. Protoc. 2007, 2, 2692–2703. 10.1038/nprot.2007.376. [DOI] [PubMed] [Google Scholar]
- Gallo V.; Intini N.; Mastrorilli P.; Latronico M.; Scapicchio P.; Triggiani M.; Bevilacqua V.; Fanizzi P.; Acquotti D.; Airoldi C.; et al. Performance assessment in fingerprinting and multi component quantitative NMR analyses. Anal. Chem. 2015, 87, 6709–6717. 10.1021/acs.analchem.5b00919. [DOI] [PubMed] [Google Scholar]
- Holle R.; Happich M.; Löwel H.; Wichmann H. E. KORA - a research platform for population based health research. Gesundheitswesen 2005, 67, 19–25. 10.1055/s-2005-858235. [DOI] [PubMed] [Google Scholar]
- Döring A.; Gieger C.; Mehta D.; Gohlke H.; Prokisch H.; Coassin S.; Fischer G.; Henke K.; Klopp N.; Kronenberg F.; et al. SLC2A9 influences uric acid concentrations with pronounced sex-specific effects. Nat. Genet. 2008, 40, 430–436. 10.1038/ng.107. [DOI] [PubMed] [Google Scholar]
- Römisch-Margl W.; Prehn C.; Bogumil R.; Röhring C.; Suhre K.; Adamski J. Procedure for tissue sample preparation and metabolite extraction for high-throughput targeted metabolomics. Metabolomics 2012, 8, 133–142. 10.1007/s11306-011-0293-4. [DOI] [Google Scholar]
- Eibl G.; Bernardo K.; Koal T.; Ramsay S. L.; Weinberger K. M.; Graber A. Isotope correction of mass spectrometry profiles. Rapid Commun. Mass Spectrom. 2008, 22, 2248–2252. 10.1002/rcm.3591. [DOI] [PubMed] [Google Scholar]
- Suarez-Diez M.; Saccenti E. Effects of sample size and dimensionality on the performance of four algorithms for inference of association networks in metabonomics. J. Proteome Res. 2015, 14, 5119. 10.1021/acs.jproteome.5b00344. [DOI] [PubMed] [Google Scholar]
- Meyer P.; Lafitte F.; Bontempi G. minet: A R/bioconductor package for inferring large transcriptional networks using mutual information. BMC Bioinf. 2008, 9, 461. 10.1186/1471-2105-9-461. [DOI] [PMC free article] [PubMed] [Google Scholar]
- Saccenti E.; Menichetti G.; Ghini V.; Remondini D.; Tenori L.; Luchinat C. Entropy-based network representation of the individual metabolic phenotype. J. Proteome Res. 2016, 15, 3298–3307. 10.1021/acs.jproteome.6b00454. [DOI] [PubMed] [Google Scholar]
- Camacho D.; de la Fuente A.; Mendes P. The origin of correlations in metabolomics data. Metabolomics 2005, 1, 53–63. 10.1007/s11306-005-1107-3. [DOI] [Google Scholar]
- Schott J. R.Matrix Analysis for Statistics; Wiley: Hoboken, NJ, 2005. [Google Scholar]
- Xia J.; Sinelnikov I. V.; Han B.; Wishart D. S. Metaboanalyst 3.0—making metabolomics more meaningful. Nucleic Acids Res. 2015, 43, W251. 10.1093/nar/gkv380. [DOI] [PMC free article] [PubMed] [Google Scholar]
- Stolovitzky G.; Prill R. J.; Califano A. Lessons from the Dream2 challenges. Ann. N. Y. Acad. Sci. 2009, 1158, 159–195. 10.1111/J.1749-6632.2009.04497.x. [DOI] [PubMed] [Google Scholar]
- Barri T.; Dragsted L. O. UPLC-ESI-QTOF/MS and multivariate data analysis for blood plasma and serum metabolomics: effect of experimental artefacts and anticoagulant. Anal. Chim. Acta 2013, 768, 118–128. 10.1016/J.acA.2013.01.015. [DOI] [PubMed] [Google Scholar]
- Bonferroni C. E.Il calcolo delle assicurazioni su gruppi di teste. In In Studi in Onore del Professore Salvatore Ortu Carbon, 1935; pp 13–60. [Google Scholar]
- Friston K. Ten ironic rules for non-statistical reviewers. NeuroImage 2012, 61, 1300–1310. 10.1016/j.neuroimage.2012.04.018. [DOI] [PubMed] [Google Scholar]
- Lindley D. V. A statistical paradox. Biometrika 1957, 44, 187–192. 10.1093/biomet/44.1-2.187. [DOI] [Google Scholar]
- Ioannidis J. P. Why most published research findings are false. PLOS Medicine 2005, 2, e124. 10.1371/journaL.pmed.0020124. [DOI] [PMC free article] [PubMed] [Google Scholar]
- Breier M.; Wahl S.; Prehn C.; Fugmann M.; Ferrari U.; Weise M.; Banning F.; Seissler J.; Grallert H.; Adamski J.; Lechner A. Targeted metabolomics identifies reliable and stable metabolites in human serum and plasma samples. PLoS One 2014, 9, e89728. 10.1371/journal.pone.0089728. [DOI] [PMC free article] [PubMed] [Google Scholar]
- Leek J. T.; Scharpf R. B.; Bravo H. C.; Simcha D.; Langmead B.; Johnson W. E.; Geman D.; Baggerly K.; Irizarry R. A. Tackling the widespread and critical impact of batch effects in high-throughput data. Nat. Rev. Genet. 2010, 11, 733–739. 10.1038/nrg2825. [DOI] [PMC free article] [PubMed] [Google Scholar]
- Jauhiainen A.; Madhu B.; Narita M.; Narita M.; Griffiths J.; Tavaré S. Normalization of metabolomics data with applications to correlation maps. Bioinformatics 2014, 30, 2155–2161. 10.1093/bioinformatics/btu175. [DOI] [PubMed] [Google Scholar]
- Karakach T. K.; Wentzell P. D.; Walter J. A. Characterization of the measurement error structure in 1D 1H NMR data for metabolomics studies. Anal. Chim. Acta 2009, 636, 163–174. 10.1016/j.aca.2009.01.048. [DOI] [PubMed] [Google Scholar]
- Coombes K. R.; Koomen J. M.; Baggerly K. A.; Morris J. S.; Kobayashi R. Understanding the characteristics of mass spectrometry data through the use of simulation. Cancer Inf. 2005, 1, 41–52. [PMC free article] [PubMed] [Google Scholar]
- Saccenti E. Correlation patterns in experimental data are affected by normalization procedures: consequences for data analysis and network inference. J. Proteome Res. 2017, 16, 619–634. 10.1021/acs.jproteome.6b00704. [DOI] [PubMed] [Google Scholar]
- Szymanski J.; Jozefczuk S.; Nikoloski Z.; Selbig J.; Nikiforova V.; Catchpole G.; Willmitzer L. Stability of metabolic correlations under changing environmental conditions in escherichia coli – a systems approach. PLoS One 2009, 4, e7441. 10.1371/journal.pone.0007441. [DOI] [PMC free article] [PubMed] [Google Scholar]
- Yao P.; Fox P. L. Aminoacyl-tRNA synthetases in medicine and disease. EMBO Molecular Medicine 2013, 5, 332–343. 10.1002/emmM.201100626. [DOI] [PMC free article] [PubMed] [Google Scholar]
- Park S. G.; Schimmel P.; Kim S. Aminoacyl tRNA synthetases and their connections to disease. Proc. Natl. Acad. Sci. U. S. A. 2008, 105, 11043–11049. 10.1073/pnaS.0802862105. [DOI] [PMC free article] [PubMed] [Google Scholar]
- Noguchi Y.; Zhang Q.-W.; Sugimoto T.; Furuhata Y.; Sakai R.; Mori M.; Takahashi M.; Kimura T. Network analysis of plasma and tissue amino acids and the generation of an amino index for potential diagnostic use. Am. J. Clin. Nutr. 2006, 83, 513s–519s. [DOI] [PubMed] [Google Scholar]
- Fischer S. Analysis of cardiovascular eicosanoids in man with special reference to HPLC. Chromatographia 1986, 22, 416–420. 10.1007/BF02268802. [DOI] [Google Scholar]
Associated Data
This section collects any data citations, data availability statements, or supplementary materials included in this article.


