

Abstract
Transthoracic echocardiography (TTE) is a practical and widely used tool for risk stratification in pulmonary arterial hypertension (PAH). We hypothesized that right atrial (RA) reservoir function, represented by peak RA systolic strain, correlates with invasive hemodynamic measurements and clinical outcomes in PAH. Patients with group 1 PAH who had TTE within 6 months of index PAH clinic visit and right heart catheterization were included in this retrospective study. Peak RA strain in the 2D apical 4-chamber view was measured with speckle-tracking software. The primary endpoint was a composite of prostacyclin initiation, lung transplantation, and death. RA strain was also measured in healthy control subjects. Among the 37 patients studied, 25 (68%) met the primary endpoint. RA strain was significantly lower among patients who met the primary endpoint than among those who did not (mean 20% vs. 33%, P = 0.002). Strain was lower in PAH patients than in controls (mean 24% vs. 35%, P = 0.0001). RA strain correlated negatively with hemodynamic data including RA pressure (R = −0.31), mean pulmonary arterial pressure (R = −0.33), and pulmonary vascular resistance (R = −0.39), and positively with cardiac index (R = 0.44). In receiver operating characteristic analysis to distinguish between patients meeting the primary endpoint and event-free survivors, RA strain was not significantly different from RA volume, right ventricular (RV) fractional area change, RV basal diameter, or right ventricular systolic pressure (area under the curve 0.82, 0.81, 0.83, 0.86, and 0.97, respectively). Our results demonstrate that RA strain is predictive of clinical outcomes in PAH. Further research is needed to determine if RA strain is independently associated with outcomes in this population.
Keywords: Pulmonary hypertension, Right atrium, Strain, Speckle tracking, Echocardiography
Introduction
Transthoracic echocardiography (TTE) is a practical and invaluable tool for risk stratification in pulmonary arterial hypertension (PAH). Right ventricular (RV) dysfunction is a well-established indicator of poor prognosis in this patient population [1]. While right atrial dilation has also been established as a marker of adverse outcomes in PAH [2, 3], right atrial mechanics remain relatively understudied. Like left atrial function, right atrial function has three components: reservoir, filling during ventricular systole and atrial diastole; conduit, allowing blood to flow passively into the ventricle; and pump, actively pushing blood into the right ventricle [4]. RA strain, as measured by TTE with speckle tracking, provides an accurate measure of all three components of RA function, including the reservoir function which we are most interested in. We hypothesized that RA strain would correlate with clinical outcomes and invasive hemodynamic parameters in PAH.
Methods
Patient selection
Charts of patients seen for initial visits in the University of Michigan Pulmonary Hypertension Clinic between 2009 and 2011 were reviewed. Patients with a clinical diagnosis of group 1 PAH, who had TTE performed in this institution’s adult echocardiography laboratory and underwent right heart catheterization (RHC) within 6 months of the initial clinic visit, and had pulmonary artery occlusion pressure ≤ 15 mmHg on RHC were eligible for inclusion in the study. Data obtained from RHC reports included intracardiac filling pressures, pulmonary vascular resistance (PVR), and Fick cardiac index (calculated based on oxygen saturations and the patient’s body surface area). All TTEs images were acquired with Philips (Andover, Massachusetts) echocardiography machines. Patients with group 1 PAH due to congenital heart disease were excluded, given the concern that atrial mechanics could be uniquely altered in patients with underlying structural heart disease such as atrial septal defects. Patients with insufficient TTE image quality for RA strain analysis were excluded. The institutional review board at the University of Michigan approved the study.
Image review and analysis
All TTE studies were reviewed by an expert echocardiographer (N.B.) For RA strain measurement, the apical 4-chamber view in which the RA free wall was best visualized was selected. Frame rates were generally in the 40–80 Hz range. Peak RA strain was measured using speckle-tracking software (Fig. 1; Epsilon Imaging, Ann Arbor, Michigan). This software, which is non-vendor specific and may be used with any B-mode DICOM images, has previously been used to measure strain of all 4 cardiac chambers [5, 6]. The zero-strain reference point was set at the QRS (end-diastole), and peak RA strain was measured at end-systole; using this method, the peak RA strain represents the reservoir function of the right atrium. The speckle-tracking program made no geometric assumptions about the chamber being evaluated. Following manual tracing, the right atrial wall was automatically divided into six segments by the software. Each video clip was reviewed after tracing to ensure appropriate tracking, and any segments not tracking appropriately were excluded from analysis. If more than two of the six segments were not tracking appropriately, the study was excluded from the final data analysis. The software provided an averaged curve of all the included segments, and the peak RA strain was measured from this curve. To allow for assessment of interobserver variability, a second cardiologist (S.V.), blinded to the results of the initial RA strain analysis, measured peak RA strain in a subset of patients. Intraobserver variability was also assessed; initial and repeat strain measurements were made several months apart.
Fig. 1.

Right atrial strain assessment with 2D speckle-tracking in the apical 4-chamber view. The atrium is divided into six segments. a End ventricular systole. b End ventricular diastole. c Atrial strain versus time (in seconds). Each of the 6 segments is represented as a solid line, and average strain is represented by the dotted green line. d Corresponding ECG tracing. The dotted yellow marker indicates that this still frame was captured at end-systole
When apical 4-chamber images providing technically adequate RV endocardial definition were available, RV free-wall longitudinal strain was measured, using the same speckle-tracking software as described above. Standard 2D TTE parameters of right heart size and function, including RV diameters, RV fractional area change, and RA volume (based on the method of disks, as traced at end-ventricular systole in the apical 4-chamber view) were also measured. Tricuspid annular plane systolic excursion (TAPSE) and tissue Doppler systolic excursion of the tricuspid annulus (S’) were measured when appropriate images were available. Tricuspid regurgitation was evaluated qualitatively and graded according to the following scale: Trace = 1, mild = 2, moderate = 3, severe = 4. Right ventricular systolic pressure (RVSP) was estimated based on the sum of the peak tricuspid regurgitation velocity (using the modified Bernoulli equation) and the estimated RA pressure based on inferior vena cava diameter measurement and change in response to inspiration.
Statistical analysis
The primary endpoint was a composite of prostacyclin therapy initiation, lung transplantation, and death. Continuous variables were expressed as mean ± standard deviation (SD), and nominal variables were presented as numbers and/or percentages. Correlations between peak RA strain and RHC hemodynamic parameters including RA pressure, mean pulmonary artery (PA) pressure, cardiac index, and PVR were evaluated with simple linear regression. Receiver operating characteristic (ROC) analysis was performed for prediction of clinical outcome based on several echocardiographic parameters, and results were expressed as area under the curve (AUC). A multivariate model was constructed to determine if peak RA strain and other echocardiographic variables were independently associated with outcomes. A Bland–Altman plot was constructed to illustrate interobserver variability in RA strain measurements. Statistical analyses were performed with Stata (StataCorp, College Station, Texas) and Excel (Microsoft Corporation, Redmond, Washington).
Results
Of the 63 patients who met the clinical inclusion criteria, 25 were excluded for suboptimal image quality for RA strain analysis; 37 patients were included in the study. The mean age of subjects was 55.9 ± 13.1 years, and 29 (78%) were female. A majority of subjects (22 patients, 59%) had idiopathic PAH, and 7 patients (19%) had scleroderma-associated PAH. Most had advanced symptomatology at the time of the initial clinic visit; 25 patients (68%) were categorized as World Health Organization functional class III or IV. Excluded patients were also most likely to have idiopathic or scleroderma-associated PAH (8 patients, 32% and 10 patients, 40%, respectively) and were similarly symptomatic; 18 (72%) were categorized as World Health Organization functional class III or IV. For patients included in the analysis, a mean 53.8 ± 47.6 days elapsed between TTE and RHC. On RHC, 15 patients (41%) were in a low-output state, with cardiac index <2.2 L min/m2. Further demographic and clinical data on included patients are presented in Table 1.
Table 1.
Patient demographics, comorbidities, functional class, and right heart catheterization results (N = 37)
| Age (year ± SD) | 55.9 ± 13.1 |
|---|---|
| Female (%) | 78 |
| Systemic HTN (%) | 57 |
| Diabetes mellitus (%) | 11 |
| Obesity (%) | 32 |
| PAH etiology | Idiopathic: 22 (59%) |
| Scleroderma: 7 (19%) | |
| Portopulmonary: 4 (11%) | |
| Other: 4 (11%) | |
| WHO functional class at initial clinic visit | Class I: 3 (8%) |
| Class II: 8 (22%) | |
| Class III: 17 (46%) | |
| Class IV: 8 (22%) | |
| Not specified: 1 (3%) | |
| Medications at initial visit | Loop diuretics: 11 (30%) |
| Thiazide-type diuretics: 4 (11%) | |
| Potassium-sparing diuretics: 1 (3%) | |
| Calcium-channel blockers: 13 (35%) | |
| Beta-blockers: 6 (16%) | |
| ACE inhibitors: 8 (22%) | |
| Angiotensin receptor blockers: 2 (5%) | |
| Nitrates: 2 (5%) | |
| PDE5 inhibitors: 5 (14%) | |
| Prostacyclins (oral treprostinil): 1 (3%)a | |
| Endothelin receptor antagonists: 1 (3%) | |
| Medications not specified: 1 (3%) | |
| 6-min walk distance (m) | 296 ± 135 |
| RA pressure (mmHg) | 9.7 ± 4.5 |
| Mean PA pressure (mmHg) | 45.5 ± 14.1 |
| Fick cardiac index (L/min/m2) | 2.5 ± 0.7 |
| PVR (Wood Units) | 8.7 ± 5.5 |
SD standard deviation, HTN hypertension, WHO World Health Organization, PDE5 phosphodiesterase 5, ACE angiotensin-converting enzyme, RA right atrial, PA pulmonary artery, PVR pulmonary vascular resistance. “Other” causes of PAH included exercise-induced, anorexigen-induced, and familial PAH, and pulmonary capillary hemangiomatosis
This patient was not considered to have met the endpoint of prostacyclin initiation, though he did meet the primary composite endpoint, as he died during the follow-up period
RA strain was analyzed in all included patients as well as 14 healthy volunteer control subjects. Although the control subjects were not specifically age- or gender-matched to patients, they were not significantly different in age from patients (mean age 57.6 ± 6.2 year, P = 0.53 for intergroup comparison), and most were female (12 patients, 86%, P = 0.54). Over a mean 5.3 ± 0.7 years of follow up, 25 patients (68%) met the primary composite endpoint. Among patients who met the primary endpoint, RA strain was significantly lower than among those who did not (mean 20 ± 10% vs. 33 ± 11%, P = 0.002; Fig. 2). Over the follow-up period, 20 patients (54%) died. There was a trend toward greater RA strain among patients who survived vs. those who died, though this difference was not statistically significant (mean 28 ± 11% vs. 20 ± 12%, P = 0.06). Patients not started on prostacyclins had significantly higher RA strain than those who were started on prostacyclins (mean 29% ± 12% vs. 19% ± 9%, P = 0.009). One patient underwent bilateral lung transplantation. This patient’s RA strain was 24%, which was equivalent to both the mean and the median RA strain of all PAH subjects.
Fig. 2.
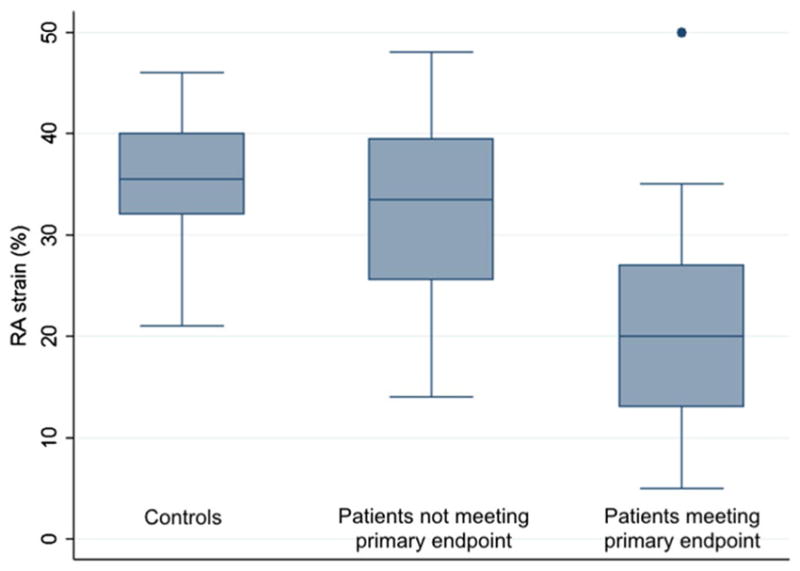
Right atrial strain in controls and patients. Among patients who met the primary endpoint, RA strain was significantly lower than among patients who did not (mean 20 ± 10% vs. 33 ± 11%, P = 0.002). Patients who did not meet the primary endpoint did not have significantly lower strain than controls (mean 33 ± 11% vs. 35 ± 7%; P = 0.45)
RA strain was significantly lower in PAH patients than in controls (mean 24 ± 12% vs. 35 ± 7%, P = 0.0001). This difference was driven largely by lower strain in patients who met the primary endpoint (P < 0.0001 for comparison with controls), as patients who did not meet the primary endpoint did not have significantly lower strain than controls (P = 0.45).
Patients in WHO functional class I and II at the initial visit had significantly higher RA strain than patients in WHO functional class III and IV (33% vs. 21%, P = 0.006). A majority of subjects (20 patients, 54%) did not experience a change in functional class between the initial visit and the final clinical assessment. RA strain did not differ significantly among patients with unchanged, improved, and worsened WHO class (26% vs. 20% vs. 25%, respectively; P = NS for all 3 comparisons).
RA strain correlated modestly with invasive hemodynamic data, exhibiting a negative correlation with RA pressure (R = −0.31), mean PA pressure (R = −0.33), and PVR (R = −0.39), and a positive correlation with cardiac index (R = 0.44; Fig. 3).
Fig. 3.

Correlations between right atrial strain and invasive hemodynamic parameters. a Right atrial (RA) pressure. b Pulmonary vascular resistance (PVR). c Mean pulmonary artery (PA) pressure. d Fick cardiac index
RA strain correlated negatively with RA volume to a modest degree (R = −0.48; Fig. 4). RA volume was significantly larger in patients who met the primary endpoint than in patients who did not (90 ± 35 mL vs. 62 ± 22 mL, P = 0.006), although patients not meeting the primary endpoint did not have significantly greater RA volumes than controls (controls 51 ± 18 mL, P = 0.19 for comparison; Fig. 5). RA volume correlated negatively with Fick cardiac index (R = −0.53), and positively with RA pressure (R = 0.34), mean PA pressure (R = 0.44), and PVR (R = 0.47).
Fig. 4.
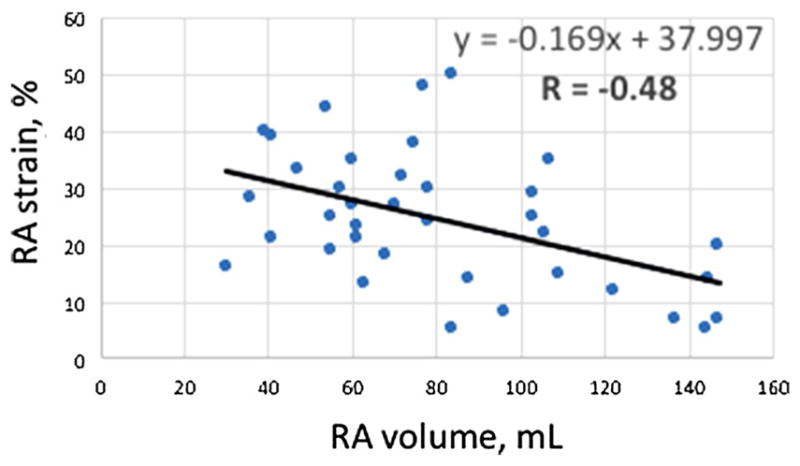
Correlation between right atrial strain and right atrial volume
Fig. 5.
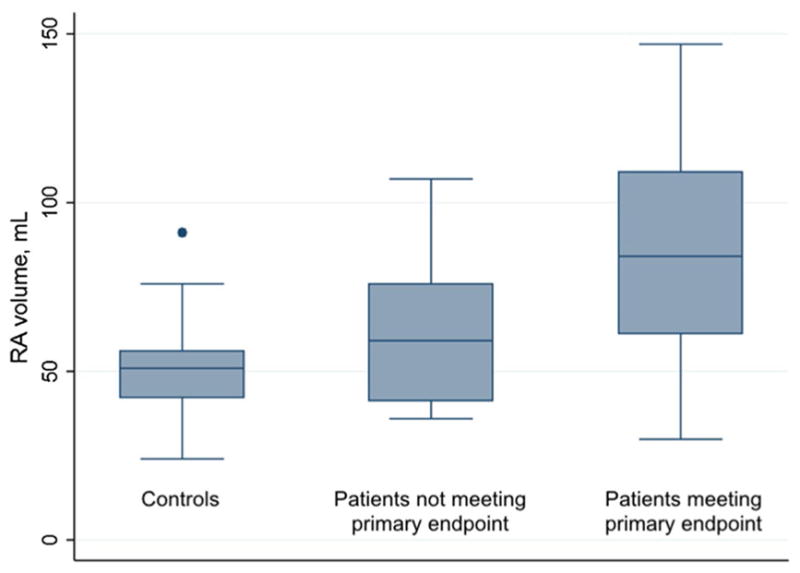
Right atrial volume in controls and patients. RA volume was significantly larger in patients who met the primary endpoint than in patients who did not (90 ± 35 mL vs. 62 ± 22 mL, P = 0.006), although patients not meeting the primary endpoint did not have significantly greater RA volumes than controls (controls 51 ± 18 mL, P = 0.19 for comparison)
Relationships between other standard TTE variables and outcomes were examined. In terms of RV size, RV basal diameter was significantly larger in patients meeting the primary endpoint (45.2 ± 7.3 mm vs. 35.9 ± 11.0 mm, P = 0.02). RV mid-cavity diameter and RV diastolic area showed a trend toward being larger in patients meeting the primary endpoint, but these differences did not reach statistical significance (mid-cavity diameter 35.9 ± 8.2 mm vs. 27.8 ± 12.1 mm, P = 0.06; area 22.8 ± 6.4 cm2 vs. 18.9 ± 6.3 cm2, P = 0.11). With regard to RV function, RV fractional area change was lower in patients meeting the primary endpoint (23.6 ± 13.2% vs. 36.4 ± 12.1%, P = 0.01). Appropriate images for measurement of TAPSE and S’ were available for only 15 and 13 patients, respectively. Both variables showed a trend toward being lower in patients who met the primary endpoint, but these differences did not reach statistical significance (TAPSE 13.9 ± 5.3 vs. 19.5 ± 4.4, P = 0.08; S’ 11.4 ± 5.1 cm/s vs. 14.7 ± 5.3 cm/s, P = 0.08). Tricuspid regurgitation grade was greater in patients who met the primary endpoint (2.9 ± 0.9 vs. 1.6 ± 0.7, P < 0.0001). Estimated RVSP was measurable in 32 subjects (86%) and was higher in patients who met the primary endpoint (82.5 ± 22.6 vs. 43.7 ± 14.8, P < 0.00001).
RV free-wall strain was measurable in 17 patients (46%). Patients who met the primary endpoint exhibited a trend toward higher strain values (i.e., lower strain magnitudes) than patients who did not, but this difference was not statistically significant (mean strain -13.7 ± 9.0% vs. −19.6 ± 7.7%, P = 0.20). Table 2 summarizes clinical and echocardiographic data based on the primary endpoint.
Table 2.
Clinical and echocardiographic data for patients who did and did not meet the primary composite endpoint
| Met endpoint | Did not meet endpoint | P value | |
|---|---|---|---|
| Age (year ± SD) | 56.4 ± 13.9 | 54.9 ± 11.8 | 0.74 |
| Female (%) | 84 | 67 | 0.30 |
| WHO functional class at initial visit: Class III–IV (%) | 80 | 42 | 0.02 |
| 6-min walk distance (m) | 244 ± 122 | 404 ± 91 | 0.0001 |
| RA pressure (mmHg) | 10.6 ± 4.8 | 7.8 ± 3.3 | 0.05 |
| Mean PA pressure (mmHg) | 50.6 ± 12.9 | 35.0 ± 10.5 | 0.0006 |
| Fick cardiac index (L/min/m2) | 2.3 ± 0.6 | 3.0 ± 0.6 | 0.003 |
| PVR (Wood Units) | 10.8 ± 5.2 | 3.8 ± 2.2 | 0.000002 |
| RA strain (%) | 20 ± 10 | 33 ± 11 | 0.002 |
| RA volume (mL) | 90 ± 35 | 62 ± 22 | 0.006 |
| RV basal diameter (mm) | 45.2 ± 7.3 | 35.9 ± 11.0 | 0.02 |
| RV fractional area change (%) | 23.6 ± 13.2 | 36.4 ± 12.1 | 0.01 |
| TAPSE (mm) | 13.9 ± 5.3 | 19.5 ± 4.4 | 0.08 |
| S’ (cm/s) | 11.4 ± 5.1 | 14.7 ± 5.3 | 0.08 |
| TR gradea | 2.9 ± 0.9 | 1.6 ± 0.7 | 0.00004 |
| RVSP (mmHg) | 82.5 ± 22.6 | 43.7 ± 14.8 | 0.000009 |
| RV free-wall strain (%) | –13.7 ± 9.0% | –19.6 ± 7.7% | 0.20 |
SD standard deviation, WHO World Health Organization, RA right atrial, PA pulmonary artery, PVR pulmonary vascular resistance, RV right ventricular, TAPSE tricuspid annular plane systolic excursion, S’, tissue Doppler systolic excursion of the tricuspid annulus, TR tricuspid regurgitation, RVSP right ventricular systolic pressure as estimated on echocardiography
TR was graded according to the following scale: trace = 1, mild = 2, moderate = 3, severe = 4
In ROC analysis to distinguish between patients meeting the primary endpoint and event-free survivors, RA strain was not significantly different from RA volume, RV fractional area change, RV basal diameter, or RVSP (AUC 0.82, 0.81, 0.83, 0.86, and 0.97, respectively; P = 0.16 for difference; Fig. 6), in the subset of 29 patients who had useable measurements for all of these parameters. Among the 32 patients who had useable RVSP data, RVSP outperformed RA strain in ROC analysis (AUC 0.93 vs. 0.78, respectively), though this difference did not meet statistical significance (P = 0.06). In a logistic regression model including these 2D TTE variables, neither RA strain nor any of the other parameters was independently predictive of the primary endpoint by the Breusch-Pagan test of independence.
Fig. 6.
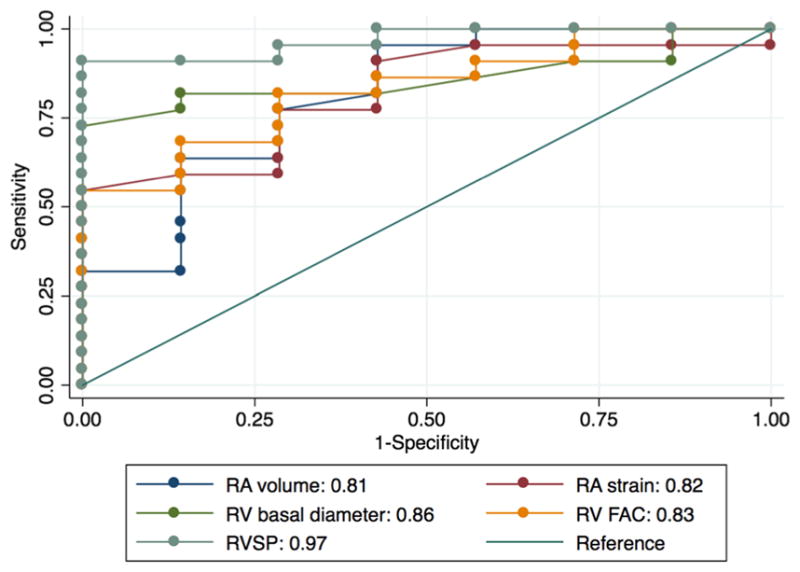
Receiver operating characteristic analysis. RA strain performed similarly compared to RA volume, RV fractional area change, and RV basal diameter
Interobserver variability was assessed for RA strain measurement in a subset of 19 patients. Intraclass correlation coefficient (ICC) was 0.97, and bias between observers was 6.0% (95% limits of agreement − 26.8 to 38.6%), indicating good interobserver agreement (Fig. 7). Intraobserver variability was assessed based on a group of 15 patients and was excellent, with ICC 0.99, and bias 1.4% (95% limits of agreement − 20.3–23.1%).
Fig. 7.

Bland–Altman plot illustrating interobserver variability in RA strain measurements. SD, standard deviation evident. If the former is true, analysis of RA mechanics may be useful in screening at-risk patients for PAH [12].
Discussion
Our results demonstrate that RA reservoir function, as measured by 2D TTE speckle tracking strain, is predictive of clinical outcomes and invasive hemodynamic parameters in group I PAH. We have shown that RA strain is a reproducible parameter, readily measurable on standard TTE images. PAH patients who did not have adverse outcomes during the follow-up period had RA volumes and RA strain values that were not significantly different from controls. It is possible that these patients were diagnosed and treated earlier in the disease process than patients who experienced adverse outcomes, such that significant right heart remodeling had not yet occurred.
No longer the “forgotten chamber,” the right atrium is now receiving more attention in the PAH and echocardiography literature. Our findings add to a small but growing body of work illustrating the prognostic importance of RA size and function in this patient population [7–9]. Haddad and colleagues have shown that severe RA enlargement, defined as > 40% increase in volume above reference value, is an independent predictor of adverse outcomes in PAH [2]. In treatment-naïve group 1 PAH patients, Brunner et al. found that reduced right atrial total emptying fraction, which corresponds to RA reservoir function, and active emptying fraction, which corresponds to RA pump function, are associated with mortality [10]. In the subset of their subjects who had follow-up TTEs, improvements in these parameters correlated with improvements in 6-min walk distance. Fukuda and colleagues reported that in a cohort of patients with group 1 and group 4 pulmonary hypertension, the sum of RA strain (sum of 3 strain values representing RA reservoir, conduit, and pump function) improved prediction of clinical outcomes when added to a Cox regression model based on hemodynamic parameters and RV free-wall strain [11]. This model did not incorporate RA volume, however.
As we and others [8] have shown that RA strain and RA volume are correlated, it remains to be seen whether RA strain is independently predictive of clinical outcomes in PAH, beyond measurements of RA size and estimated RVSP. Furthermore, it is not yet clear whether poor RA reservoir and pump function may be a harbinger of PAH in asymptomatic patients with ostensibly normal RV size and systolic function, or whether they are largely a consequence of altered hemodynamics in PAH that is already clinically
In some of our subjects and controls with relatively vigorous tricuspid annular motion, speckle tracking of the RA free wall segment adjacent to the tricuspid valve (the green segment as depicted in Fig. 1) was adversely affected. In these cases, this segment was excluded from analysis. Aside from technical considerations, this observation emphasizes the idea that the RA and RV do not act in isolation. Further studies will be needed to understand how RA-RV coupling may affect outcomes in PAH.
Limitations
This was a single-center study, limited by small sample size. As we performed a retrospective analysis based on TTE data acquired for clinical purposes, suboptimal image quality required us to exclude a number of patients, especially considering that RA strain analysis requires better image quality than RA size assessment. The requirement for high image quality may limit the utility of this technique in everyday clinical practice. However, we suspect that if images were acquired prospectively and RA-specific views were obtained, feasibility would be higher. In the images available to us, RV strain and TAPSE could not be measured consistently. A mean of approximately 2 months elapsed between TTE and RHC for our subjects. Because we had access to medication information at the time of the initial clinic visit but not at the time of TTE (and not always at the time of RHC), it was not possible to analyze the potential impact of interim medication changes on our results. We evaluated only the initial TTE for each patient, so we were not able to assess changes in RA mechanics in response to therapy.
Conclusion
In our cohort of PAH patients, reduced RA speckle-tracking strain was predictive of abnormal hemodynamics and adverse clinical outcomes over a several-year follow-up period. While RA strain assessment is straightforward and reproducible, larger studies are needed to determine whether RA strain has significant prognostic value when added to the simpler measurement of RA volume. Prospective, serial measurements of RA strain in PAH patients on disease-specific therapy will help determine whether improved RA function contributes to meaningful clinical recovery, independent of changes in RV size and function.
Footnotes
Compliance with ethical standards
Conflict of interests Drs. Bhave, Visovatti, and Kolias and Mr. Kulick report no conflict of interest relevant to this manuscript. Dr. McLaughlin acts as a consultant and/or receives support from Acte-lion, Arena, Bayer, Gilead, Steadymed, St. Jude Medical, and United Therapeutics.
References
- 1.McLaughlin V, Shah SJ, Souza R, Humbert M. Management of pulmonary arterial hypertension. J Am Coll Cardiol. 2015;65:1976–1997. doi: 10.1016/j.jacc.2015.03.540. [DOI] [PubMed] [Google Scholar]
- 2.Haddad F, Spruijt OA, Denault AY, Mercier O, Brunner N, Fur-man D, et al. Right heart score for predicting outcome in patients with idiopathic, familial or drug and toxin associated pulmonary arterial hypertension. JACC Cardiovasc Imaging. 2015;8:627–638. doi: 10.1016/j.jcmg.2014.12.029. [DOI] [PMC free article] [PubMed] [Google Scholar]
- 3.Bustamante-Labarta M, Perrone S, De La Fuente RL, Stutzbach P, De La Hoz RP, Torino A, Favaloro R. Right atrial size and tricuspid regurgitation severity predict mortality or transplantation in primary pulmonary hypertension. J Am Soc Echocardiogr. 2002;15:1160–1164. doi: 10.1067/mje.2002.123962. [DOI] [PubMed] [Google Scholar]
- 4.D’Alto M, Scognamiglio G, Dimopoulos K, Bossone E, Vizza D, Romeo E, et al. Right heart and pulmonary vessels structure and function. Echocardiography. 2015;32:S3–S10. doi: 10.1111/echo.12227. [DOI] [PubMed] [Google Scholar]
- 5.Addetia K, Takeuchi M, Maffessanti F, Nagata Y, Hamilton J, Mor-Avi V, Lang RM. Simultaneous longitudinal strain in all 4 cardiac chambers: a novel method for comprehensive functional assessment of the heart. Circ Cardiovasc Imaging. 2016;9:e003895. doi: 10.1161/CIRCIMAGING.115.003895. [DOI] [PubMed] [Google Scholar]
- 6.Farsalinos KE, Daraban AM, Unlu S, Thomas JD, Badano LP, Voigt JU. Head-to-head comparison of global longitudinal strain measurements among nine different vendors: the EACVI/ASE inter-vendor comparison study. J Am Soc Echocardiogr. 2015;28:1171–1181. doi: 10.1016/j.echo.2015.06.011. [DOI] [PubMed] [Google Scholar]
- 7.Sakata K, Uesugi Y, Isaka A, Minamishima T, Matsushita K, Satoh T, Yoshino H. Evaluation of right atrial function using right atrial speckle tracking analysis in patients with pulmonary artery hypertension. J Echocardiogr. 2016;14:30–38. doi: 10.1007/s12574-015-0270-4. [DOI] [PMC free article] [PubMed] [Google Scholar]
- 8.Querejeta Roca G, Campbell P, Claggett B, Solomon SD, Shah AM. Right atrial function in pulmonary arterial hypertension. Circ Cardiovasc Imaging. 2015;8:e003521. doi: 10.1161/CIRCIMAGING.115.003521. [DOI] [PMC free article] [PubMed] [Google Scholar]
- 9.Saha SK, Soderberg S, Lindqvist P. Association of right atrial mechanics with hemodynamics and physical capacity in patients with idiopathic pulmonary arterial hypertension: insight from a single-center cohort in northern Sweden. Echocardiography. 2016;33:46–56. doi: 10.1111/echo.12993. [DOI] [PubMed] [Google Scholar]
- 10.Brunner NW, Haddad F, Kobayashi Y, Hsi A, Swiston JR, Gin KG, Zamanian RT. Prognostic utility of right atrial emptying fractions in pulmonary arterial hypertension. Pulm Circ. 2015;5:473–480. doi: 10.1086/682218. [DOI] [PMC free article] [PubMed] [Google Scholar]
- 11.Fukuda Y, Tanaka H, Ryo-Koriyama K, Motoji Y, Sano H, Shimoura H, et al. Comprehensive functional assessment of right-sided heart using speckle tracking strain for patients with pulmonary hypertension. Echocardiography. 2016;33:1001–1008. doi: 10.1111/echo.13205. [DOI] [PubMed] [Google Scholar]
- 12.D’Andrea A, D’Alto M, Di Maio M, Vettori S, Benjamin N, Cocchia R, et al. Right atrial morphology and function in patients with systemic sclerosis compared to healthy controls: a two-dimensional strain study. Clin Rheumatol. 2016;35:1733–1742. doi: 10.1007/s10067-016-3279-9. [DOI] [PubMed] [Google Scholar]