

Abstract
Objectives
To determine the efficacy of 4 g/day fish oil to lower triglycerides and impact lipoprotein particles, inflammation, insulin resistance, coagulation, and thrombosis.
Study design
Participants (n = 42, age 14 ± 2 years) with hypertriglyceridemia and low-density lipoprotein (LDL) cholesterol <160 mg/dL were enrolled in a randomized, double-blind, crossover trial comparing 4 g of fish oil daily with placebo. Treatment interval was 8 weeks with a 4-week washout. Lipid profile, lipoprotein particle distribution and size, glucose, insulin, high-sensitivity C-reactive protein, interleukin-6, fibrinogen, plasminogen activator inhibitor-1, and thrombin generation were measured.
Results
Baseline lipid profile was total cholesterol 194 (5.4) mg/dL (mean [SE]), triglycerides 272 (21) mg/dL, high-density lipoprotein cholesterol 39 (1) mg/dL, and LDL cholesterol 112 (3.7) mg/dl. LDL particle number was 1614 (60) nmol/L, LDL size was 19.9 (1.4) nm, and large very low-density lipoprotein/chylomicron particle number was 9.6 (1.4) nmol/L. Triglycerides decreased on fish oil treatment but the difference was not significant compared with placebo (−52 ± 16 mg/dL vs −16 ± 16 mg/dL). Large very low-density lipoprotein particle number was reduced (−5.83 ± 1.29 nmol/L vs −0.96 ± 1.31 nmol/L; P < .0001). There was no change in LDL particle number or size. There was a trend towards a lower prothrombotic state (lower fibrinogen and plasminogen activator inhibitor-1; .10 > P > .05); no other group differences were seen.
Conclusions
In children, fish oil (4 g/day) lowers triglycerides slightly and may have an antithrombotic effect but has no effect on LDL particles.
As a consequence of the obesity epidemic, the prevalence of dyslipidemia characterized by increased levels of triglycerides and low levels of high-density lipoprotein (HDL) cholesterol has increased, with an overall prevalence of dyslipidemia of 42%, including increased triglycerides present in obese adolescents who represent 16.9% of the pediatric population.1 These dyslipidemic traits help characterize the metabolic syndrome, a phenotype associated with premature development of atherosclerosis, future type 2 diabetes mellitus, and premature cardiovascular disease in young adults.2–4 Adolescents with this dyslipidemia may have a discordant distribution of low-density lipoprotein (LDL) particles predicting risk greater than what would be predicted based on LDL cholesterol level alone.5 In childhood, obesity-related metabolic derangements are associated with nontraditional risk factors leading to an insulin-resistant, chronic inflammatory, and prothrombotic state.6
Fish oil (including docosahexaenoic acid [DHA] and eicosapentaenoic acid [EPA]) has emerged as a controversial treatment with potential benefit in the prevention of atherosclerotic vascular disease and sudden death; however, the underlying therapeutic mechanisms remain unclear. Although some adult clinical trials have shown a benefit of fish oil treatment on certain cardiovascular outcomes, recent meta-analyses, reviews, and clinical studies have questioned the benefit of 1 g/day or lower supplementation.7–10 Moderate doses of fish oil (4 g/day) are known to lower triglycerides; however, this effect alone may not be sufficient to explain clinical outcomes because the role of triglycerides per se in atherosclerosis progression has not been elucidated.11
In children and adolescents, there is a paucity of clinical trial data on treatment of increased triglycerides and on the cardiometabolic effects of fish oil in particular. Therefore, we conducted a multicenter, randomized, double-blind, placebo, crossover trial of 4 g daily of fish oil in adolescents with elevated triglycerides (>150 mg/dL). The primary end point was reduction in triglycerides with secondary aims of characterizing the LDL particle distribution of adolescents with increased triglycerides and assessing the impact of fish oil on lipid particle distribution and markers of inflammation, insulin resistance, coagulation, and thrombosis.
Methods
This study was approved by the Institutional Review Boards at A. I. DuPont Hospital for Children, Thomas Jefferson University, and Johns Hopkins University Hospital. Parental permission and child assent were obtained before enrollment. At A. I. DuPont Hospital for Children, Thomas Jefferson University, and Johns Hopkins University Hospital, adolescents seen in lipid referral clinics with the following characteristics were recruited: age 10–17 years, fasting triglyceride level of ≥150 mg/dL and <750 mg/dL on 2 separate occasions, and LDL cholesterol level <160 mg/dL. Exclusion criteria were any bleeding abnormality, diabetes mellitus, uncontrolled hypothyroidism, liver disease, allergy to fish/shellfish, chronic use of aspirin or anti-inflammatory agents, taking lipid-lowering medication; LDL cholesterol levels >160 mg/dL, smoking, alcohol use, pregnancy, or participation in another clinical trial. All 42 participants were Tanner 4 or greater. Racial/ethnic composition was white, non-Hispanic (36), white Hispanic (3), black (2), and other (1).
This randomized, double-blind, placebo, crossover trial consisted of two 8-week treatment periods, separated by a 4-week washout. Eligible patients were randomized to receive either fish oil 4 g daily or corn oil placebo during the first 8-week treatment period; patients received the alternate treatment during the next treatment period. GlaxoSmithKline supplied the study drug (containing minimally 1.5 g of DHA and 1.86 g of EPA of ethyl esters) and placebo.
Patients were evaluated at 6 time points: visit 1/baseline (week 0), visit 2/randomization (week 4), visit 3/after treatment 1 (week 12), visit 4/after washout (week 16), visit 5/after treatment 2 (week 24), and visit 6/close out (week 28). Patients were advised to maintain a stable diet and not alter baseline fish consumption. One participant took an oral contraceptive throughout the trial. Any fish oil supplements were discontinued. Advice on a heart-healthy diet was provided. Blood pressure (right arm sitting with appropriate sized cuff, taken 3 times, last measurement used), height, and weight were measured at the beginning of the study, after the first washout period, and close out. Participant phone contact was made during each treatment arm to assess diet stability. A fasting lipid profile was performed at every visit. Red blood cell fatty acid profile and secondary endpoints were measured at all visits except baseline. Secondary endpoints included measures of thrombin generation, high sensitivity C-reactive protein (CRP), interleukin-6 (IL-6), fibrinogen, and plasminogen activator inhibitor-1 (PAI-1). Lipid particle and apolipoprotein B (apo B) measurements were performed at baseline and at the end of each treatment arm. Glucose, insulin, alanine aminotransferase (ALT), and aspartate-aminotransferase (AST) were obtained at baseline and at the end of each treatment arm. Adverse events were recorded at all study encounters. Adverse events were graded mild, moderate, or severe. An independent data-and safety-monitoring physician reviewed all events and safety data biannually.
Lipid, lipoprotein, and lipoprotein particle analysis was performed by a commercial laboratory (Liposcience Inc; Raleigh, North Carolina) as were glucose, insulin, ALT, and AST. Red blood cell fatty acid profile was obtained commercially (OmegaQuant, Sioux Falls, South Dakota) to assess compliance and test the completeness of the washout between study arms. Thrombin generation was measured with a commercially available assay according to the guidelines of the manufacturer (Technothrombin-TGA; Technoclone, Vienna, Austria). Evaluation of thrombin generation was performed automatically via the manufacturer’s Technothrombin-TGA evaluation software and calculated as thrombin generation over time.
For analysis, the peak height for thrombin generation, velocity index, or peak rate of thrombin generation (peak thrombin/[peak time – lag time]) and the area under the curve, which is also referred to as the endogenous thrombin potential, were used. Fibrinogen and CRP were measured by immunonephelometry (Siemens Healthcare Diagnostics, Deerfield, Illinois). Enzyme-linked immunosorbent assays were used for the measurement of IL-6 (R&D Systems, Minneapolis, Minnesota) and PAI-1 (American Diagnostica, Greenwich, Connecticut). All measurements were performed in replicate.
Data Analyses
Study data were collected and managed using REDCAP electronic data capture tools hosted at A. I. DuPont Hospital for Children.12 The study was powered to detect a difference in triglycerides of 50 ± 20 mg/dL between groups. Demographics and baseline characteristics were summarized by treatment sequence and visits. Quantitative variables were summarized using mean and SE, and categorical variables were summarized by frequencies and percentages. A 2-sample t test was used to compare the mean baseline characteristics between treatment sequences, and the χ2 test was used to compare the distribution of categorical variables between treatment sequences. Mean (SE) change in red cell membrane fatty acids from baseline (in period 1) and washout baseline (in period 2) were evaluated by placebo and fish oil. In addition, overall mean changes were presented by placebo and fish oil groups.
A mixed-model, repeated-measures ANOVA was used to compare the mean change in red cell membrane fatty acid within as well as between the placebo and fish oil groups. The change from baseline or washout baseline values were used as the response variables, and period (pre- or postwashout), treatment sequence, and their interactions were used as factors in the model. Each of the models was adjusted for baseline values of the corresponding response variable. Subjects were used as a random factor and an unstructured (natural structure of within subject correlation) within-subject correlation was used for the modeling purpose. The same analyses were performed for lipids, lipoprotein particles, and thrombotic and inflammatory markers.
In addition to baseline values of the response variables, other variables such as age and sex were used in the latter models if found to be significant with the change in corresponding response variables. Mean and SE of lipids, some of the lipoproteins, and inflammatory markers were presented in graphic form. All tests were 2-tailed at the level of significance of .05. Comparisons were repeated after adjustment for body mass index and if the results were similar, these results were not reported. The statistical software SAS (version 9.3, SAS Institute, Cary, North Carolina) and SPSS (version 18.0, SPSS IBM Corporation, Armonk, New York) were used for data analysis.
Results
The cohort included 42 adolescents with a mean age of 14 ± 2 years; 13 of 42 were female. Three subjects did not complete the protocol; one patient was unable to comply with the visit schedule, and 2 patients had severe behavioral issues that led to their withdrawal. Characteristics of the group for demographic variables, blood pressure, body mass index, and heart rate are shown in Table I, stratified by randomization sequence. Mean body mass index was >30 kg/m2. All values were comparable at the beginning of each arm. At baseline both treatment sequences had comparable values for AST, ALT, glucose, and insulin. Table I also shows the lipid profile values stratified by randomization sequence. Again, the lipid values were comparable for each group with severely increased triglycerides, low HDL cholesterol, and borderline levels of total and LDL cholesterol present.
Table I.
Demographics and clinical characteristics at visits 1 and 4 with summaries by treatment sequence
| Variables | Treatment sequences
|
P value | |
|---|---|---|---|
| PT | TP | ||
| Age, y | 14.2 (0.5) | 14 (0.4) | .766 |
| Weight, kg | |||
| V1 | 86 (4.3) | 88.8 (3.8) | .604 |
| V4 | 88 (4.2) | 90.4 (4.1) | .712 |
| Height, cm | |||
| V1 | 166 (2.4) | 167 (5.4) | .617 |
| V4 | 166 (3) | 170 (1.9) | .304 |
| Body mass index, kg/m2 | |||
| V1 | 31 (1) | 31 (1) | .737 |
| V4 | 31 (1) | 31 (1) | .768 |
| SBP, mm Hg | |||
| V1 | 116.3 (3) | 116 (3) | .924 |
| V4 | 119.8 (2) | 115 (3) | .232 |
| DBP, mm Hg | |||
| V1 | 68.9 (2) | 72 (2.2) | .356 |
| V4 | 73.1 (2) | 68 (2.7) | .162 |
| Heart rate, bpm | |||
| V1 | 76.1 (3.0) | 70 (3) | .168 |
| V4 | 72 (2.7) | 71 (3) | .734 |
| TC, mg/dL | |||
| V1 | 195 (6.9) | 192 (5.7) | .794 |
| V4 | 206 (10.8) | 202 (6.5) | .743 |
| TG, mg/dL | |||
| V1 | 280 (25) | 260 (22) | .562 |
| V4 | 264 (36) | 261 (27) | .952 |
| HDL cholesterol, mg/dL | |||
| V1 | 39 (1.5) | 40.1 (2.0) | .635 |
| V4 | 40 (1.9) | 41 (1.96) | .679 |
| LDL cholesterol, mg/dL | |||
| V1 | 106 (4) | 110 (6) | .625 |
| V4 | 109 (5) | 114 (6) | .541 |
bpm, beats per minute; DBP, diastolic blood pressure; PT, placebo followed by treatment; SBP, systolic blood pressure; TC, total cholesterol; TG, triglyceride; TP, treatment followed by placebo; V1, visit 1; V4, visit 4 precrossover.
Mean (SE) is presented for continuous variables and frequency and percentage is presented for categorical variables. Means between were compared using 2-sample t test and proportion of categorical variables were compared using χ2 distributions.
Table II (available at www.jpeds.com) presents the red cell fatty acid composition data for 5 key fatty acids: oleic acid (C18 1n9), linoleic acid (C18 2n6), EPA (C20 5n3), docosapentaenoic-n3 acid (DPA) (C22 5n3), and DHA (C22 6n3). Values are the percent of total red cell fatty acids for each particular fatty acid. During both treatment periods, comparable increases in EPA, DPA, and DHA occurred in those treated with fish oil. Conversely, there were declines in oleic and linoleic acid in these groups. In those treated with placebo, there were no significant changes in oleic and linoleic acids. The washout after the first treatment arm was incomplete for those in the fish oil group and a further decrease in EPA, DPA, and DHA occurred during the second treatment phase that was not observed in the first treatment phase. Compared with baseline, the group treated with fish oil first had EPA 0.64 (0.07)%, DPA 0.55 (0.08)%, and DHA 2.11 (0.21)% levels above baseline at the end of treatment arm 2, all P < .0001.
Table II.
Red cell membrane fatty acid levels as % of fatty acids
| Variables | Prewashout (period 1)
|
Postwashout (period 2)
|
Overall
|
||||||||
|---|---|---|---|---|---|---|---|---|---|---|---|
| Placebo
|
Omega-3
|
Placebo
|
Omega-3
|
Placebo
|
Omega-3
|
P value | |||||
| Baseline | Change | Baseline | Change | Baseline | Change | Baseline | Change | Change | Change | ||
| C18 1n9 oleic acid | 13.23 (0.29) | −0.33* (0.11) | 13.51 (0.18) | −0.43* (0.13) | 13.39 (0.16) | 0.02 (0.13) | 12.88 (0.26) | −0.26* (0.12) | −0.15 (0.09) | −0.35* (0.09) | .08 |
| C18 2n6 linoleic acid†,‡ | 12.51 (0.29) | −0.14 (0.63) | 12.37 (0.24) | −1.39* (0.23) | 11.83 (0.22) | 0.63* (0.24) | 12.26 (0.28) | −0.80* (0.22) | 0.24 (0.15) | −1.09* (0.16) | <.001 |
| C20 5n3 EPA†,‡ | 0.4 (0.03) | −0.06 (0.14) | 0.40 (0.02) | 1.55* (0.15) | 1.04 (0.08) | −0.43 (0.22) | 0.42 (0.03) | 1.41* (0.14) | −0.25 (0.12) | 1.48* (0.11) | <.001 |
| C22 5n3 DPA†,‡ | 2.46 (0.07) | −0.03 (0.06) | 2.49 (0.08) | 0.75* (0.07) | 3.07 (0.08) | −0.33* (0.08) | 2.51 (0.09) | 0.66* (0.07) | −0.18* (0.05) | 0.71* (0.05) | <.001 |
| C22 6n3 DHA†,‡ | 3.68 (0.27) | −0.01 (0.17) | 3.64 (0.19) | 2.59* (0.19) | 5.72 (0.22) | −0.70* (0.22) | 3.93 (0.34) | 2.17* (0.18) | −0.36 (0.13) | 2.38* (0.13) | <.001 |
Change: change in % from baseline or washout baseline; overall: combined data for pre- and postwashout period; postwashout period: washout baseline; P value: the overall mean difference between treatment groups.
Within-group significant difference in mean change from baseline.
Between-group significant difference in mean change from baseline.
Between-group significant difference in mean change from washout baseline.
The results for the change in lipid levels after fish oil and placebo treatments are shown in Table III (adjusted for age, sex, and baseline value) and Figure 1 (unadjusted). Overall, there was a significant decline in triglyceride levels compared with baseline levels of 52 ± 16 mg/dL (slightly <20%) but this was not statistically significant compared with the placebo control group, which had a small decrease of 16 ± 15 mg/dL during the intervention (P = .11). With log transformation of triglyceride values, this result became marginally significant (P < .05). The difference between groups achieved by fish oil was similar in the first and second treatment arms (29 or 35 mg/dL). Both HDL cholesterol (2.0 ± 0.9 mg/dL) and LDL cholesterol (7.9 ± 3.3 mg/dL) increased compared with baseline in the fish oil treatment groups, but only the difference in LDL cholesterol was significant between groups. In the group that received fish oil in the first arm of the trial, despite incomplete washout after the first arm, there was no further increase in triglycerides during the placebo arm.
Table III.
Change in lipids, blood pressure, coagulation and thrombotic measures, and inflammatory markers by intervention period and overall
| Variable | Prewashout (period 1)
|
Postwashout (period 2)
|
Overall
|
||||||||
|---|---|---|---|---|---|---|---|---|---|---|---|
| Placebo
|
Omega-3
|
Placebo
|
Omega-3
|
Placebo
|
Omega-3
|
P value | |||||
| Baseline | Change | Baseline | Change | Baseline | Change | Baseline | Change | Change | Change | ||
| TC, mg/dL | 193 (7) | −4.7 (5) | 195 (6) | 11.7* (5.5) | 201 (6.5) | −1.3 (8) | 206 (11) | −15.2* (7.4) | −3.0 (4.6) | −1.7 (4.6) | .83 |
| TG, mg/dL | 280 (27) | −24 (17) | 260 (23) | −61.5* (18.1) | 264 (27) | −7.3 (26) | 270.4 (38) | −42 (25) | −16 (15) | −52* (16) | .04† |
| HDL cholesterol, mg/dL | 39 (1.5) | 1.3 (1.8) | 40 (2) | 3.8* (1.3) | 41 (2) | 2.2 (1.3) | 40 (2) | 0.22 (1.3) | 1.7 (0.9) | 2* (0.9) | .84 |
| LDL cholesterol, mg/dL | 109 (4) | 3.8 (3.7) | 111 (6) | 12.6* (4.0) | 114 (6) | −3.8 (5.4) | 108 (5) | 3.2 (5.3) | −0.02 (3.3) | 8* (3.3) | .14 |
| SBP, mm Hg | 120 (3) | 2.5 (2) | 122 (3) | −5.3 (2.2) | 115 (3) | 2.4 (2.7) | 120 (2) | 2.5 (2.6) | 2.5 (1.7) | −1.4 (1.7) | .09 |
| DBP, mm Hg | 70 (2) | 2.5 (1.7) | 70 (3) | 0.2 (1.9) | 68 (3) | 1.7 (1.8) | 73 (2.1) | 0.2 (2) | 2.1 (1.2) | 0.2 (1.3) | .23 |
| Peak thrombin, nM | 363 (37) | −29 (27) | 459 (46) | −94 (32) | 353 (60) | 6 (30) | 355 (34) | 15 (27) | −11 (20) | −40 (21) | .42† |
| Velocity index | 202 (35) | −40 (26) | 307 (66) | −104 (31) | 201 (47) | −3 (34) | 200 (34) | 31 (31) | −22 (21) | −36 (28) | .65† |
| ETP, nM/min | 3280 (318) | −120 (170) | 3875 (308) | −455 (201) | 3109 (457) | −118 (234) | 3477 (338) | −262 (213) | −119 (145) | −358 (147) | .31† |
| Fibrinogen, g/L | 3.55 (0.1) | −0.1 (0.1) | 3.9 (0.2) | −0.06 (0.09) | 3.3 (0.08) | 0.3 (0.2) | 3.8 (0.2) | −0.2 (0.2) | 0.1 (0.09) | 0.1 (0.09) | .07 |
| CRP, mg/L | 2.8 (0.8) | 0.1 (0.6) | 2.7 (0.5) | −0.9 (0.7) | 1.3 (0.7) | 0.87 (0.9) | 2.2 (0.4) | 0.4 (0.8) | 0.5 (0.5) | −0.3 (0.5) | .58† |
| IL-6, pg/mL | 1.4 (0.2) | 0.2 (0.3) | 1.4 (0.4) | −0.08 (0.3) | 1.2 (0.2) | 0.6 (0.4) | 1.2 (1.2) | 0.2 (0.3) | 0.4 (0.2) | 0.04 (0.2) | .12 |
| PAI-1, ng/mL | 92 (11) | 4.7 (8) | 91 (10) | −8.9 (8.5) | 109 (16) | −10 (10) | 74 (10) | −12 (9.3) | 7 (6) | −10 (6.3) | .03† |
ETP, endogenous thrombin potential.
Change: change in % from baseline or washout baseline; overall: combined data for pre- and postwashout period; postwashout period: washout baseline; P value: comparison of mean.
Within-group significant difference in mean from baseline (period 1) and washout baseline (period 2).
P value is generated using the Box-Cox–transformed data.
Figure 1.
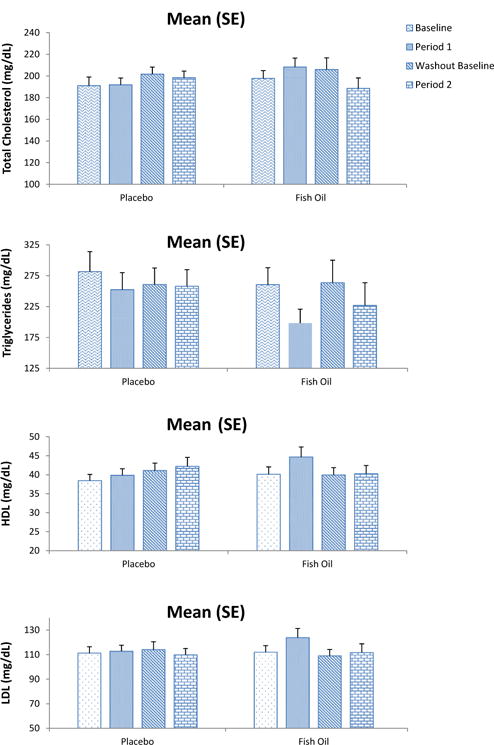
Lipid values before and after placebo or fish oil treatment are shown in the graph. Triglycerides consistently decrease in the fish oil treatment groups, whereas they are essentially unchanged for the other lipids.
Lipid particle distribution and apo B levels were performed at baseline and at the close of each treatment arm (Figure 2 and Table IV; Table IV available at www.jpeds.com). The average LDL particle number in this cohort was 1613 ± 80 nmol/L, which is more than twice the 50th percentile recently reported in sixth-grade children, and average LDL particle size was 19.2 nm, well below the 25th percentile.5 Baseline large very low-density lipoprotein (VLDL) particle number was 9.5 nmol/L and the only significant difference between groups was a decrease in large VLDL particles (−5.84 ± 1.30 [fish oil] vs −0.96 ± 1.30, P < .003). Baseline apo B levels were 97 ± 2.9 mg/dL, and there was a nonsignificant increase in apo B level (2.8 ± 2.1 [fish oil] vs 0.2 ± 2.0 mg/dL [placebo]). There were no differences in LDL particle number or distribution or HDL particle number or distribution related to fish oil treatment.
Figure 2.
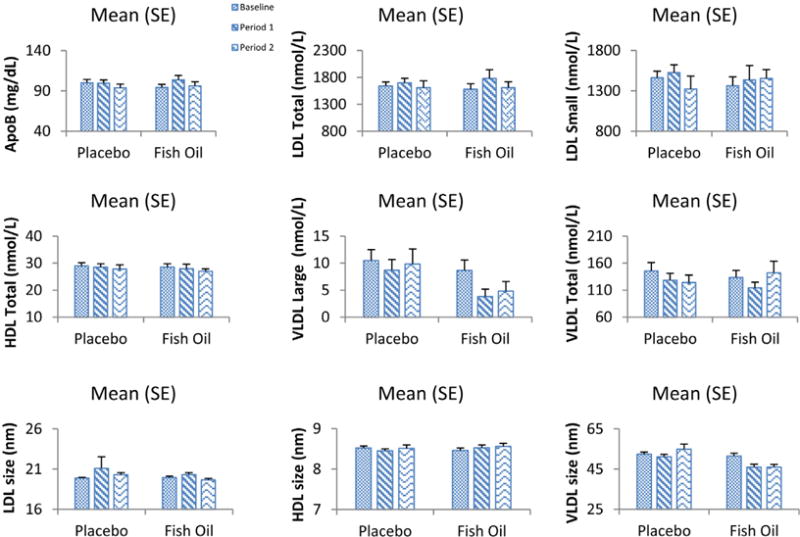
Lipid particle values, average particle size values, and apo B levels are shown compared with baseline values for each intervention interval. The only consistent change is a decrease in large VLDL particles with fish oil treatment
Table IV.
Lipoprotein particle data
| Variables | Change from baseline
|
P value | |||||||
|---|---|---|---|---|---|---|---|---|---|
| Baseline
|
Prewashout
|
Postwashout
|
Overall
|
||||||
| Placebo | Omega-3 | Placebo | Omega-3 | Placebo | Omega-3Placebo Omega-3 | Placebo | Omega-3 | ||
| LDL particles, total, nmol/L | 1643 (71) | 1582 (18) | 95 (79) | 211 (86) | 32 (85) | −20.94 (77.74) | 63 (64) | 95 (65) | .530 |
| IDL particles, nmol/L | 28 (8) | 18 (6.5) | −8 (6) | 0.1 (7) | −11 (6) | −1.99 (5.65) | −9.4 (4.4) | −0.9 (4.5) | .132 |
| Large LDL particles, nmol/L | 153 (32) | 199 (42) | 11 (31) | 147 (34) | 117 (37) | 13.86 (33.84) | 64 (24) | 80 (24) | .470 |
| Small LDL particles, total, nmol/L | 1462 (81) | 1365 (110) | 85 (104) | 65 (113) | −75 (95) | −44.04 (86.69) | 5 (72) | 10 (73) | .921 |
| Medium small LDL particles, nmol/L | 325 (24) | 275 (23) | −36 (21) | 14 (23) | −14 (24) | −34.98 (22.87) | −25 (16) | −11 (17) | .346 |
| Very small LDL particles, nmol/L | 1138 (64) | 1090 (89) | 126 (91) | 49 (99) | −61 (77) | −0.65 (69.67) | 32.6 (61) | 24 (62) | .861 |
| HDL particles, total, μmol/L | 29 (1.2) | 28 (1.3) | −0.5 (0.9) | −0.5 (1) | −0.3 (1) | −1.14 (0.87) | −0.4 (0.7) | −0.8 (0.7) | .531 |
| Large HDL particles, μmol/L | 4.2 (0.4) | 4 (0.6) | −0.04 (0.6) | 1.4 (0.6) | 1 (0.6) | 0.87 (0.57) | 0.5 (0.4) | 1.2 (0.43) | .056 |
| Medium HDL particles, μmol/L | 1.8 (0.7) | 2.5 (0.7) | −0.6 (0.5) | −0.9 (0.5) | 0.7 (0.5) | −0.40 (0.46) | 0.03 (0.35) | −0.35 (0.35) | .370 |
| Small m HDL particles, mol/L | 22.9 (1) | 22 (0.7) | 0.2 (0.8) | −1.6 (0.9) | −1.9 (0.9) | −1.78 (0.81) | −0.9 (0.6) | −1.7 (0.6) | .294 |
| Mean LDL particle size, nm | 20 (0.1) | 20 (0.2) | 1.2 (1) | 0.4 (1.1) | 0.4 (0.2) | −0.16 (0.16) | 0.8 (0.5) | 0.13 (0.54) | .387 |
| Mean HDL particle size, nm | 8.5 (0.05) | 8.5 (0.1) | −0.05 (0.05) | 0.05 (0.06) | 0.04 (0.07) | 0.05 (0.07) | −0.004 (0.05) | 0.05 (0.05) | .215 |
| Mean VLDL particle size, nm | 53 (1.1) | 37 (1.5) | −1.35 (1.03) | −5.9 (1.1) | 3 (2) | −6.3 (1.9) | 0.8 (1.2) | −6.1 (1.1) | <.001 |
| Calculated HDL cholesterol, total, mg/dL | 37 (1.5) | 36 (2.2) | −0.99 (1.68) | 1.8 (1.9) | 1.9 (2) | −0.1 (1.8) | 0.5 (1.3) | 0.9 (1.32) | .684 |
| apo B, mg/dL | 100 (4) | 94 (4) | 1 (3) | 9.5 (3.3) | −0.8 (2.6) | −4 (2.7) | 0.1 (2) | 2.8 (2.1) | .211 |
| VLDL/chylomicron particles, total, nmol/L | 146 (15) | 134 (13) | −20 (9) | −26 (9.9) | −20 (10) | −9.5 (9) | −20 (7) | −17.9 (6.8) | .830 |
| Large VLDL/chylomicron particles, nmol/L | 10 (2) | 9 (2) | −2 (1.4) | −5.6 (1.5) | 0.04 (2.7) | −5.8 (2) | −1 (1.3) | −5.8 (1.3) | .004 |
| Medium VLDL particles, nmol/L | 94 (11) | 92 (11) | −15 (9) | −25 (10) | −16.4 (10.4) | −10 (9.5) | −16 (7) | −17.4 (7.2) | .786 |
| Small VLDL particles, nmol/L | 41.6 (6.42) | 33.29 (4.94) | −1.6 (4.5) | 4 (5) | −2.80 (7.74) | 7 (7) | −2.2 (4.5) | 5.5 (4.5) | .108 |
| Calculated triglyceride, total, mg/dL | 276.41 (28.87) | 253.1 (25.81) | −41 (20) | −79 (22) | −16.40 (23.20) | − 65.72 (21.53) | −28.59 (15.70) | −72.34 (15.77) | .016 |
| Calculated VLDL/chylomicron triglyceride, total, mg/dL | 243.23 (28.77) | 221.7 (26.69) | −40 (20) | −85 (22) | −18.06 (23.34) | −64.99 (21.67) | −29.16 (15.68) | −74.89 (15.74) | .013 |
IDL, intermediate-density lipoprotein.
Secondary end points of the trial are presented at the bottom of Table III. The most interesting impact of fish oil treatment was on the thrombosis-related measures. These included a significant decrease in PAI-1 during treatment and a trend towards a decrease in fibrinogen level. Measures of thrombin generation, CRP, IL-6, glucose, and insulin were unaffected. There was a trend towards greater ALT in the patients treated with fish oil; in both groups, AST decreased but more so in the placebo group.
Fish oil was well tolerated. Adverse events were reported in 27 of 42 enrolled subjects, with 6 subjects experiencing an adverse event related to the study medication. Related adverse events included gastrointestinal symptoms, fishy taste, and frequent nosebleeds. These related events were mild to moderate in nature, expected with the study medication, resolved on their own, and did not result in discontinuation of study medication; however, the dose was reduced in 2 patients as a result of the adverse event.
Discussion
There are limited clinical trial data on the use of fish oil for cardiovascular risk reduction in childhood. Engler et al13 showed in children with dyslipidemia that 1.2 g/day of DHA increased concentrations of larger LDL and HDL particles and decreased concentrations of smaller LDL particles. Pedersen et al14 compared fish oil with vegetable oil contained in bread at a 1.5 g/day dose in 78 mildly overweight Danish boys. Fish oil lowered blood pressure slightly and had no effect on triglycerides, a slight increase in HDL and non-HDL cholesterol was seen. A 6-month trial of 250 or 500 mg/day dosing in children with hepatic steatosis improved triglycerides and insulin sensitivity as well as reducing liver fat.15 Collectively, these studies show inconsistent results with regard to triglyceride lowering and at lower fish oil doses than the pharmacologic dose used in this study.
A recent review of adult clinical trials documented a dose-dependent effect with a triglyceride lowering of approximately 40 mg/dL achieved with a 4g dose, an effect that is similar to the results seen in this study.9 Particle distribution studies in adults from studies where fish oil is given as the only lipid-lowering treatment generally suggest fish oil is associated with an increase in size in LDL particles, a response that is considered more favorable for atherosclerosis prevention.16,17 Reports on these studies also describe a significant reduction in large VLDL particle size, a finding that was also observed in our study. A recent dietary study in Alaskan Indians showed that greater intake of fish oil was associated with lower large VLDL particles, larger HDL particles, a trend towards larger LDL particles, but no change in LDL particle number.18 After a single high fish oil content meal compared with a low omega-3 fatty acid meal, VLDL particles are significantly reduced in size with no impact on LDL or HDL particle composition.19 Thus, our study is generally consistent with the adult literature on the magnitude of triglyceride lowering from a 4 g/day dose, on the reduction in large VLDL particle number, and the lack of change in total LDL particle number. We did not, however, detect an impact on LDL or HDL particle size distribution.
Omega-3 fatty acids are known to have a weak, antithrombotic effect that is insufficient to cause significant bleeding as a complication of therapy.20 In a study by Vanschoonbeek et al,21 4 weeks of fish oil treatment resulted in reduced thrombin generation and fibrinogen levels in healthy volunteers; however, the effect was variable and more pronounced in those with a structural fibrinogen alpha-chain polymorphism. Very recent studies have suggested that exogenous modification of platelet membranes by omega-3 fatty acids results in decreased platelet procoagulant activity and thrombus formation.22 Platelets show less aggregation and activation in healthy subjects who are taking omega-3 supplements.23 Population-based studies suggest that for an association with lower fibrinogen levels to be seen, fish oil consumption must be high, achieving red blood cell levels similar to those seen on pharmacologic therapy.24,25
Early studies suggested that fish oil might increase PAI-1 activity, but a meta-analysis of studies of fish oil supplementation did not identify an impact of fish oil on PAI-1 activity.26 Weight reduction appears to have a more potent effect on PAI-1 levels than fish oil consumption in adults.27 The findings from our study, including a trend towards lower levels of fibrinogen and a significant decrease in PAI-1 levels, are consistent with the limited literature on the subtle but potentially beneficial effects of fish oil supplementation on coagulation and fibrinolysis. The enhanced efficiency of fibrinolysis through a reduction in PAI-1, the most important and rapidly acting physiological inhibitor of plasminogen, suggests that thrombin generation is secondary to enhanced fibrinolysis in the presence of fish oil.
Strengths of this study include the double-blind, crossover design; the comprehensive assessment of not only changes in lipids but lipid particles; markers of inflammation; insulin resistance and thrombosis; the use of red cell fatty acid markers to evaluate compliance; the relatively large sample size compared with other pediatric trials of fish oil treatment; and the use of a pharmacologic grade preparation that also did not have a “fishy aftertaste” to confound blinding.
There are a number of limitations. The study achieved the predicted significant lowering of triglycerides but statistical significance compared with the corn oil placebo was compromised by a small reduction of triglycerides in that group. Although it is unlikely, corn oil may have impacted levels, as polyunsaturated fats can have an effect on triglycerides. The intrinsic variability of triglycerides is large and this may have confounded analyses. This variability may have been impacted by pubertal changes in a subset of the cohort. DHA and EPA may have different effects on the outcomes in our study; this could not be assessed in this design.28 Our red cell fatty acid level data show incomplete washout after 1 month; the washout period could have been longer. However, the difference in triglyceride response between fish oil and placebo groups in the second arm of the trial was exactly the same as in the first arm of the trial.
If fish oil 4 g daily is effective in prevention of early atherosclerosis, the mechanism is likely related to reducing the number of large VLDL particles or chylomicrons or on endothelial function (not measured in this study) and related antithrombotic effects rather than on affecting atherogenic LDL particles. This study suggests a need for further investigation in adolescents with increased triglycerides regarding the benefits of LDL particle number lowering as opposed to triglyceride lowering, the atherogenicity of large VLDL and chylomicron particles, and the secondary benefits of fish oil on thrombosis and inflammation, particularly in relation to endothelial function and early atherosclerosis.
Acknowledgments
Funded by GlaxoSmithKline, which also supplied the fish oil preparation and placebo capsules.
Glossary
- ALT
Alanine aminotransferase
- apo B
Apolipoprotein B
- AST
Aspartate-aminotransferase
- CRP
C-reactive protein
- DHA
Docosahexaenoic acid
- DPA
Docosapentaenoic-n3 acid
- EPA
Eicosapentaenoic acid
- HDL
High-density lipoprotein
- IL-6
Interleukin-6
- LDL
Low-density lipoprotein
- PAI-1
Plasminogen activator inhibitor-1
- VLDL
Very low-density lipoprotein
Footnotes
The authors declare no conflicts of interest.
Registered with ClinicalTrials.gov: NCT00915902.
References
- 1.Centers for Disease Control and Prevention. Prevalence of abnormal lipid levels among youths—United States, 1999–2006. MMWR Morb Mortal Wkly Rep. 2010;59:29–33. [PubMed] [Google Scholar]
- 2.Steinberger J, Daniels SR, Eckel RH, Hayman L, Lustig RH, McCrindle B, et al. Progress and challenges in metabolic syndrome in children and adolescents: a scientific statement from the American Heart Association Atherosclerosis, Hypertension, and Obesity in the Young Committee of the Council on Cardiovascular Disease in the Young; Council on Cardiovascular Nursing; and Council on Nutrition, Physical Activity, and Metabolism. Circulation. 2009;119:628–47. doi: 10.1161/CIRCULATIONAHA.108.191394. [DOI] [PubMed] [Google Scholar]
- 3.Morrison JA, Glueck CJ, Wang P. The child as proband for future parental cardiometabolic disease: the 26-year prospective Princeton Lipid Research Clinics Follow-up Study. J Pediatr. 2012;160:590–7 e3. doi: 10.1016/j.jpeds.2011.12.003. [DOI] [PMC free article] [PubMed] [Google Scholar]
- 4.Morrison JA, Glueck CJ, Wang P. Childhood risk factors predict cardiovascular disease, impaired fasting glucose plus type 2 diabetes mellitus, and high blood pressure 26 years later at a mean age of 38 years: the Princeton-lipid research clinics follow-up study. Metabolism. 2012;61:531–41. doi: 10.1016/j.metabol.2011.08.010. [DOI] [PMC free article] [PubMed] [Google Scholar]
- 5.Mietus-Snyder M, Drews KL, Otvos JD, Willi SM, Foster GD, Jago R, et al. Low-density lipoprotein cholesterol versus particle number in middle school children. J Pediatr. 2013;163:355–62 e2. doi: 10.1016/j.jpeds.2013.01.012. [DOI] [PMC free article] [PubMed] [Google Scholar]
- 6.Balagopal PB, de Ferranti SD, Cook S, Daniels SR, Gidding SS, Hayman LL, et al. Nontraditional risk factors and biomarkers for cardiovascular disease: mechanistic, research, and clinical considerations for youth: a scientific statement from the American Heart Association. Circulation. 2011;123:2749–69. doi: 10.1161/CIR.0b013e31821c7c64. [DOI] [PubMed] [Google Scholar]
- 7.De Caterina R. n-3 fatty acids in cardiovascular disease. N Engl J Med. 2011;364:2439–50. doi: 10.1056/NEJMra1008153. [DOI] [PubMed] [Google Scholar]
- 8.Risk Prevention Study Collaborative Group. Roncaglioni MC, Tombesi M, Avanzini F, Barlera S, Caimi V, et al. n-3 fatty acids in patients with multiple cardiovascular risk factors. N Engl J Med. 2013;368:1800–8. doi: 10.1056/NEJMoa1205409. [DOI] [PubMed] [Google Scholar]
- 9.Mozaffarian D, Wu JH. Omega-3 fatty acids and cardiovascular disease: effects on risk factors, molecular pathways, and clinical events. J Am Coll Cardiol. 2011;58:2047–67. doi: 10.1016/j.jacc.2011.06.063. [DOI] [PubMed] [Google Scholar]
- 10.Rizos EC, Ntzani EE, Bika E, Kostapanos MS, Elisaf MS. Association between omega-3 fatty acid supplementation and risk of major cardiovascular disease events: a systematic review and meta-analysis. JAMA. 2012;308:1024–33. doi: 10.1001/2012.jama.11374. [DOI] [PubMed] [Google Scholar]
- 11.Miller M, Stone NJ, Ballantyne C, Bittner V, Criqui MH, Ginsberg HN, et al. Triglycerides and cardiovascular disease: a scientific statement from the American Heart Association. Circulation. 2011;123:2292–333. doi: 10.1161/CIR.0b013e3182160726. [DOI] [PubMed] [Google Scholar]
- 12.Harris PA, Taylor R, Thielke R, Payne J, Gonzalez N, Conde JG. Research electronic data capture (REDCap)—a metadata-driven methodology and workflow process for providing translational research informatics support. J Biomed Inform. 2009;42:377–81. doi: 10.1016/j.jbi.2008.08.010. [DOI] [PMC free article] [PubMed] [Google Scholar]
- 13.Engler MM, Engler MB, Malloy MJ, Paul SM, Kulkarni KR, Mietus-Snyder ML. Effect of docosahexaenoic acid on lipoprotein subclasses in hyperlipidemic children (the EARLY study) Am J Cardiol. 2005;95:869–71. doi: 10.1016/j.amjcard.2004.12.014. [DOI] [PubMed] [Google Scholar]
- 14.Pedersen MH, Molgaard C, Hellgren LI, Lauritzen L. Effects of fish oil supplementation on markers of the metabolic syndrome. J Pediatr. 2010;157:395–400 e1. doi: 10.1016/j.jpeds.2010.04.001. [DOI] [PubMed] [Google Scholar]
- 15.Nobili V, Bedogni G, Alisi A, Pietrobattista A, Rise P, Galli C, et al. Docosahexaenoic acid supplementation decreases liver fat content in children with non-alcoholic fatty liver disease: double-blind randomised controlled clinical trial. Arch Dis Child. 2011;96:350–3. doi: 10.1136/adc.2010.192401. [DOI] [PubMed] [Google Scholar]
- 16.Calabresi L, Donati D, Pazzucconi F, Sirtori CR, Franceschini G. Omacor in familial combined hyperlipidemia: effects on lipids and low density lipoprotein subclasses. Atherosclerosis. 2000;148:387–96. doi: 10.1016/s0021-9150(99)00267-1. [DOI] [PubMed] [Google Scholar]
- 17.Kelley DS, Siegel D, Vemuri M, Mackey BE. Docosahexaenoic acid supplementation improves fasting and postprandial lipid profiles in hypertriglyceridemic men. Am J Clin Nutr. 2007;86:324–33. doi: 10.1093/ajcn/86.2.324. [DOI] [PubMed] [Google Scholar]
- 18.Annuzzi G, Rivellese AA, Wang H, Patti L, Vaccaro O, Riccardi G, et al. Lipoprotein subfractions and dietary intake of n-3 fatty acid: the Genetics of Coronary Artery Disease in Alaska Natives study. Am J Clin Nutr. 2012;95:1315–22. doi: 10.3945/ajcn.111.023887. [DOI] [PMC free article] [PubMed] [Google Scholar]
- 19.Burdge GC, Powell J, Dadd T, Talbot D, Civil J, Calder PC. Acute consumption of fish oil improves postprandial VLDL profiles in healthy men aged 50–65 years. Br J Nutr. 2009;102:160–5. doi: 10.1017/S0007114508143550. [DOI] [PubMed] [Google Scholar]
- 20.Nilsen DW, Dalaker K, Nordoy A, Osterud B, Ingebretsen OC, Lyngmo V, et al. Influence of a concentrated ethylester compound of n-3 fatty acids on lipids, platelets and coagulation in patients undergoing coronary bypass surgery. Thromb Haemost. 1991;66:195–201. [PubMed] [Google Scholar]
- 21.Vanschoonbeek K, Feijge MA, Paquay M, Rosing J, Saris W, Kluft C, et al. Variable hypocoagulant effect of fish oil intake in humans: modulation of fibrinogen level and thrombin generation. Arterioscler Thromb Vasc Biol. 2004;24:1734–40. doi: 10.1161/01.ATV.0000137119.28893.0b. [DOI] [PubMed] [Google Scholar]
- 22.Larson MK, Tormoen GW, Weaver LJ, Luepke KJ, Patel IA, Hjelmen CE, et al. Exogenous modification of platelet membranes with the omega-3 fatty acids EPA and DHA reduces platelet procoagulant activity and thrombus formation. Am J Physiol Cell Physiol. 2013;304:C273–9. doi: 10.1152/ajpcell.00174.2012. [DOI] [PMC free article] [PubMed] [Google Scholar]
- 23.McEwen BJ, Morel-Kopp MC, Chen W, Tofler GH, Ward CM. Effects of omega-3 polyunsaturated fatty acids on platelet function in healthy subjects and subjects with cardiovascular disease. Semin Thromb Hemost. 2013;39:25–32. doi: 10.1055/s-0032-1333309. [DOI] [PubMed] [Google Scholar]
- 24.Archer SL, Green D, Chamberlain M, Dyer AR, Liu K. Association of dietary fish and n-3 fatty acid intake with hemostatic factors in the coronary artery risk development in young adults (CARDIA) study. Arterioscler Thromb Vasc Biol. 1998;18:1119–23. doi: 10.1161/01.atv.18.7.1119. [DOI] [PubMed] [Google Scholar]
- 25.Hassen LJ, Ueshima H, Curb JD, Choo J, Lee S, Masaki K, et al. Significant inverse association of marine n-3 fatty acids with plasma fibrinogen levels in Japanese in Japan but not in whites or Japanese Americans. Eur J Clin Nutr. 2012;66:329–35. doi: 10.1038/ejcn.2011.155. [DOI] [PMC free article] [PubMed] [Google Scholar]
- 26.Hansen J, Grimsgaard S, Nordoy A, Bonaa KH. Dietary supplementation with highly purified eicosapentaenoic acid and docosahexaenoic acid does not influence PAI-1 activity. Thromb Res. 2000;98:123–32. doi: 10.1016/s0049-3848(99)00223-6. [DOI] [PubMed] [Google Scholar]
- 27.Jellema A, Plat J, Mensink RP. Weight reduction, but not a moderate intake of fish oil, lowers concentrations of inflammatory markers and PAI-1 antigen in obese men during the fasting and postprandial state. Eur J Clin Invest. 2004;34:766–73. doi: 10.1111/j.1365-2362.2004.01414.x. [DOI] [PubMed] [Google Scholar]
- 28.Wei MY, Jacobson TA. Effects of eicosapentaenoic acid versus docosahexaenoic acid on serum lipids: a systematic review and meta-analysis. Curr Atheroscler Rep. 2011;13:474–83. doi: 10.1007/s11883-011-0210-3. [DOI] [PubMed] [Google Scholar]