Abstract
Purpose
To design volume‐specific breast phantoms from breast CT (bCT) data sets and estimate the associated normalized mean glandular dose coefficients for breast CT using Monte Carlo methods.
Methods
A large cohort of bCT data sets (N = 215) was used to evaluate breast volume into quintiles (plus the top 5%). The average radius profile was then determined for each of the six volume‐specific groups and used to both fabricate physical phantoms and generate mathematical phantoms (V1‐V6; “V” denotes classification by volume). The MCNP6 Monte Carlo code was used to model a prototype bCT system fabricated at our institution; and this model was validated against physical measurements in the fabricated phantoms. The mathematical phantoms were used to simulate normalized mean glandular dose coefficients for both monoenergetic source photons “DgNCT (E)” (8–70 keV in 1 keV intervals) and polyenergetic x‐ray beams “pDgNCT ” (35–70 kV in 1 kV intervals). The Monte Carlo code was used to study the influence of breast size (V1 vs. V5) and glandular fraction (6.4% vs. 45.8%) on glandular dose. The pDgNCT coefficients estimated for the V1, V3, and V5 phantoms were also compared to those generated using simple, cylindrical phantoms with equivalent volume and two geometrical constraints including; (a) cylinder radius determined at the breast phantom chest wall “Rcw”; and (b) cylinder radius determined at the breast phantom center‐of‐mass “RCOM”.
Results
Satisfactory agreement was observed for dose estimations using MCNP6 compared with both physical measurements in the V1, V3, and V5 phantoms (R2 = 0.995) and reference bCT dose coefficients using simple phantoms (R2 = 0.999). For a 49 kV spectrum with 1.5 mm Al filtration, differences in glandular fraction [6.5% (5th percentile) vs. 45.8% (95th percentile)] had a 13.2% influence on pDgNCT for the V3 phantom, and differences in breast size (V1 vs. V5) had a 16.6% influence on pDgNCT for a breast composed of 17% (median) fibroglandular tissue. For cylindrical phantoms with a radius of RCOM , the differences were 1.5%, 0.1%, and 2.1% compared with the V1, V3, and V5 phantoms, respectively.
Conclusion
Breast phantoms were designed using a large cohort of bCT data sets across a range of six breast sizes. These phantoms were then fabricated and used for the estimation of glandular dose in breast CT. The mathematical phantoms and associated glandular dose coefficients for a range of breast sizes (V1–V6) and glandular fractions (5th to 95th percentiles) are available for interested users.
Keywords: breast cancer, breast computed tomography, dosimetry, glandular breast dose, x‐ray imaging
1. Introduction
Modern breast dosimetry for mammography makes use of Monte Carlo‐derived estimates of normalized glandular dose coefficients, DgN. For many decades, these Monte Carlo simulations have made use of idealized phantom shapes for the compressed breast, largely emulating the letter “D” in terms of shape — emulating, but not exactly, the shape of the breast under compression during mammography. During the early days of breast CT (bCT) development, it was essential that proper dosimetry be developed in order to better understand the radiation dose consequences of 3‐D imaging of the breast, and also to make fair comparisons between breast CT and mammography — at the same dose levels. In the earlier days before bCT scanners were developed and used for clinical acquisition, simple assumptions of a cylindrical shape for the breast were used for Monte Carlo breast dosimetry.1, 2 While the assumption of the cylindrical shape for the breast was useful in the early days of research for this new modality, the reality is that the pendant breast shape is not a cylinder and indeed as the volume of the breast increases, its shape changes as well. More recent Monte Carlo breast dosimetry reports for bCT simulate the pendant breast as a semiellipsoid3 which is more indicative of the pendant breast shape, but this assumption is still model‐driven.
Now that bCT technology has been deployed in the research arena for some time at various institutions, there are many large data sets which can be utilized to better define the shape of the breast as a function of its size (or volume). These data, in turn, can be used to produce more accurate mathematical phantoms for Monte Carlo assessment of mean glandular dose. In this research, the large collection of bCT data sets available at our institution were used to define more realistic (and more accurate) breast shapes which span a range in size from small to large breasts. The breast shape information has also been used to manufacture a set of physical breast phantoms to validate Monte Carlo measurements.
The ubiquitous use of aggressive breast compression for digital mammography (and tomosynthesis) tends to conform the breast to a relatively uniform thickness throughout the exposed volume, which is a simpler shape when considering breast dosimetry. In comparison, the uncompressed pendant breast geometry used in breast CT presents both the thickest part of the breast (posteriorly, toward the chest wall) as well as the thinnest part of the breast (anteriorly, toward the nipple). This large difference in breast thickness requires that we move beyond the cylindrical assumption for bCT dosimetry. The purpose of this investigation therefore is to utilize breast shape and size information acquired over years of bCT research, in order to better understand the dosimetry associated with the pendant breasts across the range of volumes with shapes that match typical breasts for each volume.
2. Methods
2.A. Breast CT data‐derived phantom design using volume classification
A number of prototype bCT scanners have been used to conduct clinical trial studies under several IRB‐approved protocols at our institution. A cohort of 215 bCT volume data sets were used for designing realistic breast‐shaped phantoms in the pendant geometry employed in dedicated breast CT. Only the unaffected breasts (with no known lesion) of these 215 women were used to analyze breast shape. A three‐dimensional segmentation method4 was used to automatically segment the bCT volume data sets into five components: adipose tissue, fibroglandular tissue, chest wall, skin, and air. This segmentation method utilized a 2D parabolic correction which was applied to flatten the adipose tissue in each slice and therefore eliminate low frequency variations caused by scatter and beam hardening. Effective breast radius profiles were then calculated for each segmented bCT data set. The effective radius was calculated from the cross‐sectional area of the breast by first determining how many pixels in the segmented coronal image contained breast tissue (adipose, glandular, chest wall) and then multiplying this by the area of each pixel in the coronal image — similar to previously reported methods.5 The most posterior coronal image used for the analysis was manually determined as the first chest wall image not containing artifacts, and the last coronal image was manually determined as the last slice containing the nipple. Given differences in reconstructed slice thickness for the bCT volume data sets, each radius profile was interpolated using cubic splines to 0.5 mm intervals. The effective radius profiles from the chest wall to nipple, and the total breast volume (excluding skin) were used to define the size and shape of each breast. All breasts were readjusted to be rotationally symmetrical. The rationale for this assumption is based upon the wide variability in patient positioning on a breast CT table top which can cause nonrealistic asymmetries. Confining the breast shapes to be rotationally symmetric takes into account the fact that some breasts may be longer in the superior–inferior direction and some may be longer in the medial–lateral direction. In addition, replicating these phantoms is significantly simplified by assuming rotational symmetry.
The bCT data sets were classified into separate groups based on breast volume. The radius profiles were grouped into quintiles, i.e., the 0–20th, 20–40th, 40–60th, 60–80th, and 80–100th percentiles of breast volume; there were ~41 cases in each group. To accommodate the largest of breasts, the largest 5% of breasts by volume were grouped to form a sixth model. The data within each group were then averaged to provide six radius profiles representative of the range of breast sizes and shapes found clinically in the pendant position. Polynomial interpolation was then used to smooth each of the six volume‐classified radius profiles and the degree of the polynomial fit was chosen to minimize the difference between the measured and interpolated radii. These two‐dimensional radius profiles were then used to define three‐dimensional, radially symmetric breast phantoms. The six breast phantoms are referred to as V1‐V6 throughout the remainder of this manuscript, where “V” denotes that volume was used for the classification. To ensure the volume of the three‐dimensional breast phantoms constructed from the two‐dimensional average radius profiles matched the average volume measured within each group, the radius profiles were linearly extrapolated posteriorly. This was done by fitting the last 5 mm of the radius profiles to a line and extrapolating (in 0.5 mm increments) until the total phantom volume was approximately equal to the average breast volume within each group. The aforementioned phantom designs, derived from bCT data sets, constitute the entirety of the proposed phantom volume within the x‐ray beam FOV.
Ultra‐high‐molecular‐weight polyethylene (UHMW), with a density of 0.941 g/cm3, was chosen as the fabrication material for the phantoms because of its excellent machinability and similar density to adipose tissue in the breast (0.930 g/cm3). The radius profiles, described in the previous paragraph, were extrapolated an additional 4 cm in the posterior direction until reaching the radii of commercially available boules of UHMW; 76.2 mm for V1–V5 phantoms; 82.6 mm for V6 phantom. This 4 cm region was added to the fabricated phantoms for ease in the fabrication process, ease in mounting the phantoms in a pendent breast geometry, and to a lesser extent to include the effects of peripheral breast tissue in physical measurements (i.e., backscatter) on a bCT system. A small notch was cut into the surface of each phantom during computer‐machining at the boundary between the modeled breast volume and the 4 cm extrapolated region. This notch (hereafter simply referred to as the FOV boundary line) was less than 1 mm deep, but deep enough to be visible in projection images for aligning the phantoms within the scanner's FOV.
2.B. Physical measurements in breast‐shaped phantoms
Measurements of air kerma were performed on the prototype bCT scanner “Doheny” at UC Davis. A detailed description of Doheny has been reported recently6 and therefore only specifications pertinent to the physical measurements in this work are discussed here. All air kerma measurements were performed using a 0.6 cm3 thimble ionization chamber (10X6‐0.6CT, Radcal Corp., Monrovia, CA, USA) connected to a model 9060 electrometer and a model 9010 readout unit (Radcal Corp., Monrovia, CA, USA). The 10X6‐0.6CT chamber has an active volume that is ~20 mm in length and ~9 mm in diameter. This chamber is used extensively in the evaluation of radiation dose in CT7 and is therefore well suited for air kerma measurements in this work. For all air kerma measurements, three separate recordings were made and the results were averaged to improve the accuracy of the measurement. The coefficient of variation (COV = 100σ/μ) was also calculated to assess the reproducibility of the ionization chamber measurements.
To characterize the Doheny scanner's x‐ray beam, the half value layer (HVL) was measured using type 1100 aluminum with the ionization chamber positioned at the scanner isocenter (502 mm from the x‐ray source) and the upper boundary of the active volume aligned with the central ray of the x‐ray beam. HVL measurements were made at tube voltages of 50, 60, and 70 kV with 0.2 mm Cu filtration. The previously reported tungsten anode spectral model using interpolating cubic splines for application in bCT (TASMICSbCT 8) was then used in conjunction with the HVL measurements to model the Doheny scanner's x‐ray spectrum. TASMICSbCT provides minimally filtered (0.8 mm beryllium) x‐ray spectra from 35 to 70 kV, and the Monte Carlo model used for generating these x‐ray spectra makes use of the specific geometry employed in breast CT.
Air kerma measurements were then performed in the V1, V3, and V5 phantoms using the experimental setup diagrammed in Fig. 1. For each phantom scan, the center of the phantom was positioned at the isocenter of the bCT system and the FOV boundary line was aligned with the central ray of the x‐ray beam as shown in Fig. 1(a). The 0.6 cm3 ionization chamber was then inserted into a 12.5 mm diameter hole that was located 20 mm from the center of the phantom (i.e., isocenter) as shown in Fig. 1(b). The bottom surface of the 12.5 mm diameter hole was designed to be 20 mm anterior from the FOV boundary line. This ensures that when the chamber (20 mm active length) is inserted into the hole the upper boundary of the chamber's active volume is aligned with the central ray of the x‐ray beam as shown in Fig. 1(a). Five hundred projections were acquired over a 360° rotation of the gantry for three separate acquisitions at 50, 60, and 70 kV with 0.2 mm Cu filtration. The integrated air kerma was recorded for each of the nine acquisitions (three breast phantoms & three kV settings). The phantom was then removed and the exact same scan protocol was used to acquire free‐in‐air measurements of the air kerma with the chamber positioned at the scanner isocenter. The ratio of the air kerma in‐phantom to the air kerma free‐in‐air was then calculated for all nine acquisitions. This kerma ratio was used for comparison with Monte Carlo simulations as described in section 2.D.
Figure 1.

Diagram showing positioning of a 0.6 cm3 ionization chamber in a realistic‐breast shaped phantom for physical air kerma measurements on a prototype breast CT system in the (a) cone angle and (b) fan angle directions. Only the active volume of the ionization chamber is shown. This diagram is not drawn to scale. [Color figure can be viewed at wileyonlinelibrary.com]
2.C. Glandular dose for breast‐shaped phantoms
The MCNP6 Monte Carlo code was used to simulate energy deposition in the V1–V6 phantoms utilizing the pendant breast geometry of cone‐beam breast CT as shown in Fig. 2. A point source was simulated in the Monte Carlo model and collimated to completely irradiate the largest breast phantom (V6) in both the cone angle (see Fig. 2) and fan angle directions. Voxelized phantoms were defined in the Monte Carlo simulation geometry to model the V1‐V6 phantoms with a 0.5 × 0.5 × 0.5 mm3 voxel size. Each phantom was composed of a 1.5 mm skin layer based on previously published work.9 The breast tissue within the skin layer was modeled as a homogenous mixture of adipose and fibroglandular tissue. Five different breast tissue densities, expressed as percent fibroglandular tissue by volume (excluding the skin), were simulated as 6.4%, 11.7%, 17.0%, 26.6%, and 45.8% corresponding to the 5th, 25th, 50th, 75th, and 95th percentiles of breast density, respectively, as reported previously.10 The elemental composition of skin, fibroglandular tissue, and adipose tissue was acquired from the American Association of Physicists in Medicine (AAPM) Task Group 195.11
Figure 2.
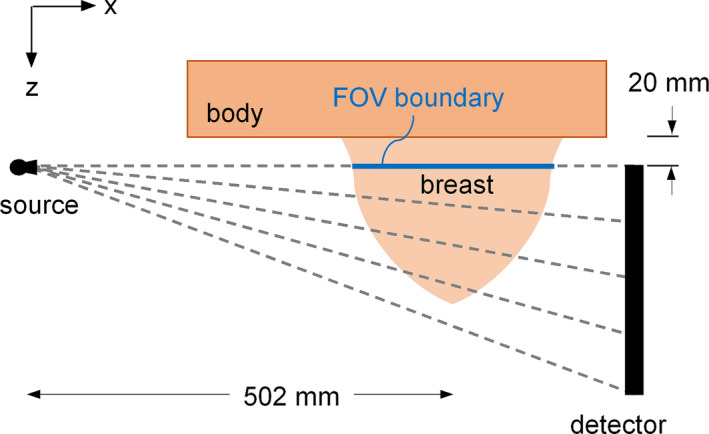
Monte Carlo simulation geometry of the dedicated breast CT system used for the estimation of glandular breast dose. A 20 mm region outside of the field‐of‐view (FOV) and a water cuboid approximating the patient body are included for possible backscatter from the patient. This diagram is not drawn to scale. [Color figure can be viewed at wileyonlinelibrary.com]
A 20 mm breast region (see Fig. 2) outside of the primary beam path (i.e., posterior from the FOV boundary) and a large cuboid composed of water were modeled in the simulations to include the influence of x‐ray backscatter from the patient. The breast region outside of the FOV was modeled by linearly extrapolating the radius profile for each breast phantom, and the glandular fraction within this region was identical to that in the irradiated volume. The tissue in this region was not included in the estimation of glandular dose, as is typical in Monte Carlo dosimetry studies. The source‐to‐isocenter (SIC) distance was modeled as 502 mm, consistent with the prototype Doheny bCT scanner at our institution. Previously published work found that differences in the SIC have little effect on dose when normalized to the air kerma at isocenter,1 and therefore this effect was not investigated in the present work. In addition, Sechopoulos et al.12 found a maximum relative organ dose (beyond the breast) of 3.25% during bCT scanning, and thus only the glandular dose to the breast was quantified in this study.
The same Monte Carlo methodologies previously reported for mammography13 were used in MCNP6 for estimation of the normalized mean glandular dose for breast CT. Only relevant differences are mentioned here. Simulations were run using monoenergetic photons ranging from 8 to 70 keV in 1 keV intervals. Glandular dose contributions for photons ≤ 7 keV were found to be negligible due to skin‐shielding effects. Between 1 × 10⁷ and 9 × 10⁷ source photons were simulated for six breast sizes (V1–V6), and six breast densities (6.4%–45.8%), resulting in a relative error < 1% for all total energy deposition tallies. Dose deposition to the glandular component of the breast tissue (mGy per incident photon) was tallied separately for primary and scattered (single or multiple event) dose contributions. The total glandular dose was divided by the air kerma at isocenter for each monoenergetic photon energy to compute the monoenergetic normalized mean glandular dose coefficient for breast CT “DgNCT(E)”. All DgNCT(E) values were then weighted by TASMICSbCT‐generated x‐ray spectra for a range of tube voltages and filtration materials employed in commercial and prototype bCT systems using methods consistent with the literature.14 To match the mid‐bin energy of TASMICSbCT‐generated spectra, the DgNCT(E) coefficients were interpolated using cubic splines from 8.25 to 69.75 keV in 0.5 keV intervals before spectral weighting.
2.D. Monte Carlo validation
For validation of the Monte Carlo simulation model used in the present work, physically measured air kerma ratios (i.e., ratio of the air kerma in‐phantom to free‐in‐air) as outlined in section 2.B, were compared directly with air kerma ratios simulated using MCNP6. The modeled x‐ray spectra for the Doheny scanner, described in section 2.B, were used for defining the x‐ray source in MCNP6. The 0.6 cm3 ionization chamber was modeled explicitly in the MCNP6 simulation geometry according to specifications from the manufacturers’ user manual as outlined in section 2.B. The air kerma free‐in‐air was first estimated for all three kV settings (50, 60, and 70 kV with 0.2 mm Cu filtration) with the center of the simulated chamber positioned at the isocenter of the CT simulation geometry (502 mm from the source) and the upper boundary of the active volume aligned with the central ray of the x‐ray beam. Only a single source location was required for the air simulations given the rotational symmetry. Ten billion source photons were tracked resulting in a relative error < 1% for all air kerma free‐in‐air estimations. In addition, the simulated air kerma for the chamber placed in the V1, V3, and V5 phantoms was also determined for all three kV settings using the chamber position depicted in Fig. 1. The computational voxelized phantoms for these Monte Carlo simulations were uniformly composed of UHMW polyethylene — consistent with the composition of the fabricated phantoms. A total of 36 source locations spanning 360° in 10° intervals were simulated corresponding to a complete tomographic acquisition. The influence of angular sampling was found to be negligible for these simulations when 36 source locations were simulated over a full 360° rotation. Between 1.5 × 10⁷ and 2 × 10⁷ source photons were tracked for all air kerma in‐phantom simulations resulting in a relative error < 1%. The ratio of the air kerma in‐phantom to air kerma free‐in‐air was then calculated for a total of nine simulations (three kV settings & three breast phantom sizes).
In addition to comparisons between Monte Carlo and physically measured data, simulated pDgNCT coefficients were compared directly with previously reported dose coefficients.1 The MCNP6 simulation geometry was adapted to replicate the bCT system geometry and x‐ray techniques used in previously published estimations of pDgNCT coefficients. Direct comparisons of pDgNCT coefficients were made for the 10 and 18 cm cylindrical breast phantoms composed of 0% and 50% fibroglandular tissue from 30 to 100 kV in 10 kV intervals. This was accomplished by first simulating DgNCT(E) values for monoenergetic source photons ranging from 8 to 100 keV in 1 keV intervals. TASMICSbCT was then used to model the eight x‐ray spectra from 30 to 100 kV by matching the calculated HVLs with the measured HVLs reported in the reference publication. The modeled x‐ray spectra were then used to spectrally weight the DgNCT(E) values and estimate pDgNCT coefficients.
The Statistics Toolbox in MATLAB R2016b was used for all statistical comparisons between: (a) The physical measurements of air kerma ratios and those estimated using MCNP6; (b) pDgNCT estimations using MCNP6 and previously reported pDgNCT coefficients.
2.E. Glandular dose distributions
The distribution of glandular dose was estimated for the V3 phantom composed of 17% breast fibroglandular tissue (50th percentile). Monoenergetic source photons at 20, 30, and 40 keV were used for this analysis corresponding to approximately the range of effective energies employed in commercial and prototype bCT systems. Small cylindrical volumes‐of‐interest (VOIs) were defined in the Monte Carlo simulation geometry along the z‐axis and centered in the modeled breast phantoms, as shown in Fig. 3. The cylindrical VOIs were modeled as voxelized volumes with a voxel size consistent with the rest of the modeled phantom volume (i.e., 0.5 × 0.5 × 0.5 mm3). Each VOI was 5 mm in both diameter and length and were modeled contiguously from the posterior boundary of the breast tissue outside of the FOV (z = 0) to within 5 mm of the anterior edge of the modeled phantoms. To obtain a relative error <1% for the glandular dose estimations in each VOI, 9 × 10⁷ source photons were tracked in the Monte Carlo simulations. This setup for defining the dose distributions allows for investigation of both the out‐of‐field dose contribution from scatter in the peripheral breast tissue, and the dependence of breast radius on glandular dose.
Figure 3.
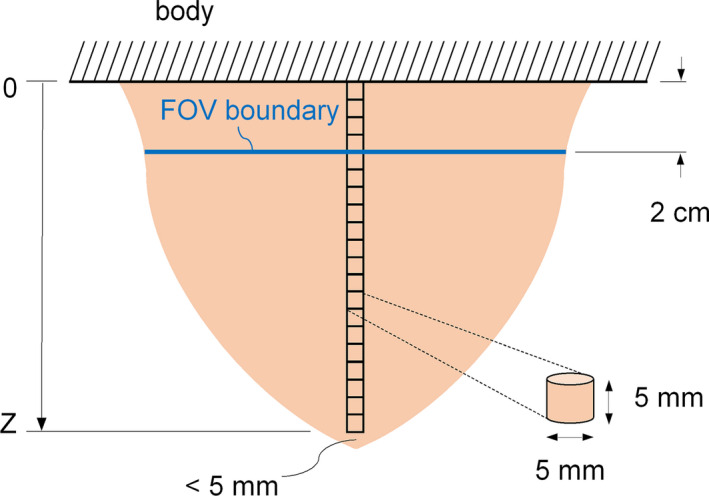
Schematic showing location of cylindrical volumes of interest for dose distribution estimations along the z‐axis. This diagram is not drawn to scale. [Color figure can be viewed at wileyonlinelibrary.com]
2.F. Breast‐shaped phantom dose comparisons with cylindrical phantoms
For comparison of DgNCT coefficients in realistically shaped breast phantoms with DgNCT coefficients computed in cylindrical phantoms reported in the literature, the following two geometrical metrics were used to compare the cylindrical phantom results to those determined in this study: (a) The radius of the cylinder was set equal to the radius of the breast‐shaped phantom at the chest wall “Rcw” which was calculated as the average radius within a 1 cm region from the posterior edge of the breast‐shaped phantoms; (b) The radius of the cylinder was set equal to the radius at the center‐of‐mass of the breast‐shaped phantom in the anterior‐posterior direction “RCOM”. For all comparisons, the length of the cylindrical phantom was adjusted to match the volume of the corresponding breast‐shaped phantom.
3. Results
3.A. Breast CT data‐derived phantom design using volume classification
Effective radius profiles for the six volume‐classified breast phantoms are shown in Fig. 4(a). The 4 cm extrapolated breast region beyond the FOV boundary line for each phantom, as described at the end of section 2.A, is not included in the radius profiles shown in Fig. 4(a). Photographs of the physical phantoms fabricated using UHMW polyethylene are displayed in Fig. 4(b). Anatomical metrics for each breast phantom are also listed in Table 1.
Figure 4.
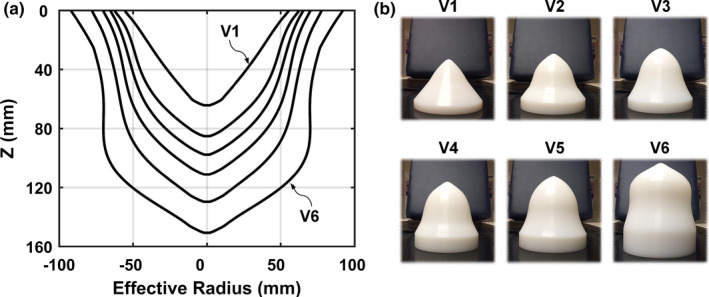
Results for bCT data‐derived phantoms using volume classification of 215 bCT volume data sets. (a) Measured effective radius profiles for the VI–V6 phantoms. (b) Photographs of the V1–V6 phantoms fabricated with UHMW (ultra‐high‐molecular‐weight polyethylene). [Color figure can be viewed at wileyonlinelibrary.com]
Table 1.
Anatomical metrics for the breast‐shaped phantoms using volume classification of 215 breast CT volume data sets
| V1 | V2 | V3 | V4 | V5 | V6 | |
|---|---|---|---|---|---|---|
| Volumea (cm3) Range | 225.7 [26.0, 356.3) | 454.6 [356.3, 537.6) | 613.6 [537.6, 719.5) | 827.2 [719.5, 974.0) | 1192.9 [974.0, 1631.2) | 1972.9 [1631.2, 2362.3) |
| Length (mm) | 64.5 | 85.5 | 98.0 | 111.5 | 130.0 | 151.0 |
| Rcw b (mm) | 51.7 | 58.9 | 62.6 | 67.6 | 75.2 | 88.8 |
| RCOM(mm) | 43.5 | 49.6 | 53.3 | 57.2 | 62.2 | 70.4 |
volume calculation excludes skin.
chest wall measurement is the average radius within the first 1 cm of the breast from the posterior edge.
3.B. Monte Carlo validation
The 0.6 cm3 ionization chamber presented a maximum value of 2.1% for the coefficient of variation for all air kerma measurements in the realistic phantoms and free‐in‐air. To match the physically measured HVLs on the Doheny system at 50, 60, and 70 kV with 0.20 mm of inherent Cu filtration, TASMICSbCT‐generated x‐ray spectra were filtered with 0.208, 0.217, and 0.215 mm of Cu filtration, respectively. These modeled spectra were then used in the Monte Carlo simulations that produced the air kerma ratio comparisons with physical measurements shown in Fig. 5(a). Satisfactory correlation (R2 = 0.995) was observed. Within a 95% confidence interval, the slope is not significantly different than unity and the intercept is not significantly different than 0. MCNP6 simulations of pDgNCT coefficients for cylindrical breast phantoms compared with previously reported coefficients using the SIERRA Monte Carlo code1 are shown in Fig. 5(b) with satisfactory correspondence (R2 = 0.999). The results are for 10 and 18 cm diameter cylindrical phantoms composed of 0% and 50% fibroglandular tissue spanning from 30 to 100 kV (in 10 kV intervals). The slope and intercept for the linear fit of the data points are not significantly different than 1 and 0, respectively, within a 95% confidence interval. The results shown in Fig. 5 indicate that the Monte Carlo methodologies used in the present study are valid when compared against both physical measurements and previously published glandular dose coefficients.
Figure 5.
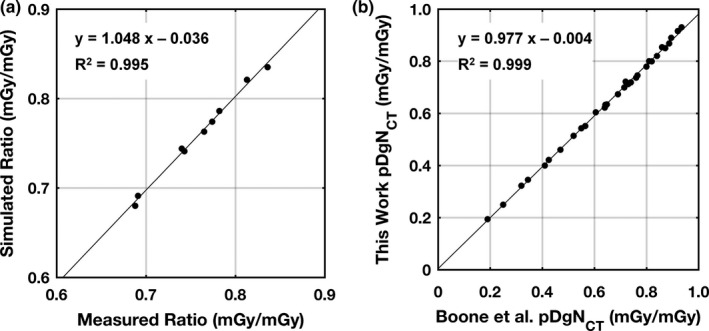
(a) MCNP6 simulation results for kerma ratios (i.e., air kerma in‐phantom to free‐in‐air) compared with physical measurements on the Doheny bCT system at UC Davis. The comparisons shown are for the V1, V3, and V5 phantoms at 50, 60, and 70 kV with 0.2 mm of Cu filtration. (b) Comparison of pDgNCT coefficients simulated in MCNP6 with a reference data set for 10 and 18 cm diameter cylinders (0% and 50% fibroglandular tissue), and tube voltages spanning from 30 to 100 kV in 10 kV intervals. A linear fit to the data points is shown for each comparison along with the coefficient of determination.
3.C. Glandular dose for breast‐shaped phantoms
Glandular dose trends within the entire phantom volume for monoenergetic source photons are shown in Fig. 6. Unlike the trends for cylindrical phantoms for which the total dose monotonically increases with decreasing diameter,1, 2, 3 the results shown in Fig. 6(a) indicate that above ~35 keV the total dose for the V3 phantom is higher than V1 and above ~40 keV the total dose for the V5 phantom is higher than V1. Looking specifically at primary dose contributions in Fig. 6(b), the trend is similar to cylindrical phantoms in that the dose is consistently higher for smaller breast sizes. For the scatter dose contributions shown in Fig. 6(c) the results are more complex in that at lower photon energies, slightly more scattered x‐ray energy is deposited in the smaller phantom; but at higher photon energies the trend is reversed. The ratio of the scatter‐to‐primary dose contributions shown in Fig. 6(d) demonstrates that at low photon energies < ~15 keV the ratios are similar, but with higher photon energies the dose deposited to the V5 phantom is dominated by scatter contributions (where SPR > 1.0).
Figure 6.
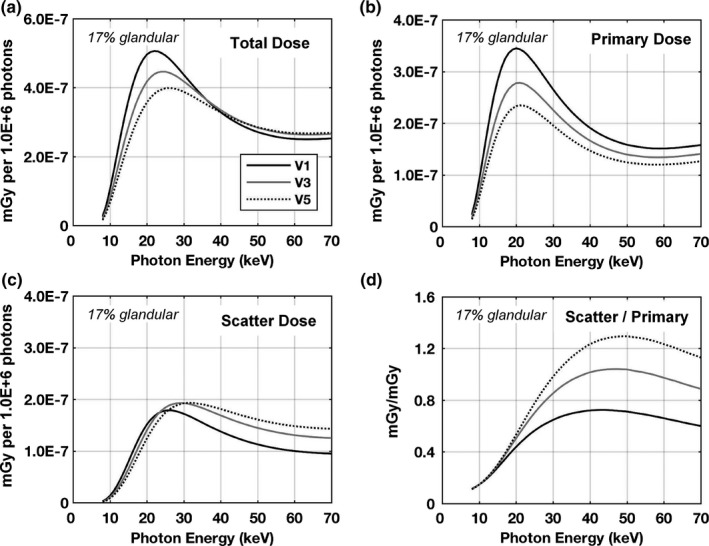
Glandular dose results in units of mGy per million photons for the V1, V3, and V5 phantoms composed of 17% fibroglandular tissue (excluding skin) with a skin thickness of 1.5 mm. The dose trends are shown as the (a) total, (b) primary contributions, (c) scatter contributions, and (d) the ratio of the scatter‐to‐primary contributions. The same legend is used for all figures.
The mean glandular dose normalized to the air kerma at scanner isocenter for monoenergetic photons “DgNCT(E)” is shown in Fig. 7(a). Consistent with the results shown in Fig. 6(a), the DgNCT(E) coefficients for the V1 phantom are consistently higher up to ~35 keV. Above this energy, the DgNCT(E) coefficients for the V1 phantom drop below V3 and then V5. This is attributed to more of the scattered radiation “leaking” out of the smaller phantom due to solid angle effects and therefore not contributing to glandular dose. Referring to Fig. 6(d), the ratio of scatter‐to‐primary dose contributions at 40 keV are 0.7, 1.0, and 1.2 for the V1, V3, and V5 phantoms, respectively — justifying this observation. The more clinically relevant polyenergetic dose coefficients “pDgNCT” are shown in Fig. 7(b) resulting from spectrally weighting the DgNCT(E) coefficients by TASMICSbCT‐generated x‐ray spectra. With 1.5 mm of added Al filtration, the pDgNCT coefficients are consistently higher for the V1 phantom; however, with 0.2 mm of added Cu filtration the dose coefficients for the V1 phantom drop below the dose coefficients for the V3 phantom above ~60 kV. The relatively harder x‐ray beam (0.2 mm Cu) with an effective energy of 35.4 keV at 60 kV is near the photon energy for which the DgNCT(E) coefficients for the V1 phantom drop below the V3 phantom [Fig. 7(a)]. In comparison, the effective energy of the 60 kV spectrum with 1.5 mm Al is 25.3 keV which is within the energy range where the V1 phantom clearly presents higher dose coefficients. Figure 7(c) illustrates pDgNCT coefficients for the entire set of six phantom sizes investigated in this work. The V6 phantom represents the largest 5% of breasts imaged on the bCT scanners in our laboratory and accordingly has a substantially larger volume then the next smallest size (V5) phantom, as outlined in Table 1. As a result, the pDgNCT coefficients are also substantially lower. For example, at 49 kV the pDgNCT coefficient for V6 is 10.2% lower than for V5 whereas the difference for the V5 and V4 phantom is only 5.2%. Together these results indicate that when estimating glandular dose for realistic breast shapes, the differences related to breast size are more complex than the simple case of cylindrical phantoms.
Figure 7.
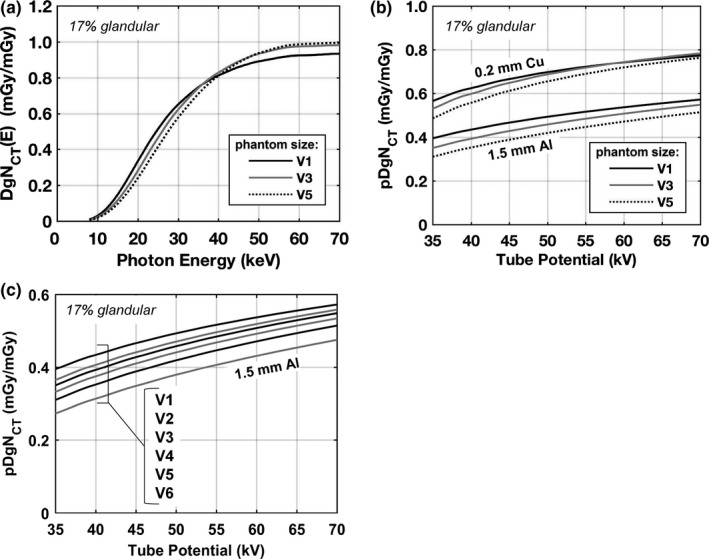
Normalized mean glandular dose estimations for the V1, V3, and V5 phantoms composed of 17% fibroglandular tissue (excluding skin) with a skin thickness of 1.5 mm are shown for (a) monoenergetic source photons and (b) polyenergetic x‐ray beams with 0.2 mm Cu filtration and 1.5 mm Al filtration. (c) Dose coefficients for polyenergetic beams with 1.5 mm Al are shown again, but for all six phantom sizes illustrating the complete range of dose coefficients investigated in this work. The pDgN,‐T coefficients are estimated by spectrally weighting the DgNCT (E) results using TASMICSbCT‐generated spectra.
Figure 8 summarizes glandular dose differences related to differences in glandular fraction. The results for monoenergetic photons [Fig. 8(a)] demonstrate that the largest differences occur between approximately 20 and 40 keV — which is within the range of effective energies used in bCT. Figure 8(b) illustrates that for polyenergetic x‐ray beams the highest glandular fraction produces the lowest glandular dose levels across all tube voltages compared — consistent with previously published findings. For a 49 kV x‐ray beam with 1.5 mm of Al filtration, the pDgNCT coefficient is 13.2% lower for a glandular fraction of 45.8% (95th percentile) compared with 6.4% (5th percentile). When 0.2 mm of Cu filtration is used, the difference is 8.7%. These results indicate that the effect of glandular fraction on glandular dose depends to some degree on the choice of beam filtration (i.e., harder beams compress the range of pDgNCT coefficients when breast density is considered).
Figure 8.
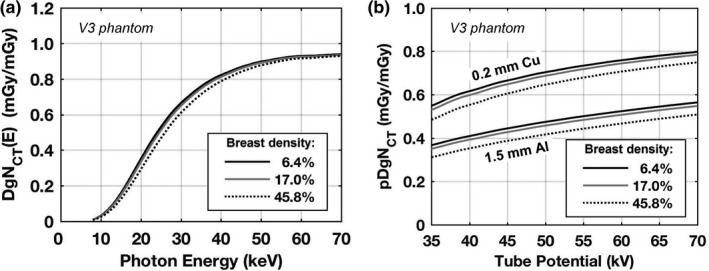
Normalized mean glandular dose estimations for the V3 phantom with a skin thickness of 1.5 mm and breast tissue composed of 6.4%, 17.0%, and 45.8% fibroglandular tissue (excluding skin) representing the 5th, 50th, and 95th percentiles, respectively, of breast compositions previously reported.10 Results are shown for (a) monoenergetic source photons and (b) polyenergetic x‐ray beams with 0.2 mm Cu filtration and 1.5 mm Al filtration. The pDgNCT coefficients are estimated by spectrally weighting the DgNCT (E) results using TASMICSbCT‐generated spectra.
3.D. Glandular dose distributions
Glandular dose distribution profiles for the V3 phantom at 20, 30, and 40 keV are shown in Fig. 9 for the VOIs illustrated in Fig. 3. The V3 phantom diameter profile is overlaid in the figure for visual comparison of the relationship between breast diameter and glandular dose. The dose within the breast tissue outside of the FOV is the result of scattered radiation contributions. As expected, the dose tends to increase with decreasing breast diameter from the chest wall toward the nipple. For the 20 keV monoenergetic photons, the dose profile is consistently lower than for the higher energy photons up to within 2 cm from the most anterior portion of the breast. The higher percentage of photoelectric interactions at 20 keV relative to 40 keV in soft tissue15 results in less primary radiation reaching the central portion of the breast where the VOIs are defined.
Figure 9.
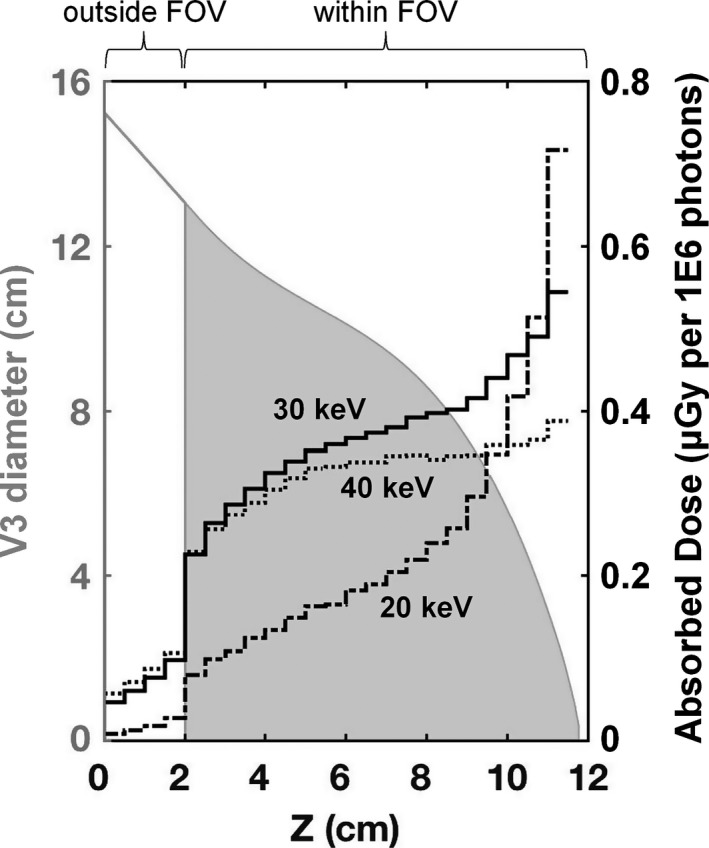
Dose distribution profiles (right axis) spanning from the posterior to anterior region of the V3 phantom composed of 17% fibroglandular tissue. Results are shown for 20, 30, and 40 keV monoenergetic source photons. The irradiated V3 phantom (solid gray area) is overlaid and labeled on the left axis. The extrapolated 2 cm tissue region outside of the FOV is also shown with only a gray outline.
3.E. Breast‐shaped phantom dose comparisons with cylindrical phantoms
Figure 10 shows monoenergetic glandular dose comparisons for the cylindrical phantoms relative to the breast‐shaped phantoms. The radii used to define the cylindrical phantoms for these comparisons are displayed in the last two rows of Table 1. A summary of the comparison results for polyenergetic x‐ray beams is shown in Table 2. The results for Rcw indicate that defining the radius at the chest wall results in an underestimation of the dose levels because the actual shape of the breast tapers in the anterior direction. The results for RCOM demonstrate that the radius at the breast‐shaped phantom center‐of‐mass is a good approximation of the dose assuming a cylindrical breast shape. Essentially this is because half of the breast volume is larger (posterior) and half is smaller (anterior) and therefore the differences cancel out.
Figure 10.

DgN(E) coefficient comparisons plotted for cylindrical phantoms as a function of the corresponding realistic breast‐shaped phantom. The radius of the cylinder was either set equal to the radius at the chest wall “RCW” of the breast‐shaped phantoms; or the radius of the cylinder was set equal to the radius of the breast‐shaped phantoms at the center‐of‐mass in the anterior–posterior direction “RCO m”. For all comparisons, the length of the cylindrical phantoms was adjusted to match the volume of the corresponding breast‐shaped phantom. (a) V1 regression fit comparisons with RCOM (y = 1.009x − 0.010) and RCW (y = 0.903x − 0.018). (b) V3 regression fit comparisons with RCOM (y = 1.015x − 0.001) and RCW (y = 0.907x − 0.009). (c) V5 regression fit comparisons with RCOM (y = l.015x − 0.002) and RCW (y = 0.901x − 0.005). All phantoms used for comparison were composed of 17% fibroglandular tissue (excluding skin) and a skin thickness of 1.5 mm. The solid line is the line of identity.
Table 2.
Comparisons results showing the difference in pDgNCT coefficients for the cylindrical phantoms relative to the breast phantoms averaged across a range of tube potentials from 35 to 70 kV (1 kV intervals)
| Phantom: | V1 | V3 | V5 | |||
|---|---|---|---|---|---|---|
| Beam filtration: | 0.2 mm Cu | 1.5 mm Al | 0.2 mm Cu | 1.5 mm Al | 0.2 mm Cu | 1.5 mm Al |
| Rcw: Difference (%) | −14.2 | −16.2 | −12.1 | −13.1 | −12.2 | −12.7 |
| RCOM: Difference (%) | −0.6 | −1.5 | 0.3 | 0.1 | 2.0 | 2.1 |
4. Discussion
4.A. Phantom development
More accurate dosimetry was the driving motivation for this research investigation, however the development of the six mathematical and physical breast phantoms provides additional utility for the continued optimization of breast CT. For example, these breast phantoms are being used to better understand the scatter distribution at the detector, in the hopes of improving scatter‐rejection and scatter‐correction methodologies in breast CT. These phantoms have also been used to produce beam shaping filters over the range of breast volumes from V1 to V6. The utility of beam shaping filters have been reported initially16 (U.S. Patent PCT/US2016/063701), and it is likely that three‐dimensional beam shaping filters in breast CT will have some role in reducing dose while maintaining image quality, just as bowtie filters do in whole body CT. These phantoms have also been used as molds for the fabrication of thermoplastic immobilizers that could potentially help conform the breast to be centered in the field‐of‐view. The immobilizers are also potentially useful for positioning the patient to optimally exploit the specific shape of beam shaping filters. Given the minimal thickness, low attenuation properties, and high porosity of the thermoplastic material, it is unlikely that the immobilizers will affect dose; however, future work is required to verify this assumption. Finally, the physical breast‐shaped phantoms were fabricated with a hole to accommodate the insertion of contrasting material and have already proved useful in the assessment of signal difference to noise ratio in the laboratory. Anatomical metrics for the six breast phantoms are provided in Table 1 and the corresponding radius profiles are attached to the supplemental material of this manuscript. These should allow anyone interested in recreating these phantoms to do so.
4.B. Dosimetry for breast CT
This study represents a necessary improvement in the accuracy of breast dosimetry for the pendant geometry and 360° rotation used in breast CT. The results (Table 2) show that the dose coefficients (pDgNCT) for the breast‐shaped phantoms are remarkably close to those for cylindrical phantoms, when the diameter corresponding to the vertical center‐of‐mass is selected on the breast‐shaped phantoms for comparison. This observation is true across breast volume and breast density, as well as x‐ray beam quality. However, these findings assume a breast phantom composed of a homogeneous mixture of fibroglandular and adipose tissue, and the results may be different if realistic heterogeneous distributions of glandular tissue are considered. These new realistic breast‐shaped phantoms would be useful for computing average fibroglandular tissue distributions in accordance with each breast phantom size, and therefore potentially further improve breast dosimetry methods for breast CT.
A comprehensive set of DgNCT(E) coefficients for all six breast‐shaped phantoms and a range of glandular fractions, derived as described in this paper, are available in spreadsheet format (see supplemental material of this manuscript).
5. Conclusion
In this investigation, the series of six mathematical phantoms of differing size and shape were designed from a large number (N = 215) of breast CT data sets acquired at our institution. Monte Carlo methods were used in concert with these mathematical phantoms to compute normalized dose coefficients for the pendant breast geometry typically used in breast CT systems. Monte Carlo metrics were well matched to parameters physically measured using breast phantoms fabricated for this work. It was shown for these breast‐shaped phantoms, that when the diameter at the vertical center‐of‐mass is considered, the dose coefficients are very similar to those computed for cylinders. A set of comprehensive normalized dose coefficients is available in the supplemental material of this manuscript, and these coefficients span the range of breast size (volume) and glandular fraction.
Conflicts of interest
John M. Boone has U.S. patents (pending and issued) pertaining to breast CT.
Supporting information
Data S1. Phantom profiles and monoenergetic DgN coefficients.
Acknowledgments
This communication was funded in part by NIH grants P30 CA093373 and R01 CA181081. Comments made are solely the responsibility of the authors and do not necessarily represent the official views of the National Cancer Institute or the National Institutes of Health.
References
- 1. Boone JM, Shah N, Nelson TR. A comprehensive analysis of DgN(CT) coefficients for pendant‐geometry cone‐beam breast computed tomography. Med Phys. 2004;31:226–235. [DOI] [PubMed] [Google Scholar]
- 2. Thacker SC, Glick SJ. Normalized glandular dose (DgN) coefficients for flat‐panel CT breast imaging. Phys Med Biol. 2004;49:5433–5444. [DOI] [PubMed] [Google Scholar]
- 3. Sechopoulos I, Feng SS, D'Orsi CJ. Dosimetric characterization of a dedicated breast computed tomography clinical prototype. Med Phys. 2010;37:4110–4120. [DOI] [PMC free article] [PubMed] [Google Scholar]
- 4. Packard N, Boone JM. Glandular segmentation of cone beam breast CT volume images. Proc. SPIE 6510, Medical Imaging. Phys Med Imaging. 2007;6510:651038. [Google Scholar]
- 5. Huang SY, Boone JM, Yang K, et al. The characterization of breast anatomical metrics using dedicated breast CT. Med Phys. 2011;38:2180–2191. [DOI] [PMC free article] [PubMed] [Google Scholar]
- 6. Gazi PM, Yang K, Burkett GW Jr, Aminololama‐Shakeri S, Seibert JA, Boone JM. Evolution of spatial resolution in breast CT at UC Davis. Med Phys. 2015;42:1973–1981. [DOI] [PMC free article] [PubMed] [Google Scholar]
- 7. Report of AAPM Task Group 111 . The future of CT dosimetry. Comprehensive methodology for the evaluation of radiation dose in x‐ray computed tomography AAPM; 2010.
- 8. Hernandez AM, Seibert JA, Nosratieh A, Boone JM. Generation and analysis of clinically relevant breast imaging x‐ray spectra. Med Phys. 2017;44:2148–2160. [DOI] [PMC free article] [PubMed] [Google Scholar]
- 9. Huang SY, Boone JM, Yang K, Kwan AL, Packard NJ. The effect of skin thickness determined using breast CT on mammographic dosimetry. Med Phys. 2008;35:1199–1206. [DOI] [PMC free article] [PubMed] [Google Scholar]
- 10. Yaffe MJ, Boone JM, Packard N, et al. The myth of the 50‐50 breast. Med Phys. 2009;36:5437–5443. [DOI] [PMC free article] [PubMed] [Google Scholar]
- 11. Sechopoulos I, Ali ES, Badal A, et al. Monte Carlo reference data sets for imaging research: executive summary of the report of AAPM Research Committee Task Group 195. Med Phys. 2015;42:5679–5691. [DOI] [PubMed] [Google Scholar]
- 12. Sechopoulos I, Vedantham S, Suryanarayanan S, D'Orsi CJ, Karellas A. Monte Carlo and phantom study of the radiation dose to the body from dedicated CT of the breast. Radiology. 2008;247:98–105. [DOI] [PMC free article] [PubMed] [Google Scholar]
- 13. Hernandez AM, Seibert JA, Boone JM. Breast dose in mammography is about 30% lower when realistic heterogeneous glandular distributions are considered. Med Phys. 2015;42:6337–6348. [DOI] [PMC free article] [PubMed] [Google Scholar]
- 14. Boone JM. Normalized glandular dose (DgN) coefficients for arbitrary X‐ray spectra in mammography: computer‐fit values of Monte Carlo derived data. Med Phys. 2002;29:869–875. [DOI] [PubMed] [Google Scholar]
- 15. Bushberg JT, Seibert JA, Leidholt EM, Boone JM. The Essential Physics of Medical Imaging, 3rd edn. Philadelphia: Wolters Kluwer Health/Lippincott Williams & Wilkins; 2012. [Google Scholar]
- 16. Hernandez A, Boone J. WE‐DE‐207B‐11: implementation of size‐specific 3D beam modulation filters on a dedicated breast CT platform using breast immobilization. Med Phys. 2016;43:3819–3820. [Google Scholar]
Associated Data
This section collects any data citations, data availability statements, or supplementary materials included in this article.
Supplementary Materials
Data S1. Phantom profiles and monoenergetic DgN coefficients.


