Abstract
Purpose
X‐ray‐induced luminescence (XIL) is a hybrid x‐ray/optical imaging modality that employs nanophosphors that luminescence in response to x‐ray irradiation. X‐ray‐activated phosphorescent nanoparticles have potential applications in radiation therapy as theranostics, nanodosimeters, or radiosensitizers. Extracting clinically relevant information from the luminescent signal requires the development of a robust imaging model that can determine nanophosphor distributions at depth in an optically scattering environment from surface radiance measurements. The applications of XIL in radiotherapy will be limited by the dose‐dependent sensitivity at depth in tissue. We propose a novel geometry called selective plane XIL (SPXIL), and apply it to experimental measurements in optical gel phantoms and sensitivity simulations.
Methods
An imaging model is presented based on the selective plane geometry which can determine the detected diffuse optical signal for a given x‐ray dose and nanophosphor distribution at depth in a semi‐infinite, optically homogenous material. The surface radiance in the model is calculated using an analytical solution to the extrapolated boundary condition. Y2O3:Eu3+ nanoparticles are synthesized and inserted into various optical phantom in order to measure the luminescent output per unit dose for a given concentration of nanophosphors and calibrate an imaging model for XIL sensitivity simulations. SPXIL imaging with a dual‐source optical gel phantom is performed, and an iterative Richardson–Lucy deconvolution using a shifted Poisson noise model is applied to the measurements in order to reconstruct the nanophosphor distribution.
Results
Nanophosphor characterizations showed a peak emission at 611 nm, a linear luminescent response to tube current and nanoparticle concentration, and a quadratic luminescent response to tube voltage. The luminescent efficiency calculation accomplished with calibrated bioluminescence mouse phantoms determines 1.06 photons were emitted per keV of x‐ray radiation absorbed per g/mL of nanophosphor concentration. Sensitivity simulations determined that XIL could detect a concentration of 1 mg/mL of nanophosphors with a dose of 1 cGy at a depth ranging from 2 to 4 cm, depending on the optical parameters of the homogeneous diffuse optical environment. The deconvolution applied to the SPXIL measurements could resolve two sources 1 cm apart up to a depth of 1.75 cm in the diffuse phantom.
Conclusions
We present a novel imaging geometry for XIL in a homogenous, diffuse optical environment. Basic characterization of Y2O3:Eu3+ nanophosphors are presented along with XIL/SPXIL measurements in optical gel phantoms. The diffuse optical imaging model is validated using these measurements and then calibrated in order to execute initial sensitivity simulations for the dose‐depth limitations of XIL imaging. The SPXIL imaging model is used to perform a deconvolution on a dual‐source phantom, which successfully reconstructs the nanophosphor distributions.
Keywords: deconvolution, luminescence, nanoparticles, optical imaging, x‐rays
1. Introduction
X‐ray‐induced luminescence imaging (XIL) is an emerging imaging modality that employs lanthanide‐doped nanophosphors that emit near‐infrared light in response to their exposure to x‐ray radiation. This technique has a number potential applications in molecular imaging1 and in the context of radiotherapy, where the nanoparticles could serve as nanodosimeters,2 sources of optical photons for deep‐tissue photodynamic therapy,3, 4, 5 theranostics for monitoring drug delivery,6 or as direct radiosensitizers.7 The ability to image the distribution of the nanoparticles would enable verification of nanoparticle delivery and allow for proper dosimetric calculations.
Image acquisition in XIL has generally focused on the use of a first‐generation tomographic geometry in which a pencil beam of x rays stimulates emission of luminescent photons along a line through the object. The total detected optical counts provide an estimate of the line integral through the nanoparticle distribution. The sinogram needed for tomographic reconstruction is acquired one line integral at a time by translating and rotating the object. This process is generally referred to as x‐ray luminescence computed tomography (XLCT).8, 9, 10, 11 Previous work focused on smaller specimen imaging has employed a microbeam x‐ray source and optical detection via a multiple pinhole geometry.12
Here, we present a selective plane x‐ray‐induced luminescence (SPXIL) geometry using a sheet beam excitation source that constrains XIL to a cross‐section within the object. A camera with imaging axis perpendicular to the sheet can then directly image the surface radiance due to the emissions from the illuminated plane. This geometry allows direct imaging without the need to rotate the object or the x‐ray source. Furthermore, as compared to the so‐called cone‐beam techniques in which the whole object is irradiated,13, 14, 15 this technique reduces the reconstruction from an ill‐posed, three‐dimensional diffuse optical reconstruction to a two‐dimensional image restoration that further simplifies to a two‐dimensional deconvolution when the sheet beam is parallel to a flat imaging surface in an optically homogenous material. Thus, SPXIL offers the ability to directly image a specific region as opposed to irradiating the entire surrounding tissue for XIL tomographic reconstruction.
A selective plane x‐ray geometry combined with a deconvolution‐based reconstruction has been investigated experimentally with Cherenkov luminescence‐activated fluorophores.16, 17 Numerical simulations using a fan‐beam x‐ray geometry to constrain XIL to a cross‐section in the mouse have been explored previously.18 Here, we present the first experimental results of using a selective plane geometry in optical diffuse phantoms for XIL imaging and characterize its potential sensitivity limitations as a function of dose and depth.
2. Materials and methods
2.A. Selective plane illumination geometry
The SPXIL employs a sheet beam of x rays produced by slit collimation to selectively excite a plane within the object. Nanophosphors in the illumination cross‐section luminescence, and a camera positioned on an imaging axis orthogonal to the selective plane detects the surface radiance from the XIL. This represents a single image acquisition for SPXIL as depicted in Fig. 1(a). The object is subsequently translated through the selective plane of illumination in step sizes equal to the thickness of the planar x‐ray sheet at isocenter. The resulting image stack is a three‐dimensional representation of detected surface radiance for varying source depths. With knowledge of the tissue optical properties, image restoration or deconvolution techniques can take advantage of the known depth of selective x‐ray excitation to reconstruct the three‐dimensional nanophosphor distribution from the stack of surface radiance measurements.
Figure 1.
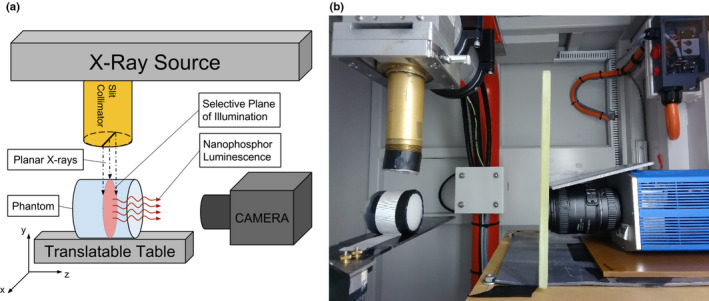
(a) Selective plane x‐ray‐induced luminescence (SPXIL) imaging geometry. A planar x‐ray source selectively excites nanophosphors in an object and a camera on an imaging axis orthogonal to the planar x‐ray source detects the surface radiance from the x‐ray‐induced luminescence. (b) Experimental SPXIL imaging setup with optical gel phantom using a cooled CCD and f/2.8 macro lens. A slit aperture is attached to the x‐ray source collimator and rudimentary lead shielding and leaded glass around the camera are used to reduce x‐ray interactions with CCD sensor. [Color figure can be viewed at wileyonlinelibrary.com]
2.B. Imaging model
2.B.1. Luminescence generation
The XIL at depth in the tissue is proportional to the x‐ray radiation dose absorbed by the nanoparticles and the nanophosphor concentration and thus the emitted number of photons at a point x, y, z is given by
| (1) |
Here, D NP is the dose absorbed by nanoparticles in J/kg, ρ NP (x,y,z) is the density of nanoparticles in g/cm3, and α NP the luminescence efficiency in (photons/keV)/(g/cm3). This varies with nanophosphor composition and fabrication technique. For example, coating europium‐doped nanophosphors with silica has been shown to increase their luminescent output.19
The prefactor a is a constant converting J to keV and g to kg. We assume that the nanoparticles are present in sufficiently small concentrations that they do not significantly perturb the dose distribution in the medium and thus the dose to nanoparticles is related to the dose to nearby tissue by the ratio of the nanoparticle and tissue mass energy‐absorption coefficients. The doses reported in the paper are the doses to tissue.
2.B.2. Optical diffusion for semi‐infinite uniform medium
The x‐ray‐induced luminescence in the tissue diffuses before it reaches the surface. For an optically homogeneous, semi‐infinite medium, this diffusion is governed by the optical absorption coefficient μ a and the reduced scatter coefficient of the material. The semi‐infinite medium approximates an imaging environment with a flat imaging surface in which the imaging depth is small relative to the total size of the object. As outlined by Rice et al., the model for the normalized surface radiance is obtained from the analytical solution to the extrapolated boundary condition for a point source at depth in a turbid medium, such as tissue.20 In this simplified representation, the surface radiance N(r,z) is a function of the depth of the light source z and the radial distance r from the point source axis as seen in Fig. 2(a). An extrapolated boundary z b marks the halfway point between a source and a sink gradient for diffuse light to travel from out of the tissue.21, 22 It is a function of μ a and , along with the effective reflection coefficient R eff . which is 0.493 for the tissue–air interface.22 The normalized surface radiance is shown in Eq. (2), and Table 1 explains the various terms listed therein.
Figure 2.
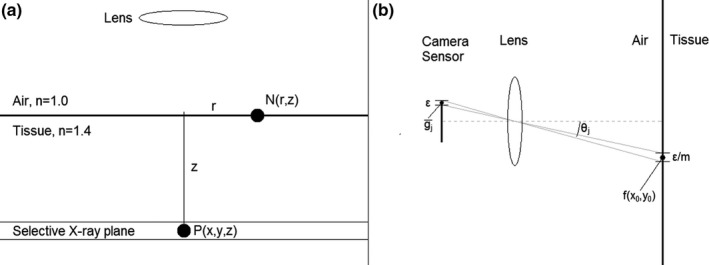
(a) Schematic showing induced luminescence P(x,y,z) at depth z via the selective plane and the normalized surface radiance at point N(r,z) for a point source at that location. (b) Detection of the surface radiance with CCD array via lens with f‐number N and magnification m.
Table 1.
Distance and optical property parameters outlined by Rice et al.20 and used to calculate the normalized surface radiance in Eq. (2)
| Normalized surface radiance equation parameter | Equation | Units | |
|---|---|---|---|
| Diffusion coefficient, D |
|
cm | |
| Effective attenuation coefficient, μ eff |
|
cm−1 | |
| Effective reflection coefficient, R eff | 0.493 | Dimensionless | |
| Extrapolated boundary, z b |
|
cm | |
| Distance from true image source to surface, r 1 |
|
cm | |
| Distance from surface to virtual image sink, r 2 |
|
cm |
| (2) |
2.B.3. Selective plane convolution
The selective plane geometry excites nanophosphors at a fixed depth z 0 in the tissue when it is oriented parallel to the imaging surface with thickness z s . We assume the x‐ray‐activated nanophosphors operate as a collection of radiant point sources in the illumination plane. The surface radiance can be written as a two‐dimensional convolution of the luminescent photon distribution P(x,y,z) in the selective plane of x‐ray illumination with the Green's function for a luminescent point source at depth z.
| (3) |
The integral over z simply averages over the finite slice thickness.
2.B.4. Surface radiance optical signal detection
The final step in the model is detecting the surface radiance with the lens and camera pixel array. Equation (2) defines the average photons incident on pixel j in the array located at x j ,y j .
| (4) |
The equation is adapted from one derived by Barrett and Myers.23 The double integral accounts for averaging of the surface radiance over camera pixels of size ε, mapped into object space by the lens magnification factor m. The terms before the integral represent the fractional solid angle subtended by the lens. Here, N represents the lens f‐number and θ j is the angle of pixel j off the central imaging axis. This imaging geometry is depicted in Fig. 2(b).
2.C. Experimental XIL/SPXIL imaging
2.C.1. Nanophosphor fabrication
The nanophosphors studied in our XIL/SPXIL imaging were yttrium oxide crystals doped with europium (Y2O3:Eu3+). The synthesis combines yttrium nitrate (0.4 M) and europium nitrate (0.03 M) using a general urea homogeneous precipitation method wherein the solution is stirred at 85 °C for 4 h.19 Next, a centrifuge separates the precipitate and solution and the product is left to dry overnight at 110 °C. Finally, the nanoparticles are annealed at 1000 °C for 4 h to complete the synthesis. UV lamp illumination of the nanoparticles confirms the phosphorescent properties of the final product.
2.C.2. Nanophosphor characterization
Approximately 5 mg of nanoparticles were dissolved in an aqueous solution inside a cuvette. The cuvette interfaced with a fiber optic cable connected to the spectrometer (USB‐4000, Ocean Optics). The sample was irradiated with an unfiltered beam in a small animal irradiator (225Cx, Precisions X‐ray) with a tube voltage of 125 kVp and tube current of 23 mA to record the spectral emission of the XIL.
The next step in characterization of the nanophosphors was to test their luminescent output as a function of their concentration and radiation dose. The luminescence was measured using a cooled CCD camera (CoolSNAP HQ2, Photometrics) equipped with a macro lens (DX Micro‐NIKKOR, Nikon, Melville, NY, USA). The camera was set up inside the irradiator and shielded with lead sheets and leaded glass to reduce spurious counts from scattered x rays interacting directly with the CCD sensor.
X‐ray tube current was used as a proxy for dose. A cuvette containing a concentration of 5 mg/mL of nanophosphors dissolved in ethanol was exposed to unfiltered x rays for 20 s with the tube current varying from 1 to 15 mA with a constant tube voltage of 100 kVp. Five acquisitions at each tube current were averaged for noise reduction. The XIL signal was quantified by averaging the pixel values over a 15 pixel by 15 pixel region of interest (ROI) of uniform luminescence in the cuvette. This process was repeated with a fixed tube current of 13 mA, while tube voltage was varied from 40 to 225 kVp.
The same experimental arrangement was then used at varying nanophosphor concentrations ranging from 10 mg/mL to 0.05 mg/mL. The cuvettes were exposed for 20 s with the unfiltered x‐ray source operating at 70 kVp tube voltage and 20 mA tube current. The XIL images from four exposures were averaged per concentration and the mean pixel value in a ROI of uniform luminescence in the cuvette determined the resultant XIL.
2.C.3. Luminescent efficiency α NP measurement
The luminescent efficiency of the nanophosphors was calculated from measurements using a bioluminescence calibration mouse phantom containing LEDs of known photon output, and an identical fluorescence calibration mouse phantom (sans LEDs) that allowed insertion of capillary tubes bearing out Y2O3:Eu3+ nanoparticles (XPM‐2 and XFM‐2, Perkin‐Elmer). A capillary tube containing 10.5 mg of nanophosphors was inserted into the optically homogenous fluorescence calibration mouse phantom so that the XIL source sat 0.4 cm below the surface on the phantom. A CT of the mouse phantom confirmed the depth of the XIL source and measured the volume occupied by the nanophosphors in order to calculate their concentration. The mouse phantom was irradiated for 20 s at a tube voltage of 70 kVp and a tube current of 40 mA with a 2.8 mm Al filtering of lower energy x rays. A dosimetry measurement using a calibrated A‐12 ionization chamber determined the surface dose for these x‐ray tube settings. An x‐ray tube spectrum simulator (Siemens Healthcare GmbH, Erlangen, Germany) was then used to determine the mean x‐ray energy at the depth in the mouse phantom and the air kerma transmission factor. These factors determined the tissue dose to the region with the nanophosphors and a mass energy‐absorption coefficient ratio determined the dose absorbed by the high‐Z nanophosphors.
The corresponding bioluminescence calibration mouse phantom containing an isotropic LED source of known photon output and at the same depth as the nanophosphor point source was used to quantitate the photon count of the XIL measurement. The surface radiance of the matching portion of the mouse phantom was imaged with the camera for 20 s while the LED source was on. Surface radiance profiles for both the LED and XIL measurements were measured from the images. Simulated surface radiance profiles were generated using the diffuse optical model outlined in Section 2.B.2 in order to correct for the change in optical scattering and absorption for the LED emission shift. The surface radiance measurement and correction factor then determined a quantitative photon output from the XIL source. This result along with the concentration and dose calculation were used to derive the luminescent efficiency of the nanophosphors.
2.C.4. Optical phantoms for XIL/SPXIL imaging
A simple nonscattering optical phantom was fabricated in order to demonstrate the imaging geometry of SPXIL. A catheter tube was filled with the nanophosphors in an aqueous solution and wrapped around a test tube which created a spiral phantom. A slit collimator was manufactured using a Cerrobend disk. Radiochromic film measurements showed the x‐ray selective plane to be 1 mm thick at the irradiator's isocenter. The spiral phantom was translated in 1‐mm steps through the plane of illumination with a SPXIL image acquired at each step.
Optically homogenous gel phantoms provided a simple model to experimentally test the diffuse imaging equations for the nanophosphors at depth in a turbid medium. This gel phantom was also used to validate the SPXIL imaging geometry for diffuse imaging and perform a deconvolution‐based image restoration. A typical XIL/SPXIL imaging setup inside the small animal irradiator is shown in Fig. 1(b). Gel phantoms were constructed using agar along with Intralipid and black India ink, which emulate the optical scattering and absorption of mammalian tissue, respectively. The phantom's optical absorption and reduced scattering coefficients were adjusted by varying the concentration of the Intralipid and black ink so that the phantom possessed optical properties similar to mammalian tissue.24, 25 An agar gel phantom was fabricated with 0.5% Intralipid, and 0.0025% black India ink, which approximately corresponds to 0.25 cm−1 optical absorption coefficient and 5 cm−1 reduced scattering coefficient for the nanophosphors emission wavelength.
2.C.5. Postprocessing
The XIL acquired within the small animal irradiator exhibit “hot pixel” noise from x rays interacting with the CCD sensor due to imperfect shielding around the camera. This x‐ray‐induced noise creates a pixel value much greater than the surrounding pixels in the image. The hot pixels were identified by using a histogram of the raw images and they were replaced with the median value of their neighboring pixels. A dark image was created by averaging multiple images with no light, but the same exposure time as the XIL/SPXIL measurements and this was then subtracted from the XIL/SPXIL images in order to remove dark current contributions from the CCD sensor and the pixel value bias offset of the CCD array. The final images then had pixel values that were the results of only the detected luminescence so that XIL images for different source depths could be compared quantitatively in terms of the relative luminescent intensity.
2.D. Model calibration and sensitivity predictions
The XIL images acquired with the 10.5 mg nanophosphor source and diffuse optical gel phantoms were used to calibrate the imaging model outlined in Section 2.B. The calibrated model was then used to produce simulated XIL images for nanophosphor sources with varying concentrations, depths, radiation doses, and optical environments. The XIL images were simulated for the experimental setup with the cooled CCD and macro lens, and for a theoretical configuration using an EM‐CCD (iXon 897, Andor, Concord, MA, USA), larger aperture lens (EF 50 mm f/1.0 USM, Canon, Melville, NY, USA), and nanophosphors with a greater luminescent efficiency shown in Table 2. The luminescent efficiency assumed for the brighter nanophosphors is based on the paper of Pratx et al.,8 which was calculated from the properties of bulk Gd2O2S:Tb.26 The simulations determined the photon counts on the cameras’ sensor arrays and this was used to then calculate signal‐to‐noise ratios for the simulated concentration, optical, dose, and depth parameters using Eq. 5. The noise factor F accounts for counting noise amplification in the EM‐CCD.
Table 2.
CCD and EM‐CCD camera parameters used to calculate the signal‐to‐noise ratios in simulated XIL images. The cooled CCD camera with f/2.8 lens was used in experimental measurements with optical gel phantoms and the EM‐CCD camera with f/1.0 lens was used to delineate the upper limits of XIL imaging sensitivity by simulating optimal hardware
| Imaging system parameters | Cooled CCD with f/2.8 lens | EM‐CCD with f/1.0 lens |
|---|---|---|
| f‐number, N | 2.8 | 1.0 |
| Quantum efficiency, D QE | 60% | 95% |
| Pixel Size, ε | 6.45 μm | 13 μm |
| Imaging array size | 1392 × 1040 | 512 × 512 |
| Pixel binning | 8 × 8 | 4 × 4 |
| Dark current, δ dark | 0.001 e‐/pixel/s | 0.00015 e‐/pixel/s |
| Read noise, δ readout | 4.5 e‐ rms | 15 e‐ rms |
| Gain, M | 1 | 1000 |
| Noise factor, F | 1 | 1.41 |
| Luminescent efficiency, α NP | 1.06 photons/keV/(g/cm3) | 8.06 photons/keV/(g/cm3) |
| (5) |
2.E. Deconvolution methods for SPXIL imaging
The selective plane illumination constrains the x‐ray‐induced luminescence to a fixed depth in the object. Knowledge of the imaging depth along with the optical properties of the material determines the normalized surface radiance using Eq. (2). This represents the point spread function for a luminescent point source in an optically homogeneous, semi‐infinite medium. Deconvolution with the detected surface radiance and the PSF allows for reconstruction of the nanophosphor distribution in the plane of excitation. The optical signal detection suffers from Poisson counting noise along with Gaussian dark and readout noise from the camera electronics. Since the sum of a Poisson distribution and a Gaussian distribution does not yield a tractable likelihood function, we employ the shifted Poisson model,27, 28 in which the pixel value offset bias b is subtracted and the Gaussian noise variance σ 2 added to each measurement.
| (6) |
The resulting modified measurement is then approximately Poisson in that its mean equals its variance and it matches the first two moments of the true distribution.
A maximum likelihood Richardson–Lucy deconvolution29, 30 was then applied with update:
| (7) |
Here, f i is the image estimate at iteration i, and k is the PSF for a luminescent point source at the depth of selective plane excitation, obtained by appropriate discretization of Eq. (2). The iterations were stopped when the L2 norm of the difference between consecutive iterations was less than 10−6.
3. Results
3.A. Characterization of nanoparticles
Spectroscopy measurements of the irradiated nanophosphors shown in Fig. 3(a) exhibited a central peak emission at 611 nm with secondary peaks centered on 590 nm, 627 nm, and 709 nm. These values are consistent with the literature on Y2O3:Eu3+ nanoparticles.2, 19 The phosphorescence demonstrated a linear dependence on both the nanoparticle concentration in Fig. 3(b) and the x‐ray tube current in Fig. 3(c), which is consistent with research studying other Eu‐ and Tb‐based nanophosphors.31 These results validate the basis of Eq. (1), which determines the photons generated a depth in tissue from SPXIL. Finally, luminescent output was quadratic with respect to tube voltage as shown in Fig. 3(d). The dominant effect with this result is likely the quadratic relationship between tube voltage and the tube's output photon flux.
Figure 3.
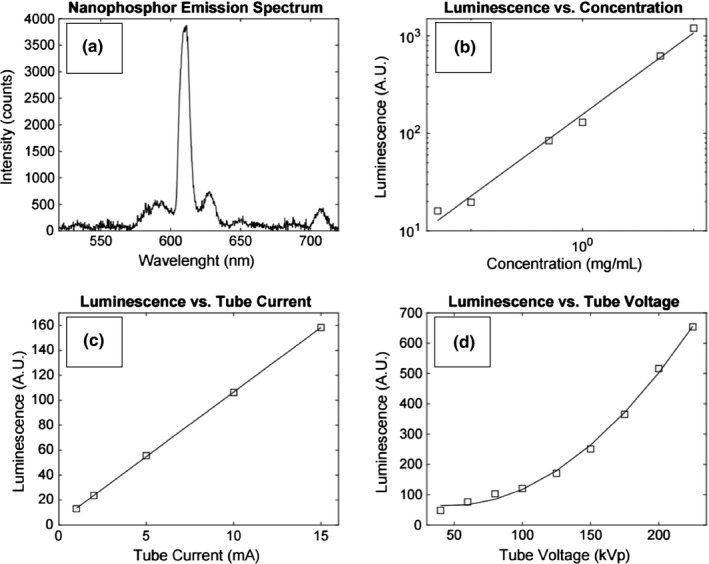
(a) Y2O3:Eu3+ nanophosphor emission spectrum with central peak emission at 611 nm. The measured luminescence was linear with respect to nanoparticle concentration shown in (b). Similarly, the luminescence was linear with respect to the tube current shown in (c), implying luminescence is proportional to radiation dose. Luminescence increased quadratically with respect to tube voltage as seen in (d).
The CT volume measurement showed the 10.5 mg nanophosphor source occupied 5.8 × 10⁻³ cm3 inside the optical mouse phantom. Therefore, the concentration of the nanoparticles was 1.8 g/cm3. The ionization chamber measurement of the x‐ray tube settings determined the surface dose to be 95.3 cGy. The x‐ray tube simulator calculated the mean x‐ray energy at 1.27 cm depth in the mouse phantom to be 43.4 keV with an air kerma transmission factor of 0.639. The density of the plastic mouse phantom was 1.11 g/cm3. The radiation dose to the nanophosphor source after correcting for their effective atomic number of Z = 38 was determined to be 4.24×10¹⁴ keV/g. Finally, the XIL nanophosphor source was determined to be 2.9 times brighter than the calibrated LED source in the mouse phantom after correcting for the difference in optical photon diffusion at the different wavelengths of the two sources. This correction was calculated as a ratio between simulated normalized surface radiances for the nanophosphors’ emission of 611 nm and the LED's emission of 635 nm using the corresponding wavelength‐dependent optical absorption and scattering coefficients of the mouse phantoms as provided by the manufacturer. Therefore, the XIL surface radiance measurement determined that the nanophosphors emitted 5.22 × 10¹² photons during the 20 s x‐ray exposure. The known photon output and dose measurement was then used to calculate the luminescent efficiency of the nanophosphors using Eq. (1), which was α NP = 1.06 (photon/keV)/(g/cm3). This value is of the same order of magnitude as other inorganic scintillators when their light yield is scaled by their bulk crystal density.26
3.B. XIL model calibration with optical gel phantom
The 10.5‐mg nanophosphor source was inserted into an optical gel phantom and CT scan measurements determined the depths to be 1.6 cm, 2.2 cm, and 2.6 cm as shown in Figs. 4(a)–4(c). TLD dosimetry measurements in a gel phantom determined the dose to the gel phantom in the region of the nanophosphors to be 33.8 cGy for a 20 s exposure with a tube voltage of 70 kVp and tube current of 40 mA. The corresponding surface radiance measurements for the three depths are shown in Fig. 5. These images represent multiple surface radiance measurements averaged together after the postprocessing described in Section 2.C.5.
Figure 4.

CT slices of the 10.5 mg nanophosphor source in the optical gel phantom. XIL surface radiance images were acquired with the source at the depths of 1.6 cm (a), 2.2 cm (b), and 2.6 cm (c) below the imaging surface.
Figure 5.

XIL surface radiance images were acquired with the source at the depths of 1.6 cm (a), 2.2 cm (b), and 2.6 cm (c) below the imaging surface. The dark spots in the XIL measurement were caused by dust on the camera's imaging window.
The XIL model was used to generate surface radiance profiles based on the optical properties of the gel phantom along with the experimental CCD camera and lens specifications. The simulation was then scaled with a calibration factor to account for light loss in the lens and leaded glass along with other unknown instrumental factors. Note that Rice et al. also implicitly renormalized the surface radiance curves in a similar fashion in their study of bioluminescence sensitivity.20 A single calibration factor could not properly scale the curves at all three depths. The scaling factors listed in Table 3 exhibited a depth dependence that may be due to additional absorption losses. Figure 6 shows the detected surface radiance profiles for the three source depths and the simulated surface radiance profiles with each simulated profile individually scaled to their corresponding measurement. The agreement of the simulation profile widths with the measured data demonstrates the photon diffusion modeling accurately predicts the spreading of the optical signal as the photons scatter on their path toward the imaging surface.
Table 3.
Depth‐dependent scaling factor used in Fig. 6 in order to match the simulated surface radiance height with the measured surface radiance. The simulated surface radiances overestimated the measured pixel values for each depth. Therefore, the simulated surface radiances were divided by the scaling factors
| Source depth (cm) | Scaling factor |
|---|---|
| 1.6 | 170 |
| 2.2 | 105 |
| 2.6 | 64.4 |
Figure 6.
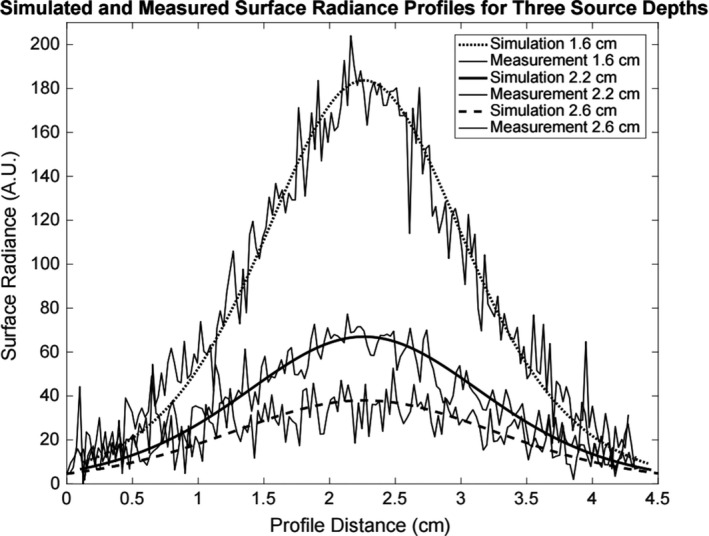
Experimental XIL surface radiance profiles of the optical gel phantom with the corresponding simulated profiles for a point source at the depths of 1.6 cm, 2.2 cm, and 2.6 cm. Each simulated surface radiance profile is individually scaled to the approximate peak of the corresponding measurement. The analytical optical diffusion model accurately predicts the FWHMs of the surface radiance profile measurements.
Rather than introducing a depth‐dependent calibration factor in the detection sensitivity estimates, we scaled the model so that the surface radiance peak value for the 2.2‐cm depth source simulation matched the peak height for the XIL measurement. This leads to an overestimation (~60%) of the signal at 1.6 cm and an underestimation (~40%) of the signal at 2.6 cm depth. Since our interest is in determining the imaging depth limits, this scaling ensures that the predictions will be somewhat conservative at greater depths.
3.C. Detection sensitivity estimates
The calibrated simulation was then used to generate surface radiance measurements for varying depths, concentrations, radiation doses, and imaging environments using both the experimental CCD camera and lens setup along with the theoretical configuration with improved detection hardware as listed in Table 2. The corresponding signal‐to‐noise ratios (SNRs) were calculated using Eq. 5, the simulated incident photon count on each pixel, and camera sensor specifications. The minimum detectable signal was set at a SNR threshold of five. Figure 7 displays the SNR curves for nanophosphor concentration versus depth using the experimental radiation dose of 33.8 cGy and the optical properties of the experimental gel phantom. The simulated theoretical configurations are split into a setup with improved detection hardware with the experimental nanophosphors and a setup utilizing improved hardware and brighter nanophosphors. The theoretical setup with more sensitive equipment and brighter nanoparticles decreases the minimum concentration for detection by approximately three orders of magnitude compared to the experimental setup with the synthesized nanoparticles.
Figure 7.
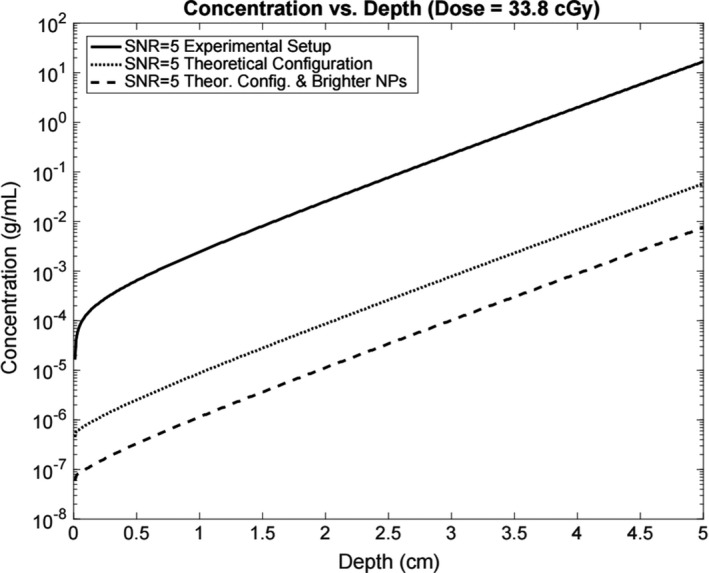
Minimum detectable concentration vs depth of nanoparticles for the experimental setup, a theoretical setup using a f/1.0 lens and an EM‐CCD camera, and a theoretical setup with the f/1.0 lens, EM‐CCD camera, and brighter nanophosphors.
Figure 8 depicts the SNR curves for radiation dose vs the depth of a nanophosphor point source with a concentration of 1 mg/mL. The theoretical configuration in the dose vs depth simulation employs improved detection hardware and brighter nanophosphors. Both the experimental and theoretical setup curves show the minimum detectable dose for the optical properties of the experimental gel phantom (μ a = 0.25 cm−1, = 5 cm−1), and a phantom that absorbs and scatters more light (μ a = 0.5 cm−1, = 10 cm−1).
Figure 8.
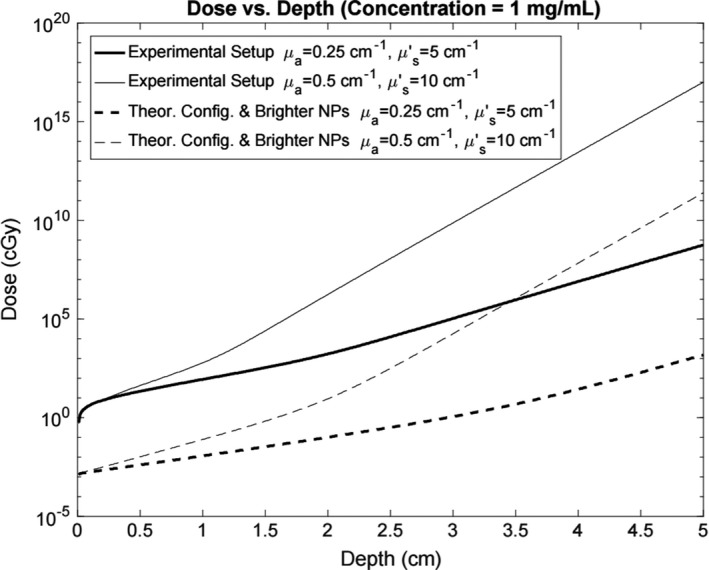
Minimum radiation dose for signal detection versus depth for a 1 mg/mL point source for the experimental setup and the theoretical configuration with more sensitive equipment and brighter nanophosphors. Each setup includes curves for the optical properties of the experimental gel phantom and for a greater optically scattering and absorbing environment.
3.D. Selective plane x‐ray‐induced luminescence imaging results
The nonscattering phantom demonstrated a simple proof‐of‐concept validation for the SPXIL imaging geometry. The phantom, depicted in Fig. 9(a), was moved in 1 mm steps through an x‐ray sheet beam in order to acquire individual slices of the XIL images shown in Figs. 9(b)–9(d). These slices were arranged in an image stack and the orthogonal maximum intensity projection recovered the original form of the twisting catheter tube containing nanophosphors as seen in Fig. 9(e).
Figure 9.

(a) White light image of the nonscattering optical phantom. (b), (c), and (d) are individual SPXIL images of the phantom. (e) The z‐projection of the image stack, which reconstructs the twisting tube from the individual slices. [Color figure can be viewed at wileyonlinelibrary.com]
Next an optically scattering gel phantom was fabricated containing two test tubes with nanophosphor dispersed in an agar gel. The test tubes were 4 mm wide with their centers separated by 1 cm. The tips of the test tubes sat 0.5 cm below the imaging surface. Figure 10(a) depicts the CT maximum intensity projection of the two test tubes in the gel phantom. The 2.5‐mm‐thick collimated x‐ray sheet beam impinged on the phantom perpendicular to the projection in Fig. 10(a) and parallel to the imaging surface seen at the top of the CT projection. The phantom was irradiated for 20 s with a tube voltage of 140 kVp and a tube current of 20.9 mA. The selective plane illuminated at a depth of 0.5 cm below the imaging surface in the phantom and was translated 0.25 cm deeper for each consecutive image until there was no longer a detectable signal present. A total of eight SPXIL images were acquired.
Figure 10.
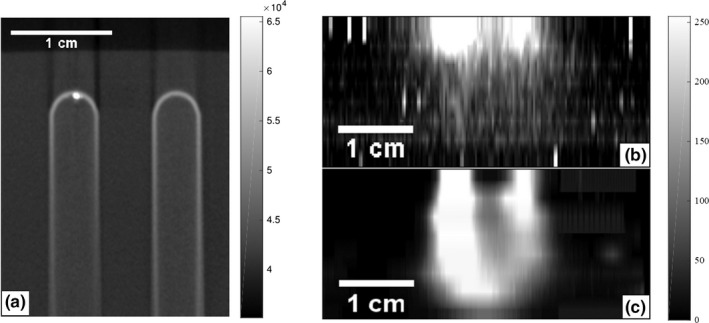
(a) CT maximum intensity projection of the two test tubes containing the nanophosphors suspended in agar. The test tubes were embedded in the optical gel phantom with the tips sitting 0.5 cm below the images surface. A selective x‐ray plane orthogonal to these images and 2.5‐mm‐thick irradiated the phantom and eight SPXIL images of the surface radiance were acquired. (b) Maximum intensity projection of the SPXIL image stack before deconvolving. (c) Maximum intensity projection of the SPXIL image stack after deconvolution. The two tubes are resolved in the deconvolution up to 1.75 cm below the imaging surface.
The SPXIL images after postprocessing are shown in Figs. 11(a)–11(c) for three depths. The corresponding deconvolutions are shown in Figs. 11(d)–11(f). After 2.0 cm depth in the phantom, the x‐ray sheet beam and deconvolution could no longer resolve the two distinct sources. The deconvolved SPXIL images were arranged in a stack to create a three‐dimensional reconstruction of the two nanophosphor sources. Figure 10(b) shows the maximum intensity projection of the SPXIL image stack after postprocessing and Fig. 10(c) shows the SPXIL image stack after deconvolution.
Figure 11.
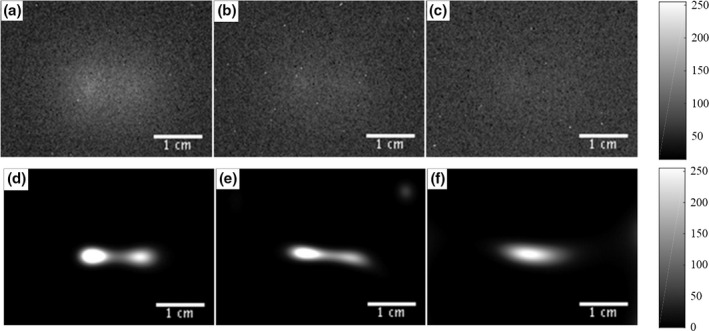
Two source phantom SPXIL surface radiance images for depths 1.0 cm (a), 1.5 cm (b), and 2.0 cm (c) with corresponding deconvolved images (d), (e), and (f). It was not possible to resolve the two point sources from the raw surface radiance measurements after a selective plane depth of 1.0 cm. However, the deconvolution was able to resolve the two point sources up to a depth of 1.75 cm.
4. Discussion
The dose vs depth sensitivity simulation predicted that, with an optimized geometry, improved hardware, and brighter nanoparticles, a concentration of 1 mg/mL could be detected with a dose of about 1 cGy at a depth from 2 to 4 cm depending on the tissue optical properties. The experimental and simulated gel phantoms used in this sensitivity evaluation do not represent a specific tissue, but rather demonstrate diffuse imaging in a turbid material with optical properties within the range of biological tissue.25 The simulation with the current experimental hardware and nanophosphors indicates a minimum dose of 106 cGy to achieve signal detection at comparable depths for a concentration of 1 mg/mL. Therefore, a setup comparable to the theoretical configuration with a high degree of sensitivity is required in order to carry out XIL imaging using clinically relevant radiation doses and nanophosphor concentrations.
Potential applications under such conditions could include intratumoral injections to treat relatively superficial head and neck cancers. Similar concentrations of metal‐oxide framework nanoparticles studied as photodynamic therapy light sources have been tested in vivo using a murine model in order to develop a therapy for resistant head and neck cancers.32 These nanoparticles also exhibit radioluminescence,33 so that their localization could be roughly determined from surface radiance measurements for a radiation‐activated photodynamic therapy treatment. Such imaging could potentially be achieved under normal light conditions in the clinic since Cherenkov luminescence has been detected under ambient lighting by timing the camera acquisitions with the LINAC waveform pulses.34
The XIL measurements in the gel phantom with the point source of a fixed concentration allowed for the calibration of the imaging model, which was then used for the sensitivity evaluations. There was no depth information in these XIL surface radiance measurements, because the phantom was fully irradiated. It is not possible to determine a potential three‐dimensional source distribution in the object from a two‐dimensional surface radiance measurement. The SPXIL measurements, however, were able to reconstruct the two tubes from the surface radiance measurements, because the selective plane constrained the luminescence to a known cross‐section in the object. Applying a deconvolution allowed for the two sources to be resolved up to a depth of 1.75 cm in the optical gel phantom. The SPXIL measurements were able to determine the three‐dimensional nanophosphor distribution as seen in Fig. 11(c), which would be impossible for an XIL measurement in which the entire phantom is irradiated at once.
The results presented here focused on optically homogenous materials, which allowed rapid, tractable sensitivity calculations. Expanding the studies to optically heterogeneous materials would affect both our sensitivity simulations and our SPXIL imaging model. The selective plane imaging model would no longer involve a simple convolution. However, constraining the luminescence to a known depth would still result in the surface radiance being a two‐dimensional integral equation involving the nanophosphor distribution in the plane of excitation. The kernel of that imaging equation, no longer shift invariant, would then depend on the optical properties of the heterogeneous material.18 A noninvasive surrogate method of estimating these optical properties could potentially come from existing MR or CT imaging of the treatment area, so that the anatomical information could be incorporated into the inverse problem.35
Another limitation of this work is the assumption of a flat imaging surface. Surface radiance measurements in small animals or patients would rarely involve a relatively smooth, flat surface. Along with being optically heterogenous, the imaging surface would contain some curvature which would affect the resulting surface radiance measurement. There is no simple analytical solution for diffuse optical imaging moving away from the semi‐infinite air–tissue interface with no curvature. Monte Carlo simulations have been used to model the effect of curvature on Cherenkov luminescence at the imaging surface.36 This modeling could be extended to XIL and SPXIL imaging in order to account for nonflat surfaces.
5. Conclusions
This work outlines a convolution‐based imaging model for SPXIL in a semi‐infinite optically homogenous environment. The selective plane excitation geometry was verified using a simple nonscattering phantom filled with x‐ray‐activated nanophosphors. We then presented the first experimental SPXIL imaging results in a diffuse phantom using deconvolution to resolve dual nanophosphor sources at depth. The selective plane geometry allowed for a three‐dimensional, direct imaging of the dual nanophosphor sources from two‐dimensional surface radiance measurements. The linearity of the XIL signal with nanophosphor concentration and radiation dose was verified with basic characterization measurements. The emission spectrum of Y2O3:Eu3+ nanophosphors was measured via optical spectroscopy, and a simple measurement using a commercially calibrated bioluminescence mouse phantom, offered an estimate of the luminescent efficiency of the synthesized nanophosphors. XIL measurements of a point source in an optical gel phantom were then used to calibrate the imaging model so that surface radiance simulations could be generated for various source depths, radiation doses, nanophosphor concentrations and optical properties. These simulations were then used for signal‐to‐noise calculations that evaluated the sensitivity for this imaging modality under the ideal circumstance of an optically homogenous medium with a flat surface. Future work will seek to expand to optically heterogenous materials with curved surfaces using a more general imaging model for the selective plane illumination imaging geometry.
Acknowledgments
This work was supported in part by the National Institute of Biomedical Imaging and Bioengineering of the National Institutes of Health (NIH) under grant number R01EB017293 and T32 EB002103, and by the National Cancer Institute of the NIH under grants R01CA164492 and R01CA171785. Partial funding for the computation in this work was provided by NIH Grant Nos. S10 RRO21039 and P30 CA14599. Its contents are solely the responsibility of the authors and do not necessarily represent the official views of the National Institutes of Health.
References
- 1. Ahmad M, Pratx G, Bazalova M, Xing LEI. X‐ray luminescence and x‐ray fluorescence computed tomography : new molecular imaging modalities. IEEE Access. 2014;2:1051–1061. [Google Scholar]
- 2. Souris JS, Cheng S‐H, Pelizzari C, et al. Radioluminescence characterization of in situ x‐ray nanodosimeters: potential real‐ time monitors and modulators of external beam radiation therapy radioluminescence characterization of in situ x‐ray nanodosimeters: potential real‐time monitors and modu. Appl Phys Lett. 2014;105:203110. [DOI] [PMC free article] [PubMed] [Google Scholar]
- 3. Liu Y, Chen W, Wang S, Joly AG. Investigation of water‐soluble x‐ray luminescence nanoparticles for photodynamic activation. Appl Phys Lett. 2008;92:12–15. [Google Scholar]
- 4. Ma L, Zou X, Chen W. A new x‐ray activated nanoparticle photosensitizer for cancer treatment. J Biomed Nanotechnol. 2014;10:1501–1508. [DOI] [PubMed] [Google Scholar]
- 5. Kaščáková S, Giuliani A, Lacerda S, et al. X‐ray‐induced radiophotodynamic therapy (RPDT) using lanthanide micelles: beyond depth limitations. Nano Res. 2015;8:2373–2379. [Google Scholar]
- 6. Chen H, Moore T, Qi B, et al. Monitoring pH‐triggered drug release from radioluminescent nanocapsules with X‐ray excited optical luminescence. ACS Nano. 2013;7:1178–1187. [DOI] [PMC free article] [PubMed] [Google Scholar]
- 7. Retif P, Pinel S, Toussaint M, et al. Nanoparticles for radiation therapy enhancement: the key parameters. Theranostics. 2015;5:1030–1044. [DOI] [PMC free article] [PubMed] [Google Scholar]
- 8. Pratx G, Carpenter CM, Sun C, Xing L. X‐ray luminescence computed tomography via selective excitation: a feasibility study. IEEE Trans Med Imaging. 2010;29:1992–1999. [DOI] [PubMed] [Google Scholar]
- 9. Pratx G, Carpenter CM, Sun C, Rao RP, Xing L. Tomographic molecular imaging of x‐ray‐excitable nanoparticles. Opt Lett. 2010;35:3345–3347. [DOI] [PubMed] [Google Scholar]
- 10. Li C, Di K, Bec J, Cherry SR. X‐ray luminescence optical tomography imaging : experimental studies. Opt Lett. 2013;38:2339–2341. [DOI] [PMC free article] [PubMed] [Google Scholar]
- 11. Li C, Martínez‐Dávalos A, Cherry SR. Numerical simulation of x‐ray luminescence optical tomography for small‐animal imaging. J Biomed Opt. 2014;19:46002. [DOI] [PMC free article] [PubMed] [Google Scholar]
- 12. Zhang W, Zhu D, Lun M, Li C. Multiple pinhole collimator based X‐ray luminescence computed tomography. Biomed Opt Express. 2016;7:2506–2523. [DOI] [PMC free article] [PubMed] [Google Scholar]
- 13. Chen D, Zhu S, Yi H, et al. Cone beam x‐ray luminescence computed tomography: a feasibility study. Med Phys. 2013;40:31111. [DOI] [PubMed] [Google Scholar]
- 14. Chen D, Zhu S, Chen X, et al. Quantitative cone beam X‐ray luminescence tomography/X‐ray computed tomography imaging. Appl Phys Lett. 2014;105:191104. [Google Scholar]
- 15. Zhang G, Liu F, Liu J, et al. Cone beam x‐ray luminescence computed tomography based on Bayesian method. IEEE Trans Med Imaging. 2017;36:225–235. [DOI] [PMC free article] [PubMed] [Google Scholar]
- 16. Pogue BW. High resolution molecular imaging with cerenkov‐excited luminscence scanned imaging (CELSI). In: Optics in the Life Sciences, OSA Technical Digest (online). Washington, DC: Optical Society of America, 2015: paper BM3A.1. [Google Scholar]
- 17. Brůža P, Lin H, Vinogradov SA, Jarvis LA, Gladstone DJ, Pogue BW. Light sheet luminescence imaging with Cherenkov excitation in thick scattering media. Opt Lett. 2016;41:2986–2989. [DOI] [PubMed] [Google Scholar]
- 18. Cong W, Wang G. X‐ray fan‐beam luminescence tomography. Austin J Biomed Eng. 2014;1:1024. [Google Scholar]
- 19. Lü Q, Li A, Guo F, Sun L. The two‐photon excitation of SiO 2 ‐coated Y2O3:Eu3+ nanoparticles by a near‐infrared femtosecond laser. Nanotechnology. 2008;19:205704. [DOI] [PubMed] [Google Scholar]
- 20. Rice BW, Cable MD, Nelson MB. In vivo imaging of light‐emitting probes. J Biomed Opt. 2001;6:432–440. [DOI] [PubMed] [Google Scholar]
- 21. Jacques SL, Pogue BW. Tutorial on diffuse light transport. J Biomed Opt. 2008;13:41302. [DOI] [PubMed] [Google Scholar]
- 22. Haskell RC, Svaasand LO, Tsay TT, Feng TC, McAdams MS, Tromberg BJ. Boundary conditions for the diffusion equation in radiative transfer. J Opt Soc Am A Opt Image Sci. 1994;11:2727–2741. [DOI] [PubMed] [Google Scholar]
- 23. Barrett HH, Myers KJ, Rathee S. Foundations of image science. Med Phys. 2004;31:620. [Google Scholar]
- 24. Cubeddu R, Pifferi A, Taroni P, Torricelli A. A solid tissue phantom for photon migration studies. Phys Med Biol. 1971;42:1971–1979. [DOI] [PubMed] [Google Scholar]
- 25. Jacques SL. Optical properties of biological tissues: a review. Phys Med Biol. 2013;58:5007–5008. [DOI] [PubMed] [Google Scholar]
- 26. Van Eijk CWE. Inorganic scintillators in medical imaging detectors. Nucl Instrum Methods Phys Res Sect A Accel Spectrom, Detect Assoc Equip. 2003;509:17–25. [Google Scholar]
- 27. Snyder DL, Hammoud AM, White RL. Image recovery from data acquired with a charge‐coupled‐device camera. J Opt Soc Am A. 1993;10:1014–1023. [DOI] [PubMed] [Google Scholar]
- 28. Snyder DL, Helstrom CW, Lanterman AD, White RL, Faisal M. Compensation for readout noise in CCD images. J Opt Soc Am A. 1995;12:272. [Google Scholar]
- 29. Richardson WH. Bayesian‐based iterative method of image restoration*. J Opt Soc Am. 1972;62:55. [Google Scholar]
- 30. Lucy LB. An iterative technique for the rectification of observed distributions. Astron J. 1974;79:745. [Google Scholar]
- 31. Carpenter CM, Sun C, Pratx G, Rao R, Xing L. Hybrid x‐ray/optical luminescence imaging: characterization of experimental conditions. Med Phys. 2010;37:4011–4018. [DOI] [PMC free article] [PubMed] [Google Scholar]
- 32. Lu K, He C, Lin W. Nanoscale metal − organic framework for highly effective photodynamic therapy of resistant head and neck cancer. J Am Chem Soc. 2014;136:16712–16715. [DOI] [PMC free article] [PubMed] [Google Scholar]
- 33. Wang C, Volotskova O, Lu K, et al. Synergistic assembly of heavy metal clusters and luminescent organic bridging ligands in metal‐organic frameworks for highly efficient X‐ray scintillation. J Am Chem Soc. 2014;136:6171–6174. [DOI] [PMC free article] [PubMed] [Google Scholar]
- 34. Glaser AK, Zhang R, Davis SC, Gladstone DJ, Pogue BW. Time‐gated Cherenkov emission spectroscopy from linear accelerator irradiation of tissue phantoms. Opt Lett. 2012;37:1193–1195. [DOI] [PMC free article] [PubMed] [Google Scholar]
- 35. Hyde D, Schulz R, Brooks D, Miller E, Ntziachristos V. Performance dependence of hybrid x‐ray computed tomography/fluorescence molecular tomography on the optical forward problem. J Opt Soc Am A Opt Image Sci Vis. 2009;26:919–923. [DOI] [PubMed] [Google Scholar]
- 36. Zhang R, Glaser AK, Andreozzi J, et al. Beam and tissue factors affecting Cherenkov image intensity for quantitative entrance and exit dosimetry on human tissue. J Biophotonics. 2016;12:1–12. [DOI] [PMC free article] [PubMed] [Google Scholar]


