Abstract
Purpose
The aim of this study was to develop a portable perfusion phantom and validate its utility in quantitative dynamic contrast‐enhanced magnetic resonance imaging of the abdomen.
Methods
A portable perfusion phantom yielding a reproducible contrast enhancement curve (CEC) was developed. A phantom package including perfusion and static phantoms were imaged simultaneously with each of three healthy human volunteers in two different 3T MR scanners. Look‐up tables correlating reference (known) contrast concentrations with measured ones were created using either the static or perfusion phantom. Contrast maps of image slices showing four organs (liver, spleen, pancreas, and paravertebral muscle) were generated before and after data correction using the look‐up tables. The contrast concentrations at 4.5 min after dosing in each of the four organs were averaged for each volunteer. The mean contrast concentrations (4 organs × 3 volunteers = 12) were compared for the two scanners, and the intra‐class correlation coefficient (ICC) was calculated. Also, the ICC of the mean Ktrans values between the two scanners was calculated before and after data correction.
Results
The repeatability coefficient of CECs of perfusion phantom was higher than 0.997 in all measurements. The ICC of the tissue contrast concentrations between the two scanners was 0.693 before correction, but increased to 0.974 after correction using the look‐up tables (LUTs) of perfusion phantom. However, the ICC was not increased after correction using static phantom (ICC: 0.617). Similarly, the ICC of the Ktrans values was 0.899 before correction, but increased to 0.996 after correction using perfusion phantom LUTs. The ICC of the Ktrans values, however, was not increased when static phantom LUTs were used (ICC: 0.866).
Conclusions
The perfusion phantom reduced variability in quantitating contrast concentration and Ktrans values of human abdominal tissues across different MR units, but static phantom did not. The perfusion phantom has the potential to facilitate multi‐institutional clinical trials employing quantitative DCE‐MRI to evaluate various abdominal malignancies.
Keywords: abdomen, DCE‐MRI , perfusion parameters, perfusion phantom, static phantom
1. Introduction
Dynamic contrast‐enhanced magnetic resonance imaging (DCE‐MRI) is a non‐invasive physiologic MRI modality that can quantitate the microvascular perfusion (or permeability depending on the size of a contrast agent) in a target tissue.1 Quantitative DCE‐MRI has been evaluated for diagnosis, prognosis and therapy monitoring of various cancers including brain, breast and prostate cancers.2, 3, 4 However, DCE‐MRI is challenging in the upper abdomen due to motion of the internal organs produced by breathing and peristalsis. More recently, several image co‐registration methods have been introduced,5, 6, 7, 8 and quantitative DCE‐MRI evaluation of abdominal organs and pathologies has been reported in multiple institutions.9, 10, 11 However, variability in perfusion parameters obtained in different MR scanners remains a serious concern for accurate and reproducible application of DCE‐MRI in multi‐site clinical trials.12, 13, 14, 15
To minimize MR scanner dependent variables, one approach is the use of an external phantom to provide a look‐up table for quantitating absolute tissue contrast concentration. Each MRI vendor provides unique hardware configurations, pulse sequences and reconstruction algorithms, and these cause variations in quantitation of T1 values, tissue contrast concentrations and perfusion parameters. Besides, the original settings may drift owing to hardware instability,16 thus an external phantom should be small enough to be imaged concurrently in the bore of an MR scanner with a patient for on‐site quality assurance, but large enough not to suffer from partial volume effect.17 The use of a static phantom comprised of multiple objects with different contrast concentrations was suggested to correct the variability in quantitating tissue contrast concentration.18 However, whether a static phantom can be a reliable standard for dynamically changing tissue contrast concentration is questionable. In addition, B1 inhomogeneity over the field of view should be measured, because flip angle is proportional to B1 field strength. But, most B1 mapping techniques are T1 dependent, thus flip angle on a static phantom with high contrast concentration may not be accurately measured.19, 20, 21, 22 Perfusion phantoms varying their contrast concentrations were previously developed for system calibration and pharmacokinetic modeling for prostate and breast cancers.23, 24 But those are too bulky to be imaged with a test subject at the same time, hence the variation in quantitative values between image acquisitions cannot be corrected. In addition, these large phantoms are costly and not easily operable by clinical MRI technologists, limiting adoption of those for routine clinical settings.
The goal of this study was to develop a novel, portable and disposable perfusion phantom to correct MR scanner dependent variations in quantitating tissue perfusion parameters in abdominal DCE‐MRI. The perfusion phantom was designed to yield a constant contrast enhancement curve (CEC), serving as a reference for dynamically changing contrast concentrations of abdominal tissues in a human subject scanned together. This phantom was made of inexpensive materials and designed to be readily operable by MRI technologists to enable routine clinical use ultimately. We verified the utility of this phantom with human volunteers in comparison with a static phantom.
2. Materials and methods
The clinical study was approved by our institutional review board. All human subjects signed informed consent, and the health insurance portability and accountability act was strictly observed.
2.A. Perfusion phantom
Figure 1(a) is a photograph of the perfusion phantom with dimensions. The phantom is composed of top and bottom chambers with a plastic insert between them [Fig. 1(b)]. The top chamber measures 1 × 10 × 150 mm (height x width x length), and the bottom chamber measures 15 × 10 × 150 mm. A semi‐permeable membrane (Spectra/Por® 2 dialysis membrane; pore size: 12~14 kD; SpectrumLabs, Rancho Dominguez, CA, USA) separates the top and bottom chambers, and the insert is placed under the membrane to prevent sagging. Both chambers are filled with deionized water before use. After starting DCE‐MRI, gadoteridol (100 mM) is infused to the top chamber at a constant rate (0.06 ml/s; 3 ml) using a syringe pump (NE‐1600, New Era Pump Systems, Inc.; Farmingdale, NY, USA), to push the water in the top chamber out to the waste chamber (height × width × length = 20 × 20 × 17 mm) that is located lateral to the top chamber. Infusing 100 mM gadoteridol provided contrast concentration values in the phantom that match the range encountered in abdominal tissues. Gadoteridol within the top chamber then gradually diffuses to the bottom chamber over time. This phantom was designed using a computer‐aided design software package, SolidWorks (Dassault Systemes American Corp., Waltham, MA, USA), and printed on a Stratasys Objet30 Pro 3D printer (Eden Prairie, MN, USA) using VeroClear material.
Figure 1.
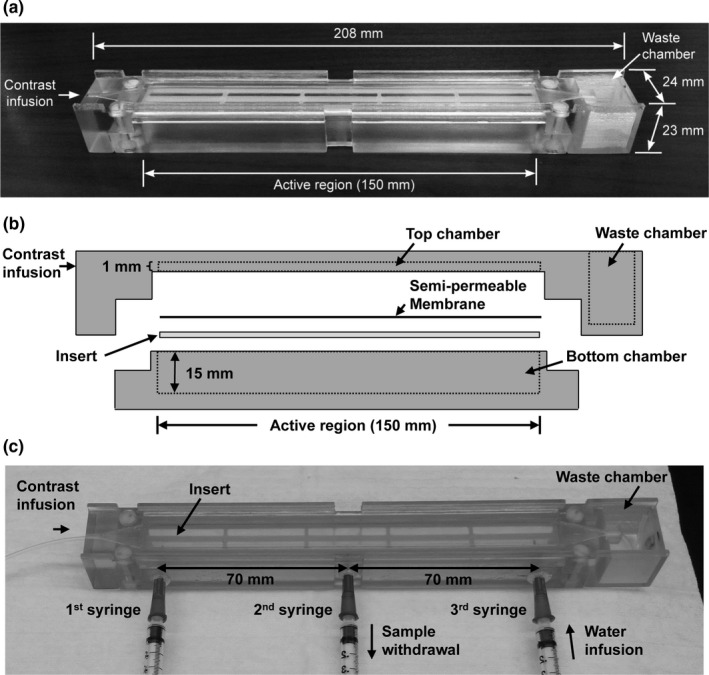
Novel perfusion phantom. (a) A photograph of the perfusion phantom with dimensions. (b) Schematic of the perfusion phantom, which is comprised of a top and bottom chamber with an insert between them. A semi‐permeable membrane is located on the top of the insert; the insert prevents sagging of the membrane. (c) The perfusion phantom modified for LC‐MS sampling. Three 23G blunt needles (0.5‐mm long) were inserted through equally spaced 1‐mm holes at the bottom chamber. Two magnetic micro stir bars were placed inside the bottom chamber and rotated at 400 rpm during sampling. Eleven samples (0.25 ml per sample; 0.05 ml/s) were collected from the second syringe every minute after gadoteridol infusion, while the same amount of deionized water was added simultaneously using the third syringe. The first syringe was not used in this study.
Before being evaluated with human subjects, the phantom was tested. The change in contrast concentration in the bottom chamber was quantitatively assessed using hydrophilic interaction chromatography (HILIC) with tandem mass spectrometry detection (LC‐MS).25 For sampling, the perfusion phantom was modified by drilling three 1‐mm holes equally spaced along the bottom chamber [Fig. 1(c)]. A 23G blunt needle (5‐mm long) was inserted into each hole and potted into place with epoxy. Two magnetic micro stir bars (2 × 7 mm; Fisher Scientific, Pittsburgh, PA, USA) were placed inside the bottom chamber and rotated at 400 rpm by digital magnetic stirrer (IKA, Wilmington, NC, USA). A total of 11 samples (0.25 ml per sample; 0.05 ml/s) were collected from the second syringe every minute after starting gadoteridol infusion, while the same amount of deionized water was added using the third syringe simultaneously.
LC‐MS was performed using an Atlantis HILIC silica column (2.1 × 100 mm; inner diameter: 5 μm) (Waters Corporation, Milford, MA, USA) under isocratic conditions. The mobile phase was a mixture of 10 mM ammonium acetate‐methanol‐acetonitrile (46:27:27, v/v/v) delivered at a flow rate of 0.7 ml/min. Column effluents were analyzed using positive IonSpray ionization and a triple quadrupole mass spectrometer (4000 Q Trap, SCIEX, Framingham, MA, USA) operating in multiple‐reaction monitoring mode. An eight point standard curve (0~1 mM gadoteridol) was prepared using deionized water as the diluent. Concentrations of test samples were calculated using linear regression analysis. This experiment was repeated three times, and the mean value of each sample was calculated.
MRI signal changes in the phantom were imaged using a small‐animal 9.4T MR scanner with a surface coil (Bruker BioSpin Corp.; Billerica, MA, USA). DCE‐MRI was conducted using a multi‐slice 2D spoiled gradient echo sequence (FLASH) with the following parameters: repetition time (TR)/echo time (TE) = 100/3 ms, field of view (FOV) = 30 × 30 mm, NEX = 4, thickness/gap = 4/0 mm (interlaced), slice number = 7, frequency/phase encoding = 128/128, flip angle = 30°, and NEX = 1. DCE‐MRI continued for 9 min after 100 mM gadoteridol infusion with a temporal resolution of 12.8 s.
2.B. Static phantom
Gadoteridol was diluted with deionized water in 15‐ml sterile conical‐bottom tubes (Fisher Scientific, Waltham, MA, USA) to yield static phantoms with contrast concentrations ranging from 0 to 5 mM. Gelatin (Knox Gelatin; Associated Brands Inc.; Medina, NY, USA) was added to solidify the phantom (6% by volume), and sodium azide (1%) was added as a preservative. The cap of each tube was sealed using adhesive silicone (Kwik Seal; DAP products Inc; Baltimore, MD, USA).
2.C. Phantom package
Figure 2 shows the schematic of the phantom package placed under a patient (axial view). The phantom package contains a perfusion phantom comprised of three components [each component is the one shown in Fig. 1(a)] and a static phantom comprised of six components with different gadoteridol concentrations (0~5 mM). Both phantoms were surrounded by thermal insulation material (polyurethane foam) to prevent heat transfer from the human subject. The overall size of the phantom package was 35 × 250 × 240 mm (height × width × length). A fiberglass cushion covered by plastic wrap and cotton fabric was placed on top of the phantom package for patient comfort and additional thermal insulation. The total thickness combining the phantom package and the fiberglass cushion was about 50 mm.
Figure 2.
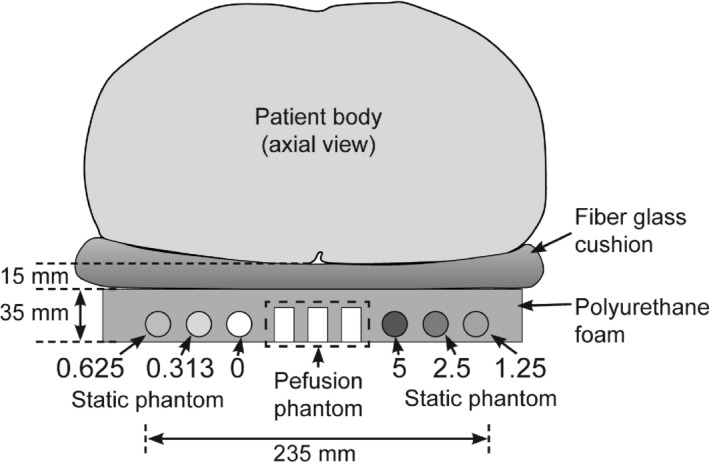
Phantom package for clinical use. (a) The schematic of phantom package containing a perfusion phantom comprised of three components and a static phantom comprised of six components; static phantom components contain different contrast concentrations (0~5 mM). Both phantoms were surrounded by thermal insulation material (polyurethane foam). A fiberglass cushion was placed on the top of the phantom package to provide patient comfort and to prevent heat transfer from the patient additionally. The combined thickness of the fiberglass cushion and polyurethane foam was about 50 mm.
2.D. Human subjects
Three healthy human volunteers were recruited. The first volunteer (Volunteer 1) was a 33 year‐old woman (155 cm; 64 kg), the second volunteer (Volunteer 2) was a 34 year‐old man (180 cm; 82 kg), and the third volunteer (Volunteer 3) was a 41 year‐old man (192 cm; 101 kg). All volunteers were Caucasian. Each volunteer was imaged together with the phantom package in two research‐dedicated clinical 3T MR scanners, a GE Signa (GE Healthcare; Atlanta, GA, USA) and a SIEMENS MAGNETOM Prisma (SIEMENS Heathineers; Malvern, PA, USA), within a one‐week period. The GE and SIEMENS scanners are referred to Scanner‐A and Scanner‐B, respectively, in this manuscript. We assumed that the perfusion parameters of human tissues did not change over a week.
2.E. Clinical MRI protocol
Each participant was instructed to lie on the fiberglass cushion as shown in Fig. 2, and a torso phased array coil was placed around his/her abdomen. The MR scanner room temperature was regulated to 17 ± 1°C. We placed the phantom inside the MRI room ≥ 30 min before starting imaging to ensure temperature equilibrium. Difference of water temperature inside the phantom before and after imaging was less than 1°C. All images were obtained in axial planes. Prior to imaging, RF shimming and flip angle (FA) mapping were conducted using vendor's software (Scanner‐A: Bloch‐Siegert method;26 Scanner‐B: Preconditioning RF pulse based rapid FA mapping27), while the human subjects were holding breath in end exhalation. Figure 3 shows the normalized FA maps of a volunteer (Volunteer 2 at the same position) and phantoms obtained from the two scanners, when the normalized FA is the ratio of the measured FA to the original FA set by the operator. Of note, FA values of static phantom were highly T1 dependent in Scanner‐B, but not in Scanner‐A. In Scanner‐A, DCE‐MRI utilized a 3D fast spoiled gradient echo sequence (FSPGR) with the following parameters: TR/TE = 3.8/2.1 ms, FOV = 400 × 360 mm, NEX = 1, thickness/gap = 5/0 mm, frequency/phase encoding = 192/173, matrix size = 256 × 230, SENSE factor = 2, slice number = 12, flip angle = 15°, and temporal resolution = 2.91 s. In Scanner‐B, DCE‐MRI utilized a 3D fast spoiled gradient echo sequence (VIBE) with the following parameters: TR/TE = 4.9/2.5 ms, FOV = 400 × 320 mm, NEX = 1, thickness/gap = 5/0 mm, frequency/phase encoding = 192/156, matrix size = 384 × 312, flip angle = 15°, SENSE factor = 2, slice number = 10, and temporal resolution = 2.34 s. The DCE‐MRI acquisition was carried out for 9 min. Gadoteridol (0.1 mmol/kg) was injected i.v., 30 s after imaging initiation and was followed by 20‐ml saline flush at a constant rate of 2 ml/s. All three perfusion‐phantom components were infused with 100 mM gadoteridol 15 s after imaging initiation.
Figure 3.
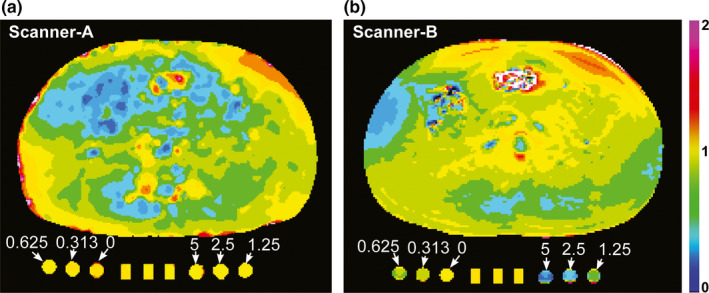
Normalized flip angle (FA) maps. (a, b) Normalized FA maps of a volunteer (Volunteer 2) and the phantom package containing a perfusion phantom comprised of three components at the center and a static phantom comprised of six components with varying contrast concentrations (0~5 mM), when (a) Scanner‐A or (b) Scanner‐B were used. Normalized FA is the ratio of the measured FA to the original FA set by the operator.
Prior to DCE‐MRI, T1 weighted images with various flip angles (2°, 5°, and 10°) were obtained for T1 mapping with the same imaging sequences and parameters.28 Volunteers were instructed to breathhold at end expiration during various flip angle (VFA) T1 weighted imaging, but DCE‐MRI was conducted in a free‐breathing mode.
2.F. Image processing
Figure 4 shows the schematic of image processing employed for retrieving pharmacokinetic parameter maps in this study. First, the local variation in flip angle (FA) was assessed by FA mapping as described above. Second, DCE‐MRI images of the volunteers were co‐registered using the expiration‐phase B‐spline method (ExBSpline).5 Third, T1 maps were obtained using the VFA approach.28 Fourth, contrast maps, voxel‐based contrast concentration at each time point, were obtained using the method described in our previous study.29 During T1 and contrast mapping, the FA variation over the field of view was corrected using FA maps. FA variation on static phantom could not be corrected in Scanner‐B, because FA on static phantom with high contrast concentration could not be accurately measured [see Fig. 3(b)]. Fifth, look‐up tables correlating the reference contrast concentrations with the measured ones were created (see the “look‐up table” section for details). Sixth, the arterial input function (AIF) was determined (see “Appendix A” in the supplemental material). Seventh, the contrast maps obtained in step 4 were corrected using the look‐up tables. Eighth, the pharmacokinetic (PK) parameter maps were created using the contrast maps corrected in step 7 and AIF.
Figure 4.

Schematic of image processing employed for pharmacokinetic parameter mapping in this study. First, flip angle (FA) maps were obtained. Second, DCE‐MRI images were co‐registered. Third, T1 maps were obtained. Fourth, contrast maps, voxel‐based contrast concentration at each time point, were obtained. Fifth, look‐up tables to correlate the reference (known) contrast concentrations with the measured ones were obtained. Sixth, arterial input function (AIF) was obtained. Seventh, contrast maps obtained in step 4 were corrected using the look‐up tables. Eighth, pharmacokinetic parameter maps were obtained.
Contrast concentrations were calculated using equation,
| (1) |
where r 1 is longitudinal relaxivity of gadoteridol, M 0 is the original magnetization, T 1(0) is pre‐contrast T1 value, TR is repetition time, θ is a flip angle, and S is the MRI signal.29 The r 1 of gadoteridol in deionized water in perfusion phantom was estimated to 2.8 s−1 mM−1, while that in human tissues was estimated to 3.7 s−1 mM−1.30 The r 1 of gadoteridol in the static phantom was measured to be 6.44 s−1 mM−1 using equation, r 1 = (1/T 1 ‐1/T 1(0))/C r , where T 1 and T 1(0) are T1 values of the static phantom with and without gadoteridol, respectively, and C r is the reference (known) contrast concentration of the static phantom. The higher r 1 value in static phantom might be caused by adding gelatin.
Pharmacokinetic parameters were retrieved using extended Tofts model,
| (2) |
where C t (t) is tissue contrast concentration at time t, v p is fractional blood plasma volume, C p (t) is the contrast concentration in blood plasma at time t, v e is fractional extravascular extracellular volume, and K trans is volume transfer constant.31 C p (t) is the plasma input function, which is the arterial input function divided by the ratio of blood plasma volume to whole blood volume; this ratio was assumed to be 0.55 regardless of gender in this study.32 An in‐house software package created in Labview (National Instruments Co., Austin, TX, USA) was used for image processing and perfusion parameter quantitation. This software package was validated using the digital reference objects provided by Dr. Daniel Barboriak at Duke University (Durham, NC, USA) and Quantitative Imaging Biomarker Alliance (QIBA).33
2.G. Look‐up table
Look‐up tables were created using either static or perfusion phantom. The contrast concentration of static phantom was measured using MRI and then correlated with its known contrast concentration. When the perfusion phantom was used, the reference contrast enhancement curve measured by LC‐MS was correlated with the average of three contrast enhancement curves (CECs) measured from three perfusion‐phantom components. The best fitting non‐linear curve, m = α(1‐exp(−βr)), was found for each look‐up table, where m is the measured contrast concentration, r is the reference contrast concentration, and α and β are constants. This fitting curve equation was empirically chosen. The curve is saturated at α, and its curvature is determined by β. As the curve goes linear, α will increase, while β will decrease. “Appendix B” in the supplemental material shows the detailed steps of tissue contrast concentration correction using a perfusion phantom look‐up table.
2.H. Statistical analysis
The intra‐class correlation coefficient (ICC) was used to measure the data resemblance between Scanner‐A and Scanner‐B.34 The repeatability coefficient among the three CECs of three perfusion‐phantom components was calculated at each image acquisition, assuming that the three perfusion‐phantom components are identical.35 All data are presented as means ± standard deviation (SD). All analyses were performed with SAS, version 9.4 (SAS Institute Inc., Cary, NC, USA).
3. Results
Figure 5(a) shows representative MRI images (axial view) of the perfusion phantom before (baseline) and at 0, 1, 2, 4, and 8 min after infusion of gadoteridol (100 mM) in a 9.4T small‐animal MR scanner. In the baseline image, the location of the semi‐permeable membrane is indicated with a dotted horizontal line, and the region of interest (ROI) in the bottom chamber is indicated with a solid rectangle. Gadoteridol started diffusing to the bottom chamber approximately 1 min after infusion. Chemical shift was observed at the top chamber after gadoteridol infusion, and its magnitude gradually decreased over time. The focal region of contrast enhancement at 1 min after infusion illustrates that mixing between gadoteridol and water requires 2~3 min. Also, at t = 1 min, the contrast flux across the membrane is not uniform, but the system approaches steady state transport conditions over time, which is shown in Fig. 5(a). Figure 5(b) shows the contrast enhancement curve (CEC) measured using LC‐MS (mean ± SD; n = 3). The contrast concentration linearly increased over time (0.11 mM/min), and was used as the reference CEC of the perfusion phantom in this study.
Figure 5.
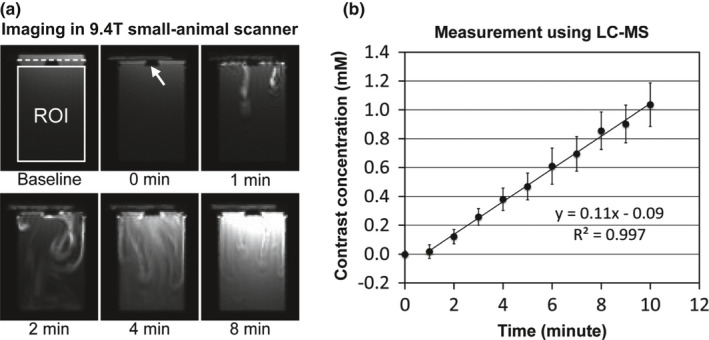
Perfusion phantom characterization. (a) Representative DCE‐MRI images of the phantom in a 9.4T small‐animal MR scanner before (baseline) and at 0, 1, 2, 4, and 8 minutes after contrast (gadoteridol; 100 mM) infusion. In the baseline image, the region of interest (ROI) is indicated with a white rectangle, and the location of the semi‐permeable membrane is indicated with a dotted line. The insert is indicated with a white arrow. (b) Reference contrast enhancement curve (CEC) of the perfusion phantom retrieved using LC‐MS (mean ± SD; n = 3).
Figure 6(a) shows the representative DCE‐MRI images of the phantom package located under a volunteer (Volunteer 2) before (baseline) and at 2 and 9 min after contrast infusion. Three perfusion‐phantom components are indicated with white dotted rectangles. To present both human and phantom images in high contrast, two different gray scales were used (0~600 for human images; 0~4000 for phantom images). Figure 6(b) shows the contrast maps in the ROIs of three perfusion‐phantom components (P1, P2, and P3) at 3, 6, and 9 min after contrast infusion when the same gray scale (0~1 mM) was applied. Figure 6(c) shows three CECs of the three perfusion‐phantom components and the mean CEC. The repeatability coefficient of the three CECs was 0.998. The repeatability coefficient of three CECs of three perfusion‐phantom components was higher than 0.997 in all measurements.
Figure 6.
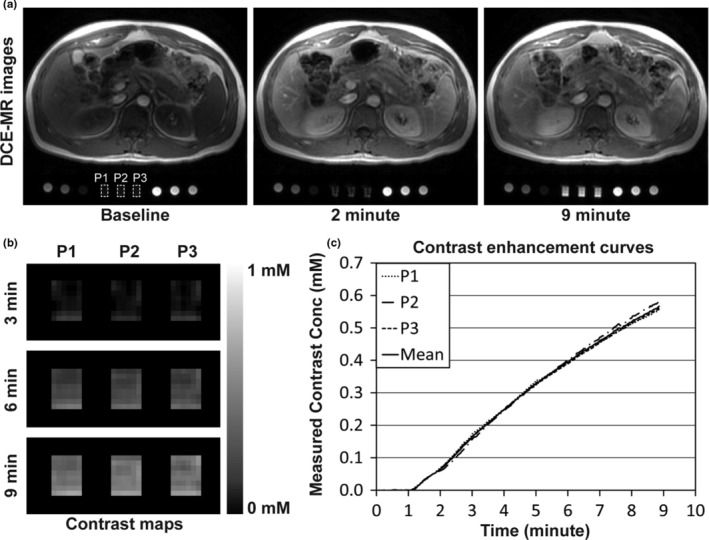
Imaging phantoms with a human subject. (a) DCE‐MRI images of phantoms and a healthy human volunteer at a 3T MR scanner (Scanner‐A) before (baseline) and at 2 and 9 min after contrast injection. The human subject was injected with gadoteridol (0.1 mmol/kg) and flushed with 20 ml of saline at a constant rate of 2 ml/s, and all three perfusion‐phantom components (indicated with white dotted rectangles) were infused with 100 mM of gadoteridol (60 μl/s). To present both human and phantom images in high contrast, two different gray scales were used (0~600 for human images; 0~4000 for phantom images). (b) Contrast maps of three perfusion‐phantom components (P1, P2, and P3) at 3, 6, and 9 min after contrast infusion in the region of interest, when the same gray scale was applied (0~1 mM). (c) Contrast enhancement curves (CEC) of three perfusion‐phantom components and the mean CEC.
Figure 7 shows the graphical representation of look‐up tables (LUTs). Each LUT was obtained from a single image slice of each volunteer showing all four organs (spleen, liver, pancreas, and paravertebral muscle). Figures 7(a) and 7(b) show the LUTs created using the static phantom (SP) in Scanner‐A and Scanner‐B, respectively, in the range of 0~5 mM. Three phantom measurements (M1~M3) were made with three volunteers (Volunteers 1~3), respectively (e.g., M1 was obtained with Volunteer 1). SP LUTs in the range of low contrast concentration (0~1 mM), indicated with dotted boxes, were inserted for comparison with perfusion phantom LUTs. Figures 7(c) and 7(d) show the LUTs created using the perfusion phantom (PP) in Scanner‐A and Scanner‐B, respectively. The LUTs of the perfusion phantom in Scanner‐A were non‐linear, whereas those in Scanner‐B were nearly linear. Of note, the LUTs of the perfusion phantom were substantially different from those of the static phantom in both scanners. Of interest, the contrast concentration of the perfusion phantom was underestimated during the early enhancement. The coefficient of determination (R2 value) of the curve fitting was higher than 0.99 in all LUTs.
Figure 7.
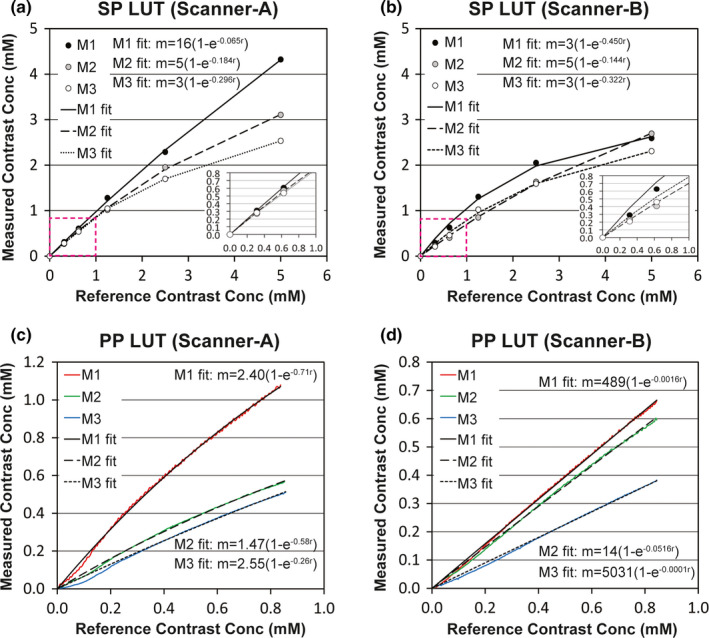
Graphical representation of look‐up tables (LUTs) obtained using either static phantom (SP) or perfusion phantom (PP). (a, b) LUTs to correlate the reference (known) contrast concentrations with the measured ones of static phantom in either (a) Scanner‐A or (b) Scanner‐B in the range of 0~5 mM. LUTs in the range of 0~1 mM, indicated with dotted boxes, were inserted. (c, d) LUTs to correlate the reference contrast enhancement curve of the perfusion phantom (0.11 mM per min) with the measured ones in either (c) Scanner‐A or (d) Scanner‐B. The equation of each fitting curve was inserted, and R2 value was higher than 0.99 in all fittings. [Color figure can be viewed at wileyonlinelibrary.com]
Figure 8(a) shows contrast maps of a volunteer (Volunteer 1) at 4.5 min after contrast infusion before and after correction using look‐up tables (LUTs) of the static phantom (SP) or perfusion phantom (PP), when Scanner‐A (the first row) or Scanner‐B (the second row) was used. The boundaries of spleen, liver, pancreas, and paravertebral muscle are shown with solid white lines in the sub‐figures of the first column. Before correction, tissue contrast concentration measured in Scanner‐A was 50% higher than that in Scanner‐B, and the difference became larger after correction with SP LUTs. However, the difference in concentration was reduced to 20% after correction with PP LUTs. Figures 8(b)–8(d) show the contrast concentrations (mM) averaged in each of the four organs in three volunteers (n = 12) at 4.5 min after contrast infusion, when Scanner‐A (Y‐axis) or Scanner‐B (X‐axis) was used. Intra‐class correlation coefficient (ICC) was 0.693 before correction [Fig. 8(b)], and it was lowered after correction with SP LUTs [Fig. 8(c); ICC = 0.617]. However, when PP LUTs were used, ICC was increased to 0.974 [Fig. 8(d)].
Figure 8.
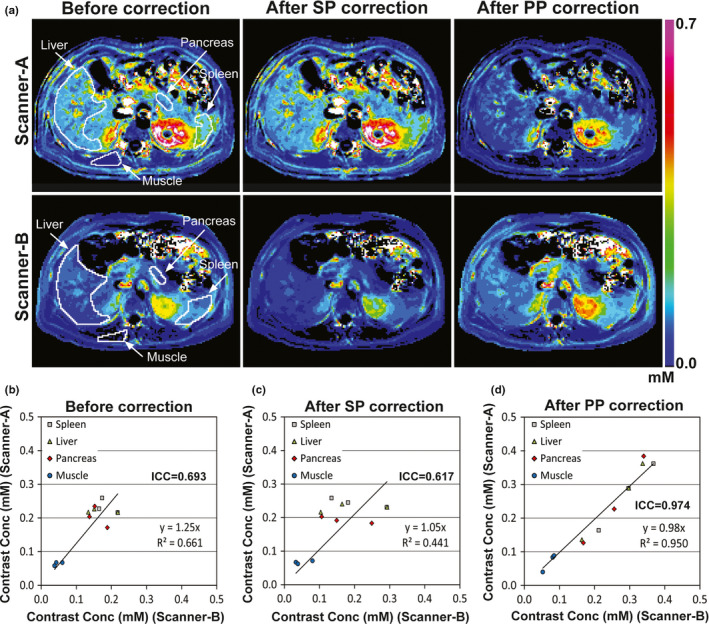
Contrast maps at 4.5 min after contrast injection before and after correction. (a) Contrast maps of a volunteer obtained from either Scanner‐A (first row) or Scanner‐B (second row) before and after correction using look‐up tables of static phantom (SP) or perfusion phantom (PP). The boundaries of four organ regions (liver, spleen, pancreas, muscle) are indicated with white solid lines in the first‐column images. The same color scale (0~0.7 mM) was applied for all sub‐figures. (b–d) Contrast concentrations (mM) averaged in each of the four organs of three volunteers (n = 12), when Scanner‐A (Y‐axis) or Scanner‐B (X‐axis) was used, (b) before and (c, d) after correction using look‐up tables of (c) static phantom or (d) perfusion phantom.
Figure 9(a) shows Ktrans maps of Volunteer 1 before and after correction, when Scanner‐A or Scanner‐B was used. Four organ regions (spleen, liver, pancreas, and paravertebral muscle) are indicated with white solid lines in the first‐column sub‐figures. The difference in Ktrans values of each organ was 20% before correction, and after static phantom correction was 30%. However, the Ktrans difference was reduced to less than 10% after perfusion phantom correction. Figures 9(b)–9(d) show the Ktrans values (min−1) averaged in each of the four organ regions in three volunteers, when Scanner‐A (Y‐axis) or Scanner‐B (X‐axis) was used. Before correction [Fig. 9(b)], ICC between the two data sets was 0.899, and it was not improved after SP correction (ICC = 0.866). However when PP LUTs were used, ICC became 0.996.
Figure 9.
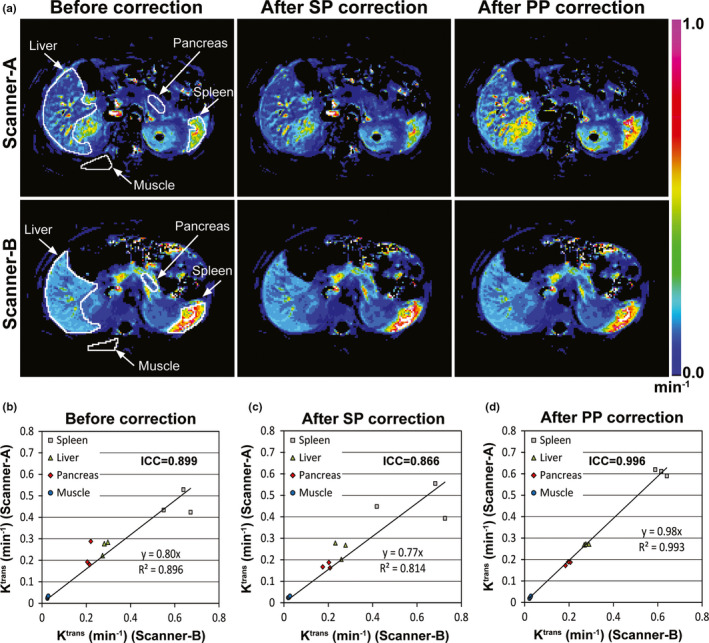
Ktrans maps before and after correction. (a) Ktrans maps of a volunteer obtained from Scanner‐A (first row) or Scanner‐B (second row) before and after correction using look‐up tables of static phantom (SP) and perfusion phantom (PP). The boundaries of four organ regions (liver, spleen, pancreas, muscle) are indicated with white solid lines in the first‐column images. The same color scale (0~1 min−1) was applied for all sub‐figures. (b–d) Ktrans values (min−1) averaged in each of the four organs of three volunteers (n = 12), when Scanner‐A (Y‐axis) or Scanner‐B (X‐axis) was used, (b) before or (c, d) after correction using look‐up tables of (c) static phantom or (d) perfusion phantom.
4. Discussion
We have demonstrated how to reduce the variability in quantitation of perfusion parameters measured in abdominal organs using a novel, portable, and ultimately disposable perfusion phantom. The contrast concentration of the perfusion phantom changed at a constant rate, serving as the reference for quantitating contrast concentrations in human tissues. We used three perfusion‐phantom components, which increased the measurement signal‐to‐noise ratio 73% (square root of 3) in comparison with the use of one. More importantly, the use of three perfusion‐phantom components allowed the detection of any functional error had one occurred. Gadoteridol infused to the top chamber induced a chemical shift, and its magnitude was proportional to the contrast concentration. Therefore, the systemic error caused by inaccurate contrast concentration can be detected. However, as only two MRI scanners were employed in this study, it could be questioned whether this approach would be valid in a larger scale. We showed that perfusion‐phantom based data correction would be achieved as long as the quantitation of contrast concentration is not location dependent within FOV of each image slice. Therefore, if B1 map can be reliably obtained, our approach is likely effective, although it will need to be verified in a larger investigation.
In this study, the relaxivity of gadoteridol in blood plasma at 3T was determined using data reported by Rohrer et al. (3.7 s−1 mM−1).30 However, Lin et al. reported about 35% larger value (5.0 s−1 mM−1),36 and Blockley et al. reported about 16% lower value (3.09 s−1 mM−1) than that by Rohrer et al.37 The relaxivity of a contrast agent is inversely proportional to the contrast concentration, thus the variation in relaxivity directly leads to error in quantitating contrast concentration. Nevertheless, the inaccuracy in relaxivity does not influence quantitating perfusion parameters when employing Toft's model or extended Toft's model, because the relaxivity value cancels out in those models.
Phantom temperature regulation is important, as temperature variation leads to T1 variation, and consequentially variation in quantitating contrast concentration. However, even if phantom temperature increases, it should not be a problem as long as phantom temperature does not change during DCE‐MRI which takes only 9 min. The contrast concentration is calculated by C(t)=(R(t)–R 0 )/r 1, where r 1 is the relaxivity of the contrast agent, R(t) is the relaxation rate of the phantom at time t, and R 0 is the relaxation rate of the phantom prior to contrast injection. Even if R 0 is change to R 0 +ΔR due to temperature increase, ΔR will be cancelled out if ΔR is constant during DCE‐MRI, because C(t)=((R(t)+ΔR)−(R 0 +ΔR))/r 1 =(R(t)–R 0)/r 1.
Look‐up tables (LUTs) of the static phantom were nonlinear and quite different to one another, although the FA variation was corrected in Scanner‐A. The nonlinearity could be induced by T2* effect. If T2* effect is consistent regardless of acquisition time and MR units, all LUTs should look the same. But, those were not, which implies that T2* effect varies over time and across MR units. Furthermore, the LUTs of perfusion phantom were very different from those of static phantom. Fundamental limitation of the static phantom approach is the fact that the contrast concentration in a static phantom is calculated using a pre‐contrast static phantom at a different location, which does not yield a true baseline value. The number of data points obtained from static phantom is lower than that from a perfusion phantom, which may be partly responsible for the difference. Thus, a static phantom may not serve as a reliable standard for dynamically changing tissue contrast concentration. To generalize this statement, however, static and perfusion phantom LUTs will need to be compared in a multi‐institutional trial.
The perfusion phantom LUTs obtained from Scanner‐A were non‐linear, while those from Scanner‐B were nearly linear. If the look‐up tables are linear, the perfusion parameters in extended Tofts model will not be altered; in Eq. (2), the perfusion parameters such as Ktrans, ve and vp will be consistent even if both C p (t) and C t (t) are simultaneously changed by a scaling factor. In fact, the difference between the tissue Ktrans values before and after correction using perfusion phantom LUTs was modest in Scanner‐B (< 10%). However, if a nonlinear model like shutter speed model (SSM) is employed,38 the perfusion parameters will be changed regardless of the LUT linearity. IAUC (integrated area under the contrast enhancement curve), another commonly used perfusion parameter in DCE‐MRI, will also vary regardless of the LUT linearity.
Of interest, the contrast enhancement curve of the perfusion phantom was lower than the fitting curve for the first 2 min after contrast enhancement in all measurements. Contrast agent passing through the membrane is initially more concentrated, thus T2* effect becomes more evident, resulting in the underestimation of contrast concentration. In fact, the underestimation was not observed when 50 mM was used for infusion (data not shown). Therefore, a look‐up table may be more accurately determined if the first 2 min of contrast enhancement curve is excluded when applying the curve fitting.
The performance of perfusion phantom was characterized using LC‐MS. However, although two spinning magnetic bars were used, the contrast concentration in the bottom chamber may not be uniform leading to potential sampling error. In addition, the samples were collected manually, which may explain the 15% coefficient of variation at each sample value. The reference contrast enhancement curve (CEC) was estimated to a linear line (0.11 mM/min). Since the clinical DCE‐MRI continued for 9 min and the contrast enhancement occurred at about 1 min after infusion, the dynamic range of the reference CEC was about 0.88 mM (0.11 mM/min × 8 min). The CECs of most abdominal tissues were within that range, except the aorta. The dynamic range of the arterial input function (AIF) is 6 mM on average.39 In this study, however, we used AIF only after the second peak, which was typically less than 1 mM (see “Appendix A” in the supplemental material), thus the dynamic range of the reference CEC (0.88 mM) would be acceptable.
One way to extend the dynamic range of the reference CEC is to use a different pore‐sized membrane in the perfusion phantom. The pore size of the semi‐permeable membrane was 12~14 kD in this study, which was 20~25 fold larger than gadoteridol (0.56 kD). Therefore, gadoteridol is transferred to the bottom chamber mainly by diffusion. If a membrane has a larger pore size, the diffusion efficiency may be increased. Alternatively, higher contrast concentration may be used for infusion, but the underestimation of contrast concentration during the early period of contrast enhancement may become more significant. The total acquisition time may be extended if specific absorption ratio (SAR) is not a concern.
One major concern regarding use of an external phantom is that the space inside the MRI bore for a human subject is reduced. The combined thickness of the phantom package and fiberglass cushion is 5 cm, and the typical bore size of a clinical MR scanner is 60 cm. This could be a concern for larger patients. A wide‐bore (70 cm) MRI scanner can be used for DCE‐MRI if necessary, as it has demonstrated comparable performance to a closed‐bore (60 cm) MR scanner for abdominal imaging.40 However, B1 field inhomogeneity may be increased in wide‐bore MRI scanners, so a reliable method of B1 mapping will need to be used. Eventually, the phantom package could be inserted within the MRI bed, but it would have to be included within the field of view and the surface coil.
5. Conclusions
We developed a novel portable perfusion phantom that reduced variability in quantitating perfusion parameters of human abdominal tissues across different MR units. The phantom is compact enough to be imaged with the human subject and large enough to not suffer from partial volume effect; thus MR system calibration can be implemented simultaneously with patient imaging. Since it is composed of inexpensive materials, the phantom can be constructed as a disposable device. It is simple to use, therefore, clinical MRI technologists should be able to operate it routinely. This phantom has the potential to facilitate multi‐institutional clinical trials employing quantitative DCE‐MRI to evaluate various abdominal malignancies and disease processes.
Conflicts of interest
The authors have no relevant conflicts of interest to disclose.
Supporting information
Figure A1: Arterial input function (AIF) determination. (a, b) Variation in population‐based AIF (pAIF) according to (a) cardiac output (CO) and (b) blood volume (BV) of individuals. (c–f) Process of retrieving AIF. (c) pAIF and a simulated mAIF. mAIF was simulated under three conditions of (a) both cardiac output and blood volume of the individual were 30% lower than the population means, (b) the AIF was 50% underestimated due to scanner error, and (c) the AIF had 25% of Gaussian noise. (d) 50% error of mAIF is corrected using a look‐up table. (e) The time of pAIF is scaled so that the time to reach the peak signal of pAIF is matched with that of mAIF as shown with a dotted vertical line. (f) The amplitude of the time‐scaled pAIF is scaled to fit into the amplitude of mAIF only after the second peak indicated with a dotted vertical line.
Figure B1: Contrast enhancement curves (CECs) measured from three perfusion phantoms (P1, P2, and P3) located at the center of phantom package.
Figure B2: Average of three CECs shown in Fig. B1.
Figure B3: The time‐shifted mean CEC.
Figure B4: The time axis of Fig. B3 is replaced with reference contrast concentration by multiplying 0.11 mM/min and time (minute).
Figure B5: Graphical representation of a look‐up table.
Figure B6: Conversion of the measured contrast concentration to the reference contrast concentration. A map of % difference between the measured and reference contrast concentration ((reference/measured) × 100%) is also inserted.
6. Acknowledgments
Financial support was provided by Research Initiative Pilot Award from the Department of Radiology at UAB and NIH grant 5P30CA013148. Authors thank Drs. Kurt R. Zinn, Janet F. Eary, and Wlad Sobol for study advice, Mr. Lael Gore and Ms. Heather Edmonds for MRI protocol development, and Ms. April Riddle for human subject recruitment and imaging assistance. Authors also thank Dr. Daniel Barboriak to provide the digital reference objects and Dr. Geoffrey Parker (University of Manchester) to provide the population‐based arterial input function. Finally, authors thank Dr. Yufeng Li who gave advice on statistical analyses.
References
- 1. Sung YS, Park B, Choi Y, et al. Dynamic contrast‐enhanced MRI for oncology drug development. J Magn Reson Imaging. 2016;44:251–264. [DOI] [PubMed] [Google Scholar]
- 2. Arevalo‐Perez J, Kebede AA, Peck KK, et al. Dynamic contrast‐enhanced MRI in low‐grade versus anapestic oligodendrogliomas. J Neuroimaging. 2016;26:366–371. [DOI] [PMC free article] [PubMed] [Google Scholar]
- 3. Wu J, Gong G, Cui Y, Li R. Intratumor partitioning and texture analysis of dynamic contrast‐enhanced (DCE)‐MRI identifies relevant tumor subregions to predict pathological response of breast cancer to neoadjuvant chemotherapy. J Magn Reson Imaging. 2016;44:1107–1115. [DOI] [PMC free article] [PubMed] [Google Scholar]
- 4. Berman RM, Brown AM, Chang SD, et al. DCE MRI of prostate cancer. Abdominal Radiology. 2016;41:844–853. [DOI] [PMC free article] [PubMed] [Google Scholar]
- 5. Li Z, Tielbeek JA, Caan MW, et al. Expiration‐phase template‐based motion correction of free‐breathing abdominal dynamic contrast enhanced MRI. IEEE Trans Bio‐Med Eng. 2015;62:1215–1225. [DOI] [PubMed] [Google Scholar]
- 6. Hamy V, Dikaios N, Punwani S, et al. Respiratory motion correction in dynamic MRI using robust data decomposition registration–Application to DCE‐MRI. Med Image Anal. 2014;18:301–313. [DOI] [PubMed] [Google Scholar]
- 7. Pilutti D, Buchert M, Hadjidemetriou S. Registration of abdominal tumor DCE‐MRI data based on deconvolution of joint statistics. Conf Proc IEEE Eng Med Biol Soc. 2013;2013:2611–2614. [DOI] [PubMed] [Google Scholar]
- 8. Huizinga W, Poot DH, Guyader JM, et al. PCA‐based groupwise image registration for quantitative MRI. Med Image Anal. 2016;29:65–78. [DOI] [PubMed] [Google Scholar]
- 9. Chen BB, Shih TT. DCE‐MRI in hepatocellular carcinoma‐clinical and therapeutic image biomarker. World J Gastroenterol. 2014;20:3125–3134. [DOI] [PMC free article] [PubMed] [Google Scholar]
- 10. Tong T, Sun Y, Gollub MJ, et al. Dynamic contrast‐enhanced MRI: use in predicting pathological complete response to neoadjuvant chemoradiation in locally advanced rectal cancer. J Magn Reson Imaging. 2015;42:673–680. [DOI] [PubMed] [Google Scholar]
- 11. Braunagel M, Radler E, Ingrisch M, et al. Dynamic contrast‐enhanced magnetic resonance imaging measurements in renal cell carcinoma: effect of region of interest size and positioning on interobserver and intraobserver variability. Investigative Radiol. 2015;50:57–66. [DOI] [PubMed] [Google Scholar]
- 12. Huang W, Li X, Chen Y, et al. Variations of dynamic contrast‐enhanced magnetic resonance imaging in evaluation of breast cancer therapy response: a multicenter data analysis challenge. Transl Oncol. 2014;7:153–166. [DOI] [PMC free article] [PubMed] [Google Scholar]
- 13. Heye T, Davenport MS, Horvath JJ, et al. Reproducibility of dynamic contrast‐enhanced MR imaging. Part I. Perfusion characteristics in the female pelvis by using multiple computer‐aided diagnosis perfusion analysis solutions. Radiology. 2013;266:801–811. [DOI] [PubMed] [Google Scholar]
- 14. Kudo K, Christensen S, Sasaki M, et al. Accuracy and reliability assessment of CT and MR perfusion analysis software using a digital phantom. Radiology. 2013;267:201–211. [DOI] [PMC free article] [PubMed] [Google Scholar]
- 15. Kim H, Arnoletti PJ, Christein J, et al. Pancreatic adenocarcinoma: a pilot study of quantitative perfusion and diffusion‐weighted breath‐hold magnetic resonance imaging. Abdom Imaging. 2014;39:744–752. [DOI] [PubMed] [Google Scholar]
- 16. O'Callaghan J, Wells J, Richardson S, et al. Is your system calibrated? MRI gradient system calibration for pre‐clinical, high‐resolution imaging. PLoS One. 2014;9:e96568. [DOI] [PMC free article] [PubMed] [Google Scholar]
- 17. Gonzalez Ballester MA, Gonzalez Ballester MA, Brady M. Estimation of the partial volume effect in MRI. Med Image Anal. 2002;6:389–405. [DOI] [PubMed] [Google Scholar]
- 18. Jackson EF, Gupta SN, Rosen MA, et al. QIBA DCE‐MRI technical committee update: phantom studies and first DCEMRI profile. Proceedings of the 96th Scientific Assembly and Annual Meeting of the Radiological Society of North America, Chicago, IL, USA, December 2010. 2010.
- 19. Cunningham CH, Pauly JM, Nayak KS. Saturated double‐angle method for rapid B1+ mapping. Magnetic Reson Med. 2006;55:1326–1333. [DOI] [PubMed] [Google Scholar]
- 20. Choi N, Lee J, Kim MO, Shin J, Kim DH. A modified multi‐echo AFI for simultaneous B1(+) magnitude and phase mapping. Magnetic Reson Imaging. 2014;32:314–320. [DOI] [PubMed] [Google Scholar]
- 21. Morrell GR. A phase‐sensitive method of flip angle mapping. Magnetic Reson Med. 2008;60:889–894. [DOI] [PubMed] [Google Scholar]
- 22. Jiru F, Klose U. Fast 3D radiofrequency field mapping using echo‐planar imaging. Magnetic Reson Med. 2006;56:1375–1379. [DOI] [PubMed] [Google Scholar]
- 23. Knight SP, Browne JE, Meaney JF, Smith DS, Fagan AJ. A novel anthropomorphic flow phantom for the quantitative evaluation of prostate DCE‐MRI acquisition techniques. Phys Med Biol. 2016;61:7466–7483. [DOI] [PMC free article] [PubMed] [Google Scholar]
- 24. Freed M, de Zwart JA, Hariharan P, Myers MR, Badano A. Development and characterization of a dynamic lesion phantom for the quantitative evaluation of dynamic contrast‐enhanced MRI. Med Phys. 2011;38:5601–5611. [DOI] [PMC free article] [PubMed] [Google Scholar]
- 25. Jia J, Keiser M, Nassif A, Siegmund W, Oswald S. A LC‐MS/MS method to evaluate the hepatic uptake of the liver‐specific magnetic resonance imaging contrast agent gadoxetate (Gd‐EOB‐DTPA) in vitro and in humans. J Chromatogr B Analyt Technol Biomed Life Sci. 2012;891–892:20–26. [DOI] [PubMed] [Google Scholar]
- 26. Sacolick LI, Wiesinger F, Hancu I, Vogel MW. B1 mapping by Bloch‐Siegert shift. Magn Reson Med. 2010;63:1315–1322. [DOI] [PMC free article] [PubMed] [Google Scholar]
- 27. Chung S, Kim D, Breton E, Axel L. Rapid B1+ mapping using a preconditioning RF pulse with TurboFLASH readout. Magn Reson Med. 2010;64:439–446. [DOI] [PMC free article] [PubMed] [Google Scholar]
- 28. Liberman G, Louzoun Y. Ben Bashat D. T(1) mapping using variable flip angle SPGR data with flip angle correction. J Magn Reson Imaging. 2014;40:171–180. [DOI] [PubMed] [Google Scholar]
- 29. Kim H, Samuel S, Totenhagen JW, Warren M, Sellers JC, Buchsbaum DJ. Dynamic contrast enhanced magnetic resonance imaging of an orthotopic pancreatic cancer mouse model. J Vis Exp. 2015; 10.3791/52641(98). [DOI] [PMC free article] [PubMed] [Google Scholar]
- 30. Rohrer M, Bauer H, Mintorovitch J, Requardt M, Weinmann HJ. Comparison of magnetic properties of MRI contrast media solutions at different magnetic field strengths. Invest Radiol. 2005;40:715–724. [DOI] [PubMed] [Google Scholar]
- 31. Tofts PS. Modeling tracer kinetics in dynamic Gd‐DTPA MR imaging. J Magn Reson Imaging. 1997;7:91–101. [DOI] [PubMed] [Google Scholar]
- 32. Chaplin H Jr, Mollison PL, Vetter H. The body/venous hematocrit ratio: its constancy over a wide hematocrit range. J Clin Invest. 1953;32:1309–1316. [DOI] [PMC free article] [PubMed] [Google Scholar]
- 33. Barboriak DP. QIBA–Digital reference object for profile DCE‐MRI analysis software verification 2; 2015. https://scholars.duke.edu/display/gra211722.
- 34. Koo TK, Li MY. A guideline of selecting and reporting intraclass correlation coefficients for reliability research. J Chiropr Med. 2016;15:155–163. [DOI] [PMC free article] [PubMed] [Google Scholar]
- 35. Bartlett JW, Frost C. Reliability, repeatability and reproducibility: analysis of measurement errors in continuous variables. Ultrasound Obstet Gynecol. 2008;31:466–475. [DOI] [PubMed] [Google Scholar]
- 36. Lin C, Bernstein J, Houston SF. Measurements of T1 relaxation times at 3.0T: implications for clinical MRA. Proc Int Soc Magn Reson Med. 2001;9:1391. [Google Scholar]
- 37. Blockley NP, Jiang L, Gardener AG, Ludman CN, Francis ST, Gowland PA. Field strength dependence of R1 and R2* relaxivities of human whole blood to ProHance, Vasovist, and deoxyhemoglobin. Magn Reson Med. 2008;60:1313–1320. [DOI] [PubMed] [Google Scholar]
- 38. Li X, Huang W, Yankeelov TE, Tudorica A, Rooney WD, Springer CS Jr. Shutter‐speed analysis of contrast reagent bolus‐tracking data: preliminary observations in benign and malignant breast disease. Magn Reson Med. 2005;53:724–729. [DOI] [PubMed] [Google Scholar]
- 39. Parker GJ, Roberts C, Macdonald A, et al. Experimentally‐derived functional form for a population‐averaged high‐temporal‐resolution arterial input function for dynamic contrast‐enhanced MRI. Magn Reson Med. 2006;56:993–1000. [DOI] [PubMed] [Google Scholar]
- 40. Saito S, Tanaka K, Hashido T. Liver acquisition with volume acceleration flex on 70‐cm wide‐bore and 60‐cm conventional‐bore 3.0‐T MRI. Radiol Phys Technol. 2016;9:154–160. [DOI] [PubMed] [Google Scholar]
Associated Data
This section collects any data citations, data availability statements, or supplementary materials included in this article.
Supplementary Materials
Figure A1: Arterial input function (AIF) determination. (a, b) Variation in population‐based AIF (pAIF) according to (a) cardiac output (CO) and (b) blood volume (BV) of individuals. (c–f) Process of retrieving AIF. (c) pAIF and a simulated mAIF. mAIF was simulated under three conditions of (a) both cardiac output and blood volume of the individual were 30% lower than the population means, (b) the AIF was 50% underestimated due to scanner error, and (c) the AIF had 25% of Gaussian noise. (d) 50% error of mAIF is corrected using a look‐up table. (e) The time of pAIF is scaled so that the time to reach the peak signal of pAIF is matched with that of mAIF as shown with a dotted vertical line. (f) The amplitude of the time‐scaled pAIF is scaled to fit into the amplitude of mAIF only after the second peak indicated with a dotted vertical line.
Figure B1: Contrast enhancement curves (CECs) measured from three perfusion phantoms (P1, P2, and P3) located at the center of phantom package.
Figure B2: Average of three CECs shown in Fig. B1.
Figure B3: The time‐shifted mean CEC.
Figure B4: The time axis of Fig. B3 is replaced with reference contrast concentration by multiplying 0.11 mM/min and time (minute).
Figure B5: Graphical representation of a look‐up table.
Figure B6: Conversion of the measured contrast concentration to the reference contrast concentration. A map of % difference between the measured and reference contrast concentration ((reference/measured) × 100%) is also inserted.


