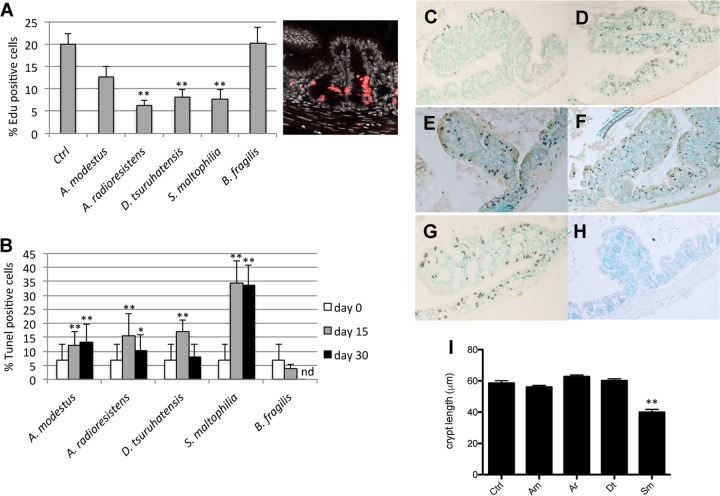
FIG 1 .
In vivo analysis of mice monoassociated with CSCM members. (A) Percentage of EdU+ cells in proximal colonic (PC) tissue from mice monocolonized with CSCM members or with B. fragilis on day 15 with a representative EdU staining of proximal colonic tissue from germfree mice as a control (Ctrl). (B) Percentage of apoptotic/dead cells in PC tissue from mice monocolonized with CSCM members on days 15 and 30 or monoassociated with B. fragilis on day 15. nd, not determined. (C to H) Representative pictures of apoptotic/dead cells of proximal colonic tissue from germfree mice (C) or from mice colonized for 15 days with A. modestus (D), A. radioresistens (E), D. tsuruhatensis (F), S. maltophilia (G), and B. fragilis (H). Magnification, 400×. (I) Proximal colonic crypt length of mice monocolonized with CSCM members A. modestus (Am), A. radioresistens (Ar), D. tsuruhatensis (Dt), and S. maltophilia (Sm). Data are expressed as means plus standard deviations (error bars). There were five mice in each group. Values that were significantly different from the value for the nonstimulated control group are indicated by asterisks as follows: *, P < 0.05; **, P < 0.01. Data from at least 50 crypts per section were examined for all histological parameters.

