

SUMMARY
Brain microvascular endothelial cells (BMECs) are an essential component of the blood-brain barrier (BBB) that shields the brain against toxins and immune cells. While BBB dysfunction exists in neurological disorders, including Huntington’s disease (HD), it is not known if BMECs themselves are functionally compromised to promote BBB dysfunction. Further, the underlying mechanisms of BBB dysfunction remain elusive given limitations with mouse models and post-mortem tissue to identify primary deficits. We undertook a transcriptome and functional analysis of human induced pluripotent stem cell (iPSC)-derived BMECs (iBMEC) from HD patients or unaffected controls. We demonstrate that HD iBMECs have intrinsic abnormalities in angiogenesis and barrier properties, as well as in signaling pathways governing these processes. Thus, our findings provide an iPSC-derived BBB model for a neurodegenerative disease and demonstrate autonomous neurovascular deficits that may underlie HD pathology with implications for therapeutics and drug delivery.
In Brief
Lim et al. show that HD iPSCs-derived brain microvascular endothelial cells have impaired angiogenic and barrier properties. Transcriptomic analysis provides mechanistic insights into pathways that underlie dysfunction, and WNT inhibition prevents angiogenic deficits. This system also suggests strategies to reduce disease burden and assess BBB penetration of drugs for HD.
INTRODUCTION
Huntington’s disease (HD) is a devastating neurodegenerative disorder caused by a CAG repeat expansion in the Huntingtin (HTT) gene (The Huntington’s Disease Collaborative Research Group, 1993) encoding an expanded polyglutamine (polyQ) track in the Huntingtin (HTT) protein. A broad range of cellular functions are impacted by mutant HTT (mHTT) expression (Munoz-Sanjuan and Bates, 2011; Ross and Tabrizi, 2011). Symptoms include progressive cognitive, psychiatric and motor impairment, and degeneration of striatal neurons and atrophy of cortical neurons are hallmark neuropathological features (Walker, 2007).
Impairment of the neurovascular unit (NVU) and blood-brain barrier (BBB) has emerged as a feature of various neurodegenerative diseases, including HD (Drouin-Ouellet et al., 2015; Hua et al., 2014; Lin et al., 2013). The NVU is composed of both neuronal and non-neuronal cells (astrocytes) that regulate central nervous system (CNS) homeostasis through interactions with blood vessels (brain microvascular endothelial cells, BMECs, pericytes). BMECs are the main component of the NVU that restricts paracellular and transcellular entry into the CNS via tight junctions (TJs), a limited number of caveolae, and selective transporters (Figure 1A) (Zhao et al., 2015). Chronic mHTT expression alters the neurovasculature by increasing cerebral blood volume, small vessel density, and BBB permeability in rodent models of HD and patient tissue (Drouin-Ouellet et al., 2015; Franciosi et al., 2012; Hsiao et al., 2015; Hua et al., 2014; Lin et al., 2013). These changes were initially thought to originate from neuronal deficits leading to secondary effects on the NVU; however, recent studies have highlighted a dependency on HD astrocytes for BBB pathology (Hsiao et al., 2015). Yet, it is not known whether BMECs manifest cell-autonomous deficits induced by mHTT expression, thereby potentially contributing to observed HD pathology, or if BBB dysfunction is secondary to neurodegeneration.
Figure 1. iBMECs from Healthy Control Patients Stain for BBB Markers, Show Functional Barrier Properties, and Provide Insight into Novel Regulators of BBB Genes.

(A) Diagram of the human BBB. Paracellular transport is prevented by TJs formed by CLAUDINS (CLDN; blue), OCCLUDIN (OCLN; red), and ZONA OCCLUDENS (ZO; purple oval). The low levels of transcytosis are controlled by a small number of caveolae expressing CAVEOLIN-1 (orange circles and light blue). Lastly, the transport and efflux of molecules are regulated by solute carriers, ATP-binding cassette genes, and other ion channels.
(B) Representative images for control iBMEC stained for PECAM-1 (CD31) (28Q), GLUT-1 (SLC2A1) (33Q), CLDN-5 (28Q), OCLN (33Q), and ZO-1 (33Q). The scale bars represent 100 μm.
(C) Flow cytometry quantification of % CD31+ (594) and GLUT1+ (488) double positive control and HD cells. The bar graph shows greater than 90% pure populations of iBMECs and no statistical difference between each sample using a one-way ANOVA [n = 3 (28Q), 5 (33Q), 7 (66Q), 5 (71Q), and 7 (109Q), independent experiments/differentiations with a minimum of two technical replicates). The dot plot is shown for 33Q and 66Q iBMECs unstained, FMO, and fully stained cells.
(D) Scatterplot of TEER values from control iBMECs (blue, 33Q and 28Q) and control iNPCs (red, 33Q) lines over 120 hr. The TEER values for the iBMECs are shown as average between two control iPSC lines (28Q and 33Q) and one iNPC control line over three individual readings taken from triplicate wells. There was no statistical difference in TEER values between two control iBMEC samples, but a significant difference was seen between two control iBMECs with the iNPCs [(n) = 14 (33Q BMEC), 16 (28Q BMEC), 3 (NPCs, adjusted p values = 1.94 × 10⁻⁴ (24 hr), 1.44 × 10⁻³ (48 hr), 2.74 × 10⁻⁴ (72 hr), and 9.37 × 10⁻³ (96 h), n.s. (120 hr) independent experiments/differentiations per sample; ANOVA with Bonferroni post hoc correction].
(E) List of uniquely expressed CLDNs found in RNA-seq data from control iBMECs.
(F) A Venn diagram of shared SLC- and ABC- transporters between control iBMECs data and previously published BMEC transcriptomic data.
(G) Selected results from motif analysis on all SLC- and ABC- transporter genes expressed in control iBMECs. p values represent the likelihood of finding the calculated enrichment of that motif in random sequences with similar GC content. See also Tables S1–S5. # (*p < 0.05; **p < 0.01; and ***p < 0.001).
For all of the error bars (mean ± SEM).
The development of iPSCs (Takahashi et al., 2007; Yu et al., 2007) and efficient protocols to generate BMECs (Lippmann et al., 2014) provide an opportunity to investigate the primary effects of neurodegenerative disease mutations on BMECs and their contribution to disease pathogenesis. To address whether BMECs have intrinsic deficits in HD, we generated human iPSC-derived BMECs (iBMECs) from either unaffected or HD subjects and performed functional assays and RNA-sequencing. Through transcriptome analysis, we identify a set of novel BMEC genes that could impact normal and diseased BBB function. This analysis, coupled with assays that measure angiogenesis and barrier function, suggest that HD iBMECs have increased angiogenic potential and impaired barrier function through defects in signaling pathways governing these processes. The transcriptome analysis suggests that mutant HTT protein regulates epigenetic marks that control changes in BMEC-specific gene expression, including those crucial for angiogenesis and barrier formation. Moreover, it suggests a potential mechanism that links mHTT with BBB dysfunction in HD, which is validated through a targeted intervention to ameliorate the angiogenic deficit. This HD iBMEC model represents an important resource to evaluate therapeutics that might restore normal BBB function and to assess drug delivery to the CNS.
RESULTS
Generation and Transcriptome Analysis of Unaffected Control Human iPSC-Derived BMECs
To define the transcriptome and functional characteristics of healthy iBMEC, iPSCs from unaffected individuals were differentiated into BMECs as described (Lippmann et al., 2014). There were two control iPSC lines from unaffected individuals having 33 or 28 CAG repeats in the HTT gene (CS83iCTR33n1, designated 33Qn1 [33Q] and CS14iCTR28n6, designated 28Qn6 [28Q]) that were differentiated (HD iPSC Consortium, 2017; Tables S1 and S2). Each line expressed markers of human BMECs including PECAM1 (CD31) and GLUT1 (SLC2A1) and formed linear TJ strands characterized by co-localization of CLAUDIN-5 (CLDN5), OCCLUDIN (OCLN), and TIGHT JUNCTION PROTEIN 1 (TJP1 [ZO1]) (Figure 1B). Flow cytometry analysis of the fraction of CD31+ and GLUT1+ double positive cells after differentiation and subculture showed that greater than 90% of the cell population were BMECs (Figure 1C). Functionally, iBMECs exhibited a high transendothelial electrical resistance (TEER) over several days, characteristic of normal BMECs (Figure 1D). TEER values peaked between 48 and 72 hr post-subculture, but remained higher than 300Ω×cm2 for over 120 hr (Figure 1D). In contrast, iPSC-derived neural precursor cells (iNPCs) from the same patient (33Q) showed no TEER over 120 hr (Figure 1D) (n = 3, 33Q-iNPC adjusted p values = 1.94 × 10⁻⁴ [24 hr], 1.44 × 10⁻³ [48 hr], 2.74 × 10⁻⁴ [72 hr], and 9.37 × 10⁻³ [96 hr], n.s. [120 hr], two-way ANOVA and Bonferroni post hoc correction].
iBMECs were analyzed for expression of BBB-specific genes by comparing their transcriptome (RNA-sequencing [seq]) to existing gene expression data collected from either primary human BMECs isolated by laser capture microdissection and purification or two immortalized BMEC lines (hCMEC/D3 and HBEC-5i) (datasets are listed in Table S3 and described in Huntley et al., 2014; Zhang et al., 2014). Due to difficulties in comparing RNA-seq and microarray data across studies (SEQC/MAQC-III Consortium, 2014), we focused on a binary approach by comparing whether a BBB-specific gene was present or absent.
The control iBMEC data were mined for genes essential for BBB function, including junctional, caveolar, and transporter proteins. CLDNs are the principal constituents of TJs that form a paracellular barrier. Although CLDN-3 and −5 are the main TJs, we found additional CLDN genes (e.g., CLDN-1, −4, −7, −11, −12, −18, −19, −20, and −23) expressed in our dataset. Some CLDN genes (e.g., CLDN-2, −6, −8, −9, −10, −15, and −16) and ZO-3 were uniquely expressed in iBMECs (Figure 1E), whereas OCLN and all three JAM proteins (F11R, JAM-2, and −3) were expressed in all datasets (Figure 1E). A second key constituent of the BBB is transporter proteins, including solute carrier transporters (SLC) and active efflux transporters. Profiling of 359 human SLC and 49 ATP-binding cassette (ABC) genes showed that 286 transporter-encoding genes were unique to human BMECs and 59 non-unique genes were expressed 2-fold higher in BMECs than cortex (Geier et al., 2013). Our RNA-seq data identified 173 genes that overlapped with 241 previously identified genes of the combined SLC and ABC families and revealed an additional 56 novel SLC and ABC genes (Figure 1F; Table S4). These findings (173 of the 241 transporter genes) showed a high statistical significance of overlap (p < of 0.000), validating the use of iBMECs as a model.
To identify potentially novel upstream transcription factors that regulate SLC and ABC genes, we used transcription factor motif analysis (Figure 1G; Table S5). THEME software was used to identify enriched upstream regions of every motif in the TRANSFAC and SELEX databases (Jolma et al., 2013; Wingender et al., 1996). The top motif identified the transcription factor NRF-1 (p = 6.75 × 10⁻¹²), that regulates not only mitochondrial biogenesis, but also HIF1α during hypoxia (Wang et al., 2016). The HIF-1 motif, where HIF-1α binds in hypoxic conditions to upregulate pro-angiogenic genes (Forsythe et al., 1996), was also highly enriched (Figure 1G). Finally, ELK-1 and STAT-3 DNA binding motifs were enriched suggesting that these transcription factors may function in cooperation with HIF-1α in iBMECs to promote angiogenesis (Chamorro-Jorganes et al., 2016; Cheranov et al., 2008). Thus, pro-angiogenic transcription factors function upstream of BBB-specific genes to coordinate angiogenesis and barrier maturation in iBMECs.
HD iBMECs Have Functional Deficits in Angiogenesis and Barrier Properties
We next differentiated HD patient-derived iPSCs into iBMECs as above to determine whether the presence of mHTT confers impairment in BMEC function. There were four human HD iPSC lines with expanded repeats of 60Q, 66Q, 71Q, and 109Q (CS21iHD60n8, CS04iHD66n4, CS81iHD71n3, and CS09iHD109n1; Seong et al., 2010), representative of early onset HD, that were differentiated into iBMECs (Lippmann et al., 2014). No statistically significant differences in the percentage of HD iBMECs (CD31+/GLUT1+ cells; >90% pure populations; Figure 1C) compared to control iBMECs were observed after differentiation. HTT protein levels were similar between control and highly expanded repeat lines (HD iPSC Consortium, 2012; Mattis et al., 2015).
We first performed a wound-healing assay to assess the angiogenic potential of iBMECs by measuring the distance that cells travel toward a wound area. HD iBMECs showed increased migration into the wound over a 6 hr time period compared to control lines (Figures 2A and 2B) [adjusted p value = (66Q 4.69 × 10⁻⁴), (71Q 9.02 × 10⁻³); one-way ANOVA and Bonferroni post hoc correction]. To determine whether this effect was due to either increased migration or altered proliferation, we quantified the number of proliferating iBMECs in both control and HD lines and migration across a Transwell system with increasing doses of VEGF in the bottom chamber. There was no significant difference in the number of proliferating iBMECs between any of the HD or control lines, but there was a marked increase in HD iBMEC migration in the Transwell migration assay (Figures 2C and 2D). Although each iBMEC line (control or HD) showed a dose-dependent response to VEGF, HD iBMECs had increased migration compared to control iBMECs even in the absence of VEGF (Figure 2C) [adjusted p value = (66Q 2.22 × 10⁻², 3.22 × 10⁻², and 7.15 × 10⁻³), (71Q 2.83 × 10⁻², 2.31 × 10⁻², and 3.21 × 10⁻²), and (109Q 9.06 × 10⁻³, 4.67 × 10⁻⁴, and 8.85 × 10⁻⁵; two-way ANOVA and Bonferroni post hoc correction]. There was no significant difference in the number of apoptotic or dead cells among any of the control or HD iBMECs with the exception of the highly expanded 109Q line, which has a higher susceptibility to cell death (Figures 2E and 2F) (adjusted p value = 109Q 1.99 × 10⁻² and 5.26 × 10⁻⁴, ANOVA and Bonferroni post hoc). These findings demonstrate that HD iBMECs have increased angiogenesis compared to control iBMECs.
Figure 2. HD iBMECs Show Increased Migration.

(A) Wound-healing assay shows HD iBMECs have increased migration into wound. The images are 0 and 6 hr time points. The scale bars represent 200 μm.
(B) Plot shows change in area over time [(n) = 4 (all lines) independent experiments/differentiations; adjusted p value = (66Q 4.69 × 10⁻⁴) and (71Q 9.02 × 10⁻³) with ANOVA and Bonferroni post hoc correction]. The lines used were 28Q, 33Q, 66Q, and 71Q.
(C) Transwell migration assay showing increased migration after 24 hr of HD compared to control iBMECs treated with 0, 50, or 100 ng/mL VEGF [(n = 3 (28Q), 3 (33Q), 3 (66Q), 2 (71Q), and 3 (109Q) independent experiment/differentiations with five images counted per growth replicate; adjusted p value = (66Q 2.22 × 10⁻², 3.22 × 10⁻², and 7.15 × 10⁻³), (71Q 2.83 × 10⁻², 2.31 × 10⁻², and 3.21 × 10⁻²), and (109Q 9.06 × 10⁻³, 4.67 × 10⁻⁴, and 8.85 × 10⁻⁵); two-way ANOVA and Bonferroni post hoc correction].
(D) Quantification of proliferating cells in HD and control iBMECs by % Ki67 positive shows no statistical difference (n = 3 independent experiments/differentiations with five images counted per two growth replicates each; one-way ANOVA).
(E and F) Quantification of relative number of dead (E) and apoptotic (F) cells in HD and control iBMECs by flow cytometry. Only 109Q HD iBMECs have a significant increase in the number of apoptotic and dead cells [(n = 10 (28Q), 8 (33Q), 11 (66Q), 9 (71Q), and 8 (109Q) independent experiment/differentiations comparing controls to each individual HD line (adjusted p value = 109Q 1.99 × 10⁻² and 5.26 × 10⁻⁴); one-way ANOVA and Bonferroni post hoc correction]. # (*p < 0.05; **p < 0.01; and ***p < 0.001).
For all of the error bars (mean ± SEM).
We next examined whether HD iBMECs displayed altered TJs and paracellular barrier function. iBMECs did not show any abnormalities in OCLN localization at cell junctions in control or HD lines (Figure 3A); however, CLDN5 was localized both at junctions and intracellularly in HD (66Q, 71Q, and 109Q), but not control (28Q and 33Q) iBMECs (Figure 3A) [p value = (7.76 × 10⁻³); Student’s t test]. Protein levels for either CLDN5 or OCLN were unchanged (Figure 3B; ANOVA with Dunnett’s multiple comparison test). To examine BBB function, TEER measurements were performed on HD and control iBMECs over 96 hr. There was a significant decrease in maximal TEER values in HD iBMECs at 72 hr compared to control lines particularly in those with expanded repeats above 70Qs (e.g., 71Q and 109Q) (Figure 3C) [adjusted p value = (60Q 4 × 10⁻²), (66Q 1 × 10⁻³), (71Q 1 × 10⁻⁶), and (109Q 1 × 10⁻⁹); ANOVA with Bonferroni post hoc correction]. Thus, some TJ proteins and paracellular barrier function are altered in HD iBMECs.
Figure 3. HD iBMECs Have Abnormal BBB Function.

(A) Representative immunofluorescence micrographs for CLDN5 (33Q and 109Q) and OCLN (33Q and 71Q) in control and HD iBMECs (red arrows mark larger puncta). The scale bars represent 10 μm. The bar graph shows relative CLDN5 intracellular puncta per cell. There is an increase in intracellular CLDN5 protein inside HD cells, [(33Q n = 6), (28Q n = 3), (66Q n = 3), (71Q n = 6), and (109Q n = 3); p value = 7.76 × 10⁻³, Student’s t test]. There were at least three images at 100× per experiment that were used.
(B) Western blots with bar graph quantitation of CLDN5 and OCLN levels with the LICOR system. The quantitation was normalized to β-ACTIN, and the bar graph values are shown relative to 28Q line. No difference between any lines was found (ANOVA and Dunnett’s multiple comparison test).
(C) A bar graph of TEER values for control (black) and HD (gray) lines at 72 hr post subculture. The TEER is decreased in all HD iBMECs. The resistance values from each triplicate measurement/well were averaged in each experiment containing three replicate wells per condition/sample [n and adjusted p value; (n) = 14 (33Q) and 16 (28Q), (60Q n = 20 and 4 × 10⁻²), (66Q n = 11 and 1 × 10⁻³), (71Q n = 8 and 1 × 10⁻⁶), and (109Q n = 16 and 1 × 10⁻⁹); ANOVA with Bonferroni correction].
(D) Histograms and bar graphs of the puromycin survival assay. The bar graph values are relative to untreated for each cell line (n = 3 independent experiments/differentiations with triplicate wells for each condition and five images per well were counted comparing controls to each individual HD line [adjusted p value (60Q 9 × 10⁻³ and 1.05 × 10⁻³) and (109Q 1 × 10⁻² and 1.08 × 10⁻²; ANOVA and Bonferroni post hoc correction].
(E) Flow cytometry quantification of Rhodamine 123 efflux/uptake in control and HD iBMECs. For the R123 uptake assay, controls were compared to each individual HD line and a positive control iNPC [n and adjusted p value; (n) = 8 (33Q) and 17 (28Q), (66Q n = 13 and 1.23 × 10⁻²), (71Q n = 5 and 4.5 × 10⁻⁴), (109Q n = 10 and 1.96 × 10⁻⁶), and (33Q-iNPCs n = 3 and 5.59 × 10⁻⁷); ANOVA and Bonferroni post hoc correction].
(F) Histograms shown for 33Q and 109Q and flow cytometry quantification of PGP protein levels showing an increase in HD iBMECs compared to controls [n and adjusted p value; (n) = 4 (33Q) and 8 (28Q), (66Q n = 6 and 4.59 × 10⁻⁵), (71Q n = 3 and 1.77 × 10⁻³), and (109Q n = 3 and 2.89 × 10⁻⁶); ANOVA and Bonferroni post hoc correction]. The histograms are shown for 28Q and 109Q.
(G) Flow cytometry quantification of CAV1 protein levels showing an increase in HD iBMECs [n and adjusted p value; (n) = 4 (33Q) and 11 (28Q), (66Q n = 8 and 4 × 10⁻³), (71Q n = 11 and 5 × 10⁻³), and (109Q n = 9 and 3 × 10⁻²); one-way ANOVA and Bonferroni post hoc correction]. The histograms are shown for 28Q and 66Q. There is reduced MDR1 function in HD iBMECs (R123) and less cell survival due to decreased efflux of puromycin.
(H) Histograms and bar graph of the albumin uptake assay show increased uptake of albumin-A594 in HD iBMECs and positive control 33Q iNPCs compared to control iBMECs [n and adjusted p values; (n) = 12 (33Q) and 17 (28Q), (66Q n = 13 and 3.04 × 10⁻³), (71Q n = 5 and 9.18 × 10⁻⁶), (109Q n = 10 and 1.01 × 10⁻⁸), and (33Q-iNPCs n = 3 and 1.59 × 10⁻⁹); by one-way ANOVA and Bonferroni post hoc]. The histogram is shown for 28Q and 109Q. # (*p < 0.05; **p < 0.01; and ***p < 0.001).
For all of the error bars (mean ± SEM). See also Figure S2.
A major function of the BBB is to prevent influx of harmful molecules into the brain (Zhao et al., 2015). Altered MDR1 (ABCB1 or P-GLYCOPROTEIN) transporter function has been reported in HD (Kao et al., 2015), prompting us to examine whether this transporter might be impaired in HD iBMECs. We performed a puromycin survival assay that relies on the ability of BMECs to extrude puromycin and survive via MDR1 for 48 hr (Perrière et al., 2005). HD iBMECs were unable to survive the antibiotic treatment, even at low levels of puromycin, compared to control lines (Figure 3D) [adjusted p value = (60Q 9 × 10⁻³ and 1.05 × 10⁻³) and (109Q 1 × 10⁻² and 1.08 × 10⁻²); two-way ANOVA with Bonferroni post hoc correction]. The poor survival rate correlated with increased polyQ length, suggesting that MDR1 has either low expression or aberrant function (Figure 3D). As an independent assay for MDR1 function, we used flow cytometry to quantify the uptake of Rhodamine 123 (R123), a dye transported by MDR1 (Miller et al., 1997). We also tested an iNPC line from the same 33Q iPSC, since these cells do not express the MDR1 gene and will take up the dye. An increase in R123 uptake was observed in all HD samples, and the 33Q iNPC cells, compared to control iBMECs (Figure 3E) [adjusted p value = (66Q 1.23 × 10⁻²), (71Q 4.5 × 10⁻⁴), (109Q 1.96 × 10⁻⁶), and (33Q-iNPC 5.58 × 10⁻⁷); one-way ANOVA with Bonferroni post hoc correction], verifying that efflux function is reduced in HD iBMECs. Additionally, treatment with the MDR1 inhibitor Cyclosporine A for 1 hr prior to R123 exposure, inhibited the ability of both control and HD iBMECs to efflux R123 (Figure S2). We quantified MDR1 protein levels by flow cytometry to determine if it was reduced, but surprisingly we found increased MDR1 levels in all HD lines (Figure 3F) [adjusted p value: 33Q (n = 4) and 28Q (n = 8), 66Q (n = 6 and 4.59 × 10⁻⁵), 71Q (n = 3 and 1.77 × 10⁻³), and 109Q (n = 3 and 2.89 × 10⁻⁶); one-way ANOVA and Bonferroni post hoc correction]. These findings demonstrate altered MDR1 function in iBMECs carrying mHTT.
Endothelial Transcytosis Is Impaired in HD iBMECs
mHTT aggregates are primarily concentrated in endocytotic vesicles within CNS blood vessels of HD mice and patients (Drouin-Ouellet et al., 2015). Increased fluorescently labeled albumin, which enters the CNS by CAVEOLIN-1-mediated transcytosis, is also found within the CNS of R6/2 mice after intravenous injection (Drouin-Ouellet et al., 2015). We examined endothelial endocytosis in control or HD iBMECs and 33Q iNPCs by measuring the amount of fluorescently labeled albumin inside cells after a 1 hr treatment by flow cytometry. Each HD iBMEC line and the iNPCs had increased albumin uptake compared to control iBMECs (Figure 3G) [adjusted p value = (66Q 3.04 × 10⁻³), (71Q 9.18 × 10⁻⁶), (109Q 1.01 × 10⁻⁸), and (33Q-iNPC 1.59 × 10⁻⁹); ANOVA with Bonferroni post hoc correction], suggesting a higher rate of endocytosis. CAV-1 was also expressed at higher levels in HD iBMECs compared to controls by flow cytometry (Figure 3H) [adjusted p value = (66Q 4 × 10⁻³), (71Q 5 × 10⁻³), (109Q 3 × 10⁻²); one-way ANOVA with Bonferroni post hoc correction], suggesting an impaired transcytotic barrier in HD iBMECs.
The Transcriptome of HD iBMECs Reveals Altered Angiogenic and Barrier Gene Networks
The data above suggest that there are intrinsic deficits arising in mHTT-expressing iBMECs. To determine whether mHTT impacts BMEC gene expression leading to functional deficits, RNA-seq was carried out on the HD iBMEC lines. Unsupervised exploratory analysis (PCA) was used to examine differences between HD and control cells (Figure 4A). Although the highest variance is seen across all patient samples in principle component (PC) #1, there is clear separation between control and HD samples across PC #2. A list of differentially expressed genes (DEGs) between control and HD iBMECs was generated using DEseq2 and Partek Flow (Table S6). We then used the tissue specific expression analysis (TSEA) tool (Xu et al., 2014) to explore tissue specificity, which revealed that DEGs were mainly comprised of genes expressed in blood vessels (FDR = 1.048 × 10⁻²¹ and 8.268 × 10⁻⁹, Fisher’s exact test with Benjamini-Hochberg correction) (Figure S1A).
Figure 4. Exploratory, Pathway, and Motif Analysis of Transcriptomic Data from Control and HD iBMECs Reveals mHTT Dysregulation of BBB Genes and Related Pathways.

(A) PCA of log2 normalized count data on global expression demonstrates grouping within individual control or HD samples and separation between both groups along PC#2.
(B) Hierarchical clustering of DEGs in signaling pathways regulating BBB function using log2 normalized count data. The heatmap shows expression values normalized to row min (blue) and max (orange), with genes grouped by pathways indicated by the color bar. The FDR and fold change are displayed for each gene.
(C) IPA upstream regulator analysis showing transcriptional regulators predicted to be activated by calculation of activation Z scores. The p value was calculated by Fisher’s exact test from expected and observed genes overlapping with our DEG list and all genes regulated by each transcription factor.
(D) Scatterplots of log2 normalized count data for NOTCH3, TCF3, GLI2, and SMAD3, plotted by increasing CAG length, with best fit line and R2 values displayed.
See also Tables S6 and S7.
To identify specific pathways and regulators that control neurovascular function in HD, Ingenuity Pathway Analysis (IPA) was conducted on the DEGs. WNT/β-catenin, pro-angiogenic, and leukocyte extravasation signaling, as well as cell junction or caveolar-mediated transcytosis proteins, essential for BMEC barrier function, were altered (Figure 4B). To determine changes in transcription factor activity that might contribute to altered gene expression and pathway activity, upstream regulator analysis (IPA) and motif analysis were performed on HD iBMECs. WNT (WNT3A), SHH (GLI2), Angiopoietin/Tie2 (ANGPT2), and TGFβ1 signaling were predicted to be activated (Figure 4C). Motif analysis on DEGs either expressed only, or upregulated, in HD iBMECs, revealed that many DEGs were regulated by either HIF-1α or ELK-1 (Table S7). This analysis supports the pro-angiogenesis phenotype of HD iBMECs (Figures 2A–2C). To determine if there is any correlation between the length of the CAG-repeat with the predicted activation of the above pathways/regulators, we plotted the log2 normalized read count data for each gene (downstream targets or critical pathway members) and found a high correlation between CAG length and DEGs expression/activation (Figure 4D).
To further uncover potential mechanisms contributing to transcriptional dysregulation in HD iBMECs, we conducted GO analysis, using Cytoscape (Shannon et al., 2003) and EnrichR (Kuleshov et al., 2016). Biological process enrichment revealed that genes promoting vascular sprouting and remodeling were altered in HD iBMECs (Figures 5A and 5B). The majority of DEGs in the HD iBMECs correspond to either cell adhesion proteins, signaling receptors, or endothelial barrier regulators (Figures S1B and S1C). Within the parent category of signaling, components of the WNT/β-catenin pathway that regulate CNS angiogenesis and BBB maturation (Zhao et al., 2015) were upregulated in HD iBMECs including ligands (WNT-3, −4, −6, −7B, and −10A), effectors (TCF3 and TCF4), and downstream targets (AXIN2 and APDCC1) (Figures 4B and 5B). Other pro-angiogenic genes, such as NOTCH-3, −4, αV-INTEGRIN, and SMAD3 (Mancuso et al., 2008), were also upregulated (Figures 4B and 5B). Surprisingly, ROBO-1 and −2 that downregulate VEGFR2 at the beginning of EC differentiation (Mancuso et al., 2008) were upregulated (Figures 4B and 5B). Collectively, these data indicate that HD iBMECs are starting to mature by expressing the correct gene sets required for maturation (e.g., ROBO-1 and 2); however, there is a delay compared to their control counterparts.
Figure 5. HD iBMECs and Patient Tissue Show Enrichment for Angiogenesis, WNT, and PRC2 Signaling and Histone Methylation.

(A) Network mapping of BiNGO biological process analysis showing enrichment for genes that regulate WNT signaling, angiogenesis, and vascular development. Node size = number of genes and node color = decreasing FDR blue to purple. All enrichment nodes have an adjusted p value < 0.05. Adjusted p values were calculated based on overrepresentation of categories over a background sample using a hypergeometric test and adjusted using a Benjamini-Hochberg FDR.
(B) Gene network showing differentially expressed genes that are involved in angiogenesis and have a direct protein-protein interaction connection (edges). The orange denotes genes upregulated and blue downregulated in HD.
(C) Combined ChEA and ENCODE analysis to determine transcription factors that regulate the DEGs. Adjusted p value by Fisher’s exact test and Benjamini-Hochberg correction log (adjusted p value).
(D) Enrichment analysis of ENCODE histone modifications relevant to DEGs. Adjusted p value by Fisher’s exact test and Benjamini-Hochberg correction.
(E) PRC2 genes/effectors and histone methyltransferases that are dysregulated in HD iBMECs.
(F) Western blotting in human HD cortical tissue for the WNT/β-catenin transcriptional target SOX17. SOX17 is 2.5-fold higher in HD patient samples (p < 0.01, Student’s t test).
(G) Immunohistochemistry for SOX17 in control or HD human cortex. The SOX17 (brown) is expressed in blood vessels (hematoxylin, blue). The scale bars represent 20 μm. See also Table S8 and Figure S1. # (*p < 0.05; **p < 0.01; and ***p < 0.001).
For all of the error bars (mean ± SEM).
EnrichR analysis was used to identify possible epigenomic modifications associated with altered gene expression in HD iBMECs. SUZ12, a member of the polycomb repressive complex 2 (PRC2), had the highest adjusted p value of all transcription factors, suggesting a role for this complex in silencing endothelial genes in HD iBMECs (Figure 5C) similar to neuronal genes in HD neurons (Seong et al., 2010). This analysis also implicates WNT signaling (TCF3), suggesting that the TCF3/β-CATENIN complex may cooperate with PRC2 to dysregulate HD iBMEC genes (Figure 5C). Consistent with the above findings, ENCODE genome-wide histone modification analysis identified H3K27me3 and H3K4me3 as marks present at regulatory sites on DEGs altered in HD iBMECs (Figure 5D). Since several genes of the PRC2 complex and effectors of histone methylation are downregulated in both HD iBMECs (Figure 5E) and neurons, mHTT may promote dysfunction of multiple cell types at the epigenomic level.
WNT/β-Catenin Pathway Is Activated in Human HD Brain Tissue and Its Inhibition Rescues Angiogenic Deficit In Vitro
To validate some of the transcriptome findings from HD iBMECs in human patient tissue, we performed immunohistochemistry and western blotting on human cortical tissue obtained at autopsy from patients with early-grade HD and age-matched non-neurological disease controls (New York Brain Bank; Table S8). Since WNT signaling is activated in HD iBMECs (Figures 4B, 5B, and 5C), we examined expression levels of SOX17, a transcriptional target of WNT/β-catenin signaling in both mouse and human BMECs (Lengfeld et al., 2017). SOX17 was expressed in blood vessels in HD cortex and was 2.5-fold higher in HD brain compared to unaffected tissue (p < 0.01, two-way Student’s t test) (Figures 5F and 5G).
To test whether our transcriptome analysis can identify underlying mechanisms contributing to altered iBMEC function, we performed the wound healing assay in the presence of a small molecule WNT inhibitor, XAV939. Treatment of 33Q iBMECs with 20 μM XAV939 had no effect on their ability to migrate; however, XAV939 significantly reduced the migration of each HD iBMEC line compared to vehicle treated cells, comparable to the control 33Q line [adjusted p value = (33Qv66Q 4 × 10⁻²), (33Qv71Q 2 × 10⁻⁶), (33Qv109Q 5 × 10⁻⁵), (66Qv66Q-XAV 5 × 10⁻³), (71Qv71Q-XAV 1 × 10⁻⁴), and (109Qv109Q-XAV 2 × 10⁻³); two-way ANOVA with Bonferroni post hoc correction] (Figure 6A). These data demonstrate that inhibition of aberrant WNT signaling in HD iBMECs rescues some of the angiogenic defects and provides validation that aberrant WNT signaling contributes to intrinsic deficits of HD iBMECs. Thus, the transcriptome data provide predictive information about underlying pathogenic mechanisms that cause intrinsic functional deficits in BMECs and potential targets for therapeutic intervention in HD.
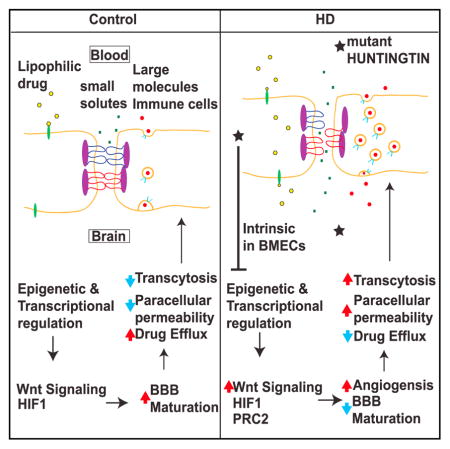
Figure 6. WNT Inhibition Restores Angiogenic Deficits in HD iBMECs and Model of NVU Impairment in HD.

(A) Wound-healing assay shows HD iBMECs treated with 20 μM XAV939 have decreased migration into the wound. The plot shows change in area overtime. [(n) = 3 (all lines) independent experiments/differentiations and adjusted p value; (33Qv66Q 4.43 × 10⁻²), (33Qv71Q 2.27 × 10⁻⁶), (33Qv109Q 5.31 × 10⁻⁵), (66Qv66Q-XAV 5.70 × 10⁻³), (71Qv71Q-XAV 1.34 × 10⁻⁴), and (109Qv109Q-XAV 2.96 × 10⁻³); two-way ANOVA and bonferroni post hoc].
(B) Model of EC barrier dysfunction in HD. Schematic diagram of NVU in HD and selected genes (yellow denotes genes upregulated and blue downregulated in HD) that are changed in HD iBMECs and HD astrocytes. These genes may contribute to neuronal dysfunction and death. # (*p < 0.05; **p < 0.01; and ***p < 0.001).
For all of the error bars (mean ± SEM).
DISCUSSION
With the advent of iPSC technology and development of disease relevant models through differentiation of patient cells into cells of the NVU, we have the capability to determine cell-specific contributions to disease pathogenesis. Using iPSCs to generate iBMECs from HD and unaffected control subjects, we identified transcriptional and functional differences in human HD iBMECs that demonstrate primary intrinsic deficits in signaling pathways critical for CNS angiogenesis and BBB function.
Studies suggest that constituents of the NVU are altered in neurodegenerative diseases and may contribute to pathogenesis in cell-intrinsic or extrinsic ways including BBB dysfunction (Zhao et al., 2015). Classically, it was assumed that there was no overt BBB leakage in HD; however, recent data indicate vascular abnormalities and BBB dysfunction (Drouin-Ouellet et al., 2015; Hsiao et al., 2015). Our transcriptomic analysis of the HD versus unaffected control iBMECs provides insights into the networks uniquely altered that may underlie specific BBB functions. For instance, WNT signaling that contributes to development of the cerebrovascular network and BBB is altered in HD iBMECs. The increase in WNT target gene (SOX17) in a small cohort of early grade human HD cortical brain tissue and rescue of angiogenic deficits in iBMECs by WNT inhibition are consistent with dysregulation of WNT signaling in the endothelium. Thus, mHTT affects WNT/β-catenin signaling activity and as a consequence inhibits proper BMEC differentiation and maturation. Dysfunctional WNT/β-catenin signaling has also been implicated in BBB breakdown in Alzheimer’s disease (Liu et al., 2014; Riise et al., 2015). Our findings consolidate the role of WNT signaling as a key target leading to BBB dysfunction in neurodegenerative diseases.
Since several dysregulated pathways (WNT, NOTCH, and TGFβ signaling) in HD iBMECs control angiogenesis and barrier-genesis, this provides a potential mechanism to explain vascular defects found in HD patients and mouse models. Prior studies have attributed BBB deficits to increased astrocyte-mediated VEGF signaling (Hsiao et al., 2015); however, our data suggest that BMEC-intrinsic activation of pro-angiogenic signals likely makes blood vessels more permeable, leading to neurovascular dysfunction in HD. The delay in barrier formation may be due to high levels of mHTT that uncouples angiogenesis with proper expression of BBB-forming genes, leaving new small vessels that increase in density as the disease progresses with defective barrier properties unable to protect the CNS. This is consistent with our findings of aberrant paracellular, transcellular, or transporter barrier function in HD iBMECs. Pathway analysis of the RNA-seq data showed that a significant number of affected genes regulate both clathrin- and caveolin-mediated endocytosis, which could lead to abnormal endo/transcytosis. These include FABP4, DYNAMIN, and FILAMIN, which initiate vesicle formation and scission, F-actin, several integrin subunits, and receptors that activate endocytosis (transferrin and low density lipoprotein receptors) (Figure 4B). CAV-1-dependent endocytosis is normally downregulated in mature BMECs (Zhao et al., 2015). The presence of higher levels of transcytosis proteins (CAV-1) suggests that HD iBMECs have not undergone full maturation, but instead retain a more non-CNS endothelial phenotype. Although MDR1 is increased in expression, the transporter is non-functional. A recent study also showed increased MDR1 expression in both human HD post-mortem tissue and the R6/2 mouse model of HD; however, there was increased functional activity of the transporter in the HD mice (Kao et al., 2015). These differences suggest the need to examine transporter function in human CNS and the consequences for HD pathogenesis in greater detail.
We previously identified a specific pattern of H3K4me3 occupancy that marked genes dysregulated in HD neuronal cells in both a mouse model of HD (Vashishtha et al., 2013) and cortex of HD patients (Dong et al., 2015). Specific patterns of H3K4me3 and H3K27me3 occupancy are also observed in HD iPSC-derived neurons (HD iPSC Consortium, 2017), suggesting that these histone modifications are ubiquitously disrupted in multiple CNS cell types during HD progression. Therefore, epigenomic modulators may improve the function of multiple cells in the HD brain. Moreover, our proof of concept studies targeting WNT signaling in HD iBMECs suggest additional therapeutic targets that could be used in combination with those targeting neuronal deficits.
From a clinical perspective, therapeutic drug delivery into the brain necessitates an understanding of the state of BBB function in neurodegenerative diseases in order to develop effective treatments. The network data and functional outcomes reflecting these deficits in the HD iBMECs can help to identify the most critical targets for therapeutic intervention and be a tool for investigating fundamental biological and disease processes in the NVU that affect the human cerebral vascular network. In a complementary study (Vatine et al., 2017), a similar approach was used to generate iBMECs from Allan-Herndon-Dudley syndrome patients and identify the underlying cause of pathology, which had not been elucidated using animal models. The authors find that reduced TH availability to neural cells underlies the disease phenotype. The use of iBMECs to identify disease mechanisms for two separate neurological disorders provides confidence in the use of iPSC-derived BMEC models to understand human disease. Finally, the iBMEC model may be used to assess the CNS penetration of drugs under consideration for CNS drug discovery programs and guide future treatments for HD and other neurological disorder patients.
EXPERIMENTAL PROCEDURES
Generation and Characterization of Human Non-integrating iPSCs Using Episomal Plasmids
HD and non-disease repeat iPSCs were generated and characterized as described (Mattis et al., 2015) (and in Supplemental Information).
Maintenance and Differentiation of Human iPSC-Derived BMECs and iNPCs
There were seven iPSC lines that were maintained on matrigel (BD Biosciences) with mTESR (Stemcell Technologies). These cells were differentiated into BMECs as described (Lippmann et al., 2014) and in Supplemental Information. Control 33Q iPSC were differentiated into iNPCs as described (Ebert et al., 2013).
Immunofluorescence
Cells were stained as described (Lippmann et al., 2014) and in Supplemental Information. A list of antibodies and their use can be found in Supplemental Experimental Procedures (Table S9).
Wound Healing, Migration, and Proliferation Assays
Wound healing: following differentiation, iBMECs were plated in collagen/fibronectin-coated 12-well plates. After 24 hr, the cells reached 100% confluence and the initial scratch/wound was made. BMECs were either untreated, treated with DMSO (vehicle), or 20 μM XAV939. There were two images/well that were taken on an EVOS microscope at time 0 and 6 hr and six wells were used for each experiment/differentiation. Transwell migration: BMECs were plated in collagen IV/fibronectin-coated Transwells with 3.0 μM pores. After 24 hr, cells were treated with VEGF (50 or 100 ng/mL) or vehicle. At 24 hr after VEGF treatment, the upper chamber of the Transwell was cleared of cells using a cotton swab, the bottom well was fixed with 4% PFA. The Transwell membrane was cut out and mounted on a glass slide with DAPI. There were five DAPI images that were taken per well and three wells were used for each experiment/differentiation. Proliferation: At 48 hr after subculture, iBMECs were fixed and stained for Ki67. There were five images that were taken per chamber and two chambers were used for each experiment/differentiation. ImageJ software was used to quantify the area of the wound, the number of migrating cells, or Ki67 positive cells.
Transendothelial Electrical Resistance
TEER measurements were performed using an EVOM2 voltohmmeter (World Precision Instruments). The resistance value (Ωxcm2) of an empty filter coated with collagen/fibronectin was subtracted from each measurement.
RNA-Seq and DE Statistics
Total RNA was isolated from cells. RNA with quality scores >9 were used for the RNA-seq library generation. Paired-end reads were trimmed using a base quality score threshold of >20 and aligned to hg19. Counts per gene were quantified and analyzed with the R package DESeq2, or Partek Flow, to identify differentially expressed genes. See Supplemental Experimental Procedures and Table S6.
Exploratory, Pathway, and Motif Analysis of DEGs
Spearman’s ranked correlation was used for hierarchical clustering, and log2 transformed global expression values were used for PCA. QIAGEN’s IPA (http://www.qiagen.com/ingenuity) and EnrichR (Kuleshov et al., 2016) were used for pathway, network, and upstream regulator analysis. Cytoscape was used to visualize GO analysis networks from BiNGO, Enrichment Map, and ClueGO (Bindea et al., 2009; Maere et al., 2005; Merico et al., 2010; Shannon et al., 2003). THEME software was used for motif analysis. Also see Supplemental Experimental Procedures for more detail.
Flow Cytometry, Efflux, and Transporter Assays
For uptake assays, cells were treated with either 10 μM rhodamine 123 (Life Technologies) or 10 mM Albumin-Alexa594 (Life Technologies) and incubated for 1 hr at 37°C. Cells were dissociated into a single cell suspension, fixed using 4% PFA, and analyzed for molecule uptake by flow cytometry. Puromycin efflux was measured based on cell death after 48 hr treatment with either 0.5 or 1 μM puromycin. Flow cytometry was also used for protein quantification and to determine the fraction of CD31+/GLUT1+ by dissociating cells 48 hr after subculture, fixing, and staining with primary and secondary antibodies. Apoptotic and dead cells were quantified by flow cytometry as described in Life Technologies CellEvent Caspase-3/7 Green Flow Cytometry Assay Kit.
Human Tissue
Fresh frozen human cortical tissue was obtained from the New York Brain Bank at Columbia University from three healthy controls and three individuals with early HD (Table S8). Paraffin-embedded brain tissues from HD patients and non-neurological disease controls were obtained from the tissue bank at CUMC (D.A.; IRB protocol #AAAQ7343).
Western Blotting and Immunohistochemistry
Cell pellets from three independent experiments were lysed and western analysis performed with the LICOR quantitative fluorescence system as described (Lengfeld et al., 2017), with antibodies against human CLDN-5, OCLN, β-ACTIN (Invitrogen), and SOX17 (Abcam). Paraffin-embedded brain tissues were used to assess SOX17 expression as described (Lengfeld et al., 2017).
Supplementary Material
Highlights.
HD-iBMECs have intrinsic impairments in angiogenic potential and drug efflux
HD-iBMECs show impaired paracellular and transcellular barrier properties
HD-iBMEC transcriptome predicts defects in WNT signaling
Angiogenic defects are rescued upon WNT inhibition
Acknowledgments
We thank Dr. Sara Winokur for editorial assistance, Alice Lau for technical assistance, and Drs. Jean Paul Vonsattel and Etty Cortes at the New York Brain Bank for providing human HD cortical tissue. Support for this work was provided by the American Heart Association 12PRE10410000 and CIRM TG2-01152; NIH NRSA 5F31NS090859-02 fellowships (R.G.L.); NIH NS078370 (L.M.T. and C.N.S.), NIH NS089076 (E.F., L.M.T., and D.E.H.), NIH NS089076 (E.F.), NIH HL116995-01 (D.A. and S.E.L.), NIH MH109987 (D.A.), NeuroLINCS Center U54 NS091046 (L.M.T., C.N.S., and E.F.); and the NIH Biotechnology Training Program Fellowship T32GM008334 (A.J.K.). Additional support was provided by The Leducq Foundation (FDNLEDQ 15CVD 02) (D.A.), a gift from John Castle to the CUMC Neurology, Stroke Division (D.A.), and CIRM Bridges Program TB1-01182 (C.Q.). Computing resources were funded by the National Science Foundation under Award No. DB1-0821391. This work was made possible through access to the Genomic High Throughput Facility Shared Resource of the Cancer Center Support Grant (CA-62203) at the University of California, Irvine.
Footnotes
Supplemental Information includes Supplemental Experimental Procedures, two figures, and ten tables and can be found with this article online at http://dx.doi.org/10.1016/j.celrep.2017.04.021.
AUTHOR CONTRIBUTIONS
Conceptualization, R.G.L., D.A., and L.M.T.; Methodology, R.G.L., C.Q., S.E.L., D.A., and L.M.T.; Formal Analysis, R.G.L., T.A.G., A.J.K., and J.W.; Investigation, R.G.L., C.Q., A.M.R.-O., T.A.G., A.J.K., J.S., and S.E.L.; Resources, C.N.S.; Visualization, R.G.L., Writing - Original Draft, R.G.L., D.A., and L.M.T.; Writing - Review and Editing, C.Q., G.D.V., T.A.G., A.J.K., C.N.S., M.S.C., E.F., and D.E.H.; and Supervision, C.N.S., M.S.C., E.F., and D.E.H.
ACCESSION NUMBERS
The accession number for the RNA-seq reported in this paper is GEO: GSE97100. Any additional data that support the findings of this study are available from the corresponding author upon reasonable request.
References
- Bindea G, Mlecnik B, Hackl H, Charoentong P, Tosolini M, Kirilovsky A, Fridman WH, Pagès F, Trajanoski Z, Galon J. ClueGO: a Cytoscape plug-in to decipher functionally grouped gene ontology and pathway annotation networks. Bioinformatics. 2009;25:1091–1093. doi: 10.1093/bioinformatics/btp101. [DOI] [PMC free article] [PubMed] [Google Scholar]
- Chamorro-Jorganes A, Lee MY, Araldi E, Landskroner-Eiger S, Fernández-Fuertes M, Sahraei M, Quiles Del Rey M, van Solingen C, Yu J, Fernández-Hernando C, et al. VEGF-induced expression of miR-17–92 cluster in endothelial cells is mediated by ERK/ELK1 activation and regulates angiogenesis. Circ Res. 2016;118:38–47. doi: 10.1161/CIRCRESAHA.115.307408. [DOI] [PMC free article] [PubMed] [Google Scholar]
- Cheranov SY, Karpurapu M, Wang D, Zhang B, Venema RC, Rao GN. An essential role for SRC-activated STAT-3 in 14,15-EET-induced VEGF expression and angiogenesis. Blood. 2008;111:5581–5591. doi: 10.1182/blood-2007-11-126680. [DOI] [PMC free article] [PubMed] [Google Scholar]
- Dong X, Tsuji J, Labadorf A, Roussos P, Chen JF, Myers RH, Akbarian S, Weng Z. The role of H3K4me3 in transcriptional regulation is altered in Huntington’s disease. PLoS ONE. 2015;10:e0144398. doi: 10.1371/journal.pone.0144398. [DOI] [PMC free article] [PubMed] [Google Scholar]
- Drouin-Ouellet J, Sawiak SJ, Cisbani G, Lagacé M, Kuan WL, Saint-Pierre M, Dury RJ, Alata W, St-Amour I, Mason SL, et al. Cerebrovascular and blood-brain barrier impairments in Huntington’s disease: Potential implications for its pathophysiology. Ann Neurol. 2015;78:160–177. doi: 10.1002/ana.24406. [DOI] [PubMed] [Google Scholar]
- Ebert AD, Shelley BC, Hurley AM, Onorati M, Castiglioni V, Patitucci TN, Svendsen SP, Mattis VB, McGivern JV, Schwab AJ, et al. EZ spheres: a stable and expandable culture system for the generation of pre-rosette multipotent stem cells from human ESCs and iPSCs. Stem Cell Res (Amst) 2013;10:417–427. doi: 10.1016/j.scr.2013.01.009. [DOI] [PMC free article] [PubMed] [Google Scholar]
- Forsythe JA, Jiang BH, Iyer NV, Agani F, Leung SW, Koos RD, Semenza GL. Activation of vascular endothelial growth factor gene transcription by hypoxia-inducible factor 1. Mol Cell Biol. 1996;16:4604–4613. doi: 10.1128/mcb.16.9.4604. [DOI] [PMC free article] [PubMed] [Google Scholar]
- Franciosi S, Ryu JK, Shim Y, Hill A, Connolly C, Hayden MR, McLarnon JG, Leavitt BR. Age-dependent neurovascular abnormalities and altered microglial morphology in the YAC128 mouse model of Huntington disease. Neurobiol Dis. 2012;45:438–449. doi: 10.1016/j.nbd.2011.09.003. [DOI] [PubMed] [Google Scholar]
- Geier EG, Chen EC, Webb A, Papp AC, Yee SW, Sadee W, Giacomini KM. Profiling solute carrier transporters in the human blood-brain barrier. Clin Pharmacol Ther. 2013;94:636–639. doi: 10.1038/clpt.2013.175. [DOI] [PMC free article] [PubMed] [Google Scholar]
- HD iPSC Consortium. Induced pluripotent stem cells from patients with Huntington’s disease show CAG-repeat-expansion-associated phenotypes. Cell Stem Cell. 2012;11:264–278. doi: 10.1016/j.stem.2012.04.027. [DOI] [PMC free article] [PubMed] [Google Scholar]
- HD iPSC Consortium. Developmental alterations in Huntington’s disease neural cells and pharmacological rescue in cells and mice. Nat Neurosci. 2017;20:648–660. doi: 10.1038/nn.4532. [DOI] [PMC free article] [PubMed] [Google Scholar]
- Hsiao HY, Chen YC, Huang CH, Chen CC, Hsu YH, Chen HM, Chiu FL, Kuo HC, Chang C, Chern Y. Aberrant astrocytes impair vascular reactivity in Huntington disease. Ann Neurol. 2015;78:178–192. doi: 10.1002/ana.24428. [DOI] [PubMed] [Google Scholar]
- Hua J, Unschuld PG, Margolis RL, van Zijl PC, Ross CA. Elevated arteriolar cerebral blood volume in prodromal Huntington’s disease. Mov Disord. 2014;29(Suppl 3):396–401. doi: 10.1002/mds.25591. [DOI] [PMC free article] [PubMed] [Google Scholar]
- Huntley MA, Bien-Ly N, Daneman R, Watts RJ. Dissecting gene expression at the blood-brain barrier. Front Neurosci. 2014;8:355. doi: 10.3389/fnins.2014.00355. [DOI] [PMC free article] [PubMed] [Google Scholar]
- Jolma A, Yan J, Whitington T, Toivonen J, Nitta KR, Rastas P, Morgunova E, Enge M, Taipale M, Wei G, et al. DNA-binding specificities of human transcription factors. Cell. 2013;152:327–339. doi: 10.1016/j.cell.2012.12.009. [DOI] [PubMed] [Google Scholar]
- Kao YH, Chern Y, Yang HT, Chen HM, Lin CJ. Regulation of P-glycoprotein expression in brain capillaries in Huntington’s disease and its impact on brain availability of antipsychotic agents risperidone and paliperidone. J Cereb Blood Flow Metab. 2015;36:1412–1423. doi: 10.1177/0271678X15606459. [DOI] [PMC free article] [PubMed] [Google Scholar]
- Kuleshov MV, Jones MR, Rouillard AD, Fernandez NF, Duan Q, Wang Z, Koplev S, Jenkins SL, Jagodnik KM, Lachmann A, et al. Enrichr: a comprehensive gene set enrichment analysis web server 2016 update. Nucleic Acids Res. 2016;44(W1):W90–97. doi: 10.1093/nar/gkw377. [DOI] [PMC free article] [PubMed] [Google Scholar]
- Lengfeld JE, Lutz SE, Smith JR, Diaconu C, Scott C, Kofman SB, Choi C, Walsh CM, Raine CS, Agalliu I, Agalliu D. Endothelial Wnt/β-catenin signaling reduces immune cell infiltration in multiple sclerosis. Proc Natl Acad Sci USA. 2017;114:E1168–E1177. doi: 10.1073/pnas.1609905114. [DOI] [PMC free article] [PubMed] [Google Scholar]
- Lin CY, Hsu YH, Lin MH, Yang TH, Chen HM, Chen YC, Hsiao HY, Chen CC, Chern Y, Chang C. Neurovascular abnormalities in humans and mice with Huntington’s disease. Exp Neurol. 2013;250:20–30. doi: 10.1016/j.expneurol.2013.08.019. [DOI] [PubMed] [Google Scholar]
- Lippmann ES, Al-Ahmad A, Azarin SM, Palecek SP, Shusta EV. A retinoic acid-enhanced, multicellular human blood-brain barrier model derived from stem cell sources. Sci Rep. 2014;4:4160. doi: 10.1038/srep04160. [DOI] [PMC free article] [PubMed] [Google Scholar]
- Liu L, Wan W, Xia S, Kalionis B, Li Y. Dysfunctional Wnt/β-catenin signaling contributes to blood-brain barrier breakdown in Alzheimer’s disease. Neurochem Int. 2014;75:19–25. doi: 10.1016/j.neuint.2014.05.004. [DOI] [PubMed] [Google Scholar]
- Maere S, Heymans K, Kuiper M. BiNGO: a Cytoscape plugin to assess overrepresentation of gene ontology categories in biological networks. Bioinformatics. 2005;21:3448–3449. doi: 10.1093/bioinformatics/bti551. [DOI] [PubMed] [Google Scholar]
- Mancuso MR, Kuhnert F, Kuo CJ. Developmental angiogenesis of the central nervous system. Lymphat Res Biol. 2008;6:173–180. doi: 10.1089/lrb.2008.1014. [DOI] [PMC free article] [PubMed] [Google Scholar]
- Mattis VB, Tom C, Akimov S, Saeedian J, Østergaard ME, Southwell AL, Doty CN, Ornelas L, Sahabian A, Lenaeus L, et al. HD iPSC-derived neural progenitors accumulate in culture and are susceptible to BDNF withdrawal due to glutamate toxicity. Hum Mol Genet. 2015;24:3257–3271. doi: 10.1093/hmg/ddv080. [DOI] [PMC free article] [PubMed] [Google Scholar]
- Merico D, Isserlin R, Stueker O, Emili A, Bader GD. Enrichment map: a network-based method for gene-set enrichment visualization and interpretation. PLoS ONE. 2010;5:e13984. doi: 10.1371/journal.pone.0013984. [DOI] [PMC free article] [PubMed] [Google Scholar]
- Miller DW, Batrakova EV, Waltner TO, Yu Alakhov V, Kabanov AV. Interactions of pluronic block copolymers with brain microvessel endothelial cells: evidence of two potential pathways for drug absorption. Bioconjug Chem. 1997;8:649–657. doi: 10.1021/bc970118d. [DOI] [PubMed] [Google Scholar]
- Munoz-Sanjuan I, Bates GP. The importance of integrating basic and clinical research toward the development of new therapies for Huntington disease. J Clin Invest. 2011;121:476–483. doi: 10.1172/JCI45364. [DOI] [PMC free article] [PubMed] [Google Scholar]
- Perrière N, Demeuse P, Garcia E, Regina A, Debray M, Andreux JP, Couvreur P, Scherrmann JM, Temsamani J, Couraud PO, et al. Puromycin-based purification of rat brain capillary endothelial cell cultures. Effect on the expression of blood-brain barrier-specific properties. J Neurochem. 2005;93:279–289. doi: 10.1111/j.1471-4159.2004.03020.x. [DOI] [PubMed] [Google Scholar]
- Riise J, Plath N, Pakkenberg B, Parachikova A. Aberrant Wnt signaling pathway in medial temporal lobe structures of Alzheimer’s disease. J Neural Transm (Vienna) 2015;122:1303–1318. doi: 10.1007/s00702-015-1375-7. [DOI] [PubMed] [Google Scholar]
- Ross CA, Tabrizi SJ. Huntington’s disease: from molecular pathogenesis to clinical treatment. Lancet Neurol. 2011;10:83–98. doi: 10.1016/S1474-4422(10)70245-3. [DOI] [PubMed] [Google Scholar]
- Seong IS, Woda JM, Song JJ, Lloret A, Abeyrathne PD, Woo CJ, Gregory G, Lee JM, Wheeler VC, Walz T, et al. Huntingtin facilitates polycomb repressive complex 2. Hum Mol Genet. 2010;19:573–583. doi: 10.1093/hmg/ddp524. [DOI] [PMC free article] [PubMed] [Google Scholar]
- SEQC/MAQC-III Consortium. A comprehensive assessment of RNA-seq accuracy, reproducibility and information content by the Sequencing Quality Control Consortium. Nat Biotechnol. 2014;32:903–914. doi: 10.1038/nbt.2957. [DOI] [PMC free article] [PubMed] [Google Scholar]
- Shannon P, Markiel A, Ozier O, Baliga NS, Wang JT, Ramage D, Amin N, Schwikowski B, Ideker T. Cytoscape: a software environment for integrated models of biomolecular interaction networks. Genome Res. 2003;13:2498–2504. doi: 10.1101/gr.1239303. [DOI] [PMC free article] [PubMed] [Google Scholar]
- Takahashi K, Tanabe K, Ohnuki M, Narita M, Ichisaka T, Tomoda K, Yamanaka S. Induction of pluripotent stem cells from adult human fibroblasts by defined factors. Cell. 2007;131:861–872. doi: 10.1016/j.cell.2007.11.019. [DOI] [PubMed] [Google Scholar]
- The Huntington’s Disease Collaborative Research Group. A novel gene containing a trinucleotide repeat that is expanded and unstable on Huntington’s disease chromosomes. Cell. 1993;72:971–983. doi: 10.1016/0092-8674(93)90585-e. [DOI] [PubMed] [Google Scholar]
- Vashishtha M, Ng CW, Yildirim F, Gipson TA, Kratter IH, Bodai L, Song W, Lau A, Labadorf A, Vogel-Ciernia A, et al. Targeting H3K4 trimethylation in Huntington disease. Proc Natl Acad Sci USA. 2013;110:E3027–E3036. doi: 10.1073/pnas.1311323110. [DOI] [PMC free article] [PubMed] [Google Scholar]
- Vatine GD, Al-Ahmad A, Barriga BK, Svendsen S, Salim A, Garcia L, Garcia VJ, Ho R, Yucer N, Qian T, et al. Modeling psychomotor retardation using iPSCs from MCT8-deficient patients indicates a prominent role for the blood-brain barrier. Cell Stem Cell. 2017;20 doi: 10.1016/j.stem.2017.04.002. Published online May 16, 2017. http://dx.doi.org/10.1016/j.stem.2017.04.002. [DOI] [PMC free article] [PubMed] [Google Scholar]
- Walker FO. Huntington’s disease. Semin Neurol. 2007;27:143–150. doi: 10.1055/s-2007-971176. [DOI] [PubMed] [Google Scholar]
- Wang D, Zhang J, Lu Y, Luo Q, Zhu L. Nuclear respiratory factor-1 (NRF-1) regulated hypoxia-inducible factor-1α (HIF-1α) under hypoxia in HEK293T. IUBMB Life. 2016;68:748–755. doi: 10.1002/iub.1537. [DOI] [PubMed] [Google Scholar]
- Wingender E, Dietze P, Karas H, Knüppel R. TRANSFAC: a database on transcription factors and their DNA binding sites. Nucleic Acids Res. 1996;24:238–241. doi: 10.1093/nar/24.1.238. [DOI] [PMC free article] [PubMed] [Google Scholar]
- Xu X, Wells AB, O’Brien DR, Nehorai A, Dougherty JD. Cell type-specific expression analysis to identify putative cellular mechanisms for neurogenetic disorders. J Neurosci. 2014;34:1420–1431. doi: 10.1523/JNEUROSCI.4488-13.2014. [DOI] [PMC free article] [PubMed] [Google Scholar]
- Yu J, Vodyanik MA, Smuga-Otto K, Antosiewicz-Bourget J, Frane JL, Tian S, Nie J, Jonsdottir GA, Ruotti V, Stewart R, et al. Induced pluripotent stem cell lines derived from human somatic cells. Science. 2007;318:1917–1920. doi: 10.1126/science.1151526. [DOI] [PubMed] [Google Scholar]
- Zhang Y, Chen K, Sloan SA, Bennett ML, Scholze AR, O’Keeffe S, Phatnani HP, Guarnieri P, Caneda C, Ruderisch N, et al. An RNA-sequencing transcriptome and splicing database of glia, neurons, and vascular cells of the cerebral cortex. J Neurosci. 2014;34:11929–11947. doi: 10.1523/JNEUROSCI.1860-14.2014. [DOI] [PMC free article] [PubMed] [Google Scholar]
- Zhao Z, Nelson AR, Betsholtz C, Zlokovic BV. Establishment and dysfunction of the blood-brain barrier. Cell. 2015;163:1064–1078. doi: 10.1016/j.cell.2015.10.067. [DOI] [PMC free article] [PubMed] [Google Scholar]
Associated Data
This section collects any data citations, data availability statements, or supplementary materials included in this article.