

SUMMARY
Tissue-resident memory T cells (TRM) in mice mediate optimal protective immunity to infection and vaccination, while in humans, the existence and properties of TRM remain unclear. Here, we use a unique human tissue resource to determine whether human tissue memory T cells comprise a distinct subset in diverse mucosal and lymphoid tissues. We identify a core transcriptional profile within the CD69+ subset of memory CD4+ and CD8+ T cells in lung and spleen that is distinct from that of CD69−TEM cells in tissues and circulation, and defines human TRM based on homology to the transcriptional profile of mouse CD8+TRM. Human TRM in diverse sites exhibit increased expression of adhesion and inhibitory molecules, produce both pro-inflammatory and regulatory cytokines, and have reduced proliferation compared with circulating TEM, suggesting unique adaptations for in situ immunity. Together our results provide a unifying signature for human TRM and a blueprint for designing tissue-targeted immunotherapies.
Keywords: Human Immunology, memory T cells, RNA-Seq, Mucosal Immunity
eTOC Blurb
Kumar et al. identify a core transcriptional and phenotypic signature which defines human TRM for both CD4+ and CD8+ T cells that is preserved across diverse individuals and in mucosal and lymphoid sites.
INTRODUCTION
The establishment and maintenance of long term immunity depends on the generation of memory T cells which can populate diverse tissue sites. The effector-memory (TEM) subset (Sallusto et al., 1999) is the predominant subset migrating through multiple tissues (Masopust et al., 2001); however, a significant fraction of TEM phenotype cells persist as non-circulating, tissue-resident subsets (TRM) in multiple sites including lungs, intestines, skin, liver, brain, and other mucosal surfaces (for reviews see (Mueller and Mackay, 2016; Schenkel and Masopust, 2014; Thome and Farber, 2015)). TRM mediate optimal protective responses to site-specific infections through rapid mobilization of immune responses in situ (Schenkel et al., 2014a; Teijaro et al., 2011). Mouse models have also demonstrated the feasibility of targeting TRM in vaccines for generating protective immunity (Shin and Iwasaki, 2012; Zens et al., 2016). Given their potential importance in immune protection and tissue homeostasis, an understanding of TRM identity, function, and regulation in humans is essential for translating strategies to target tissue-specific responses for protection and immunomodulation.
Advances in human TRM biology are limited by the lack of assays to distinguish circulating and resident memory T cells in tissues. In mice, tissue retention demonstrated by parabiosis (Jiang et al., 2012; Steinert et al., 2015) and in vivo antibody labeling (Anderson et al., 2014; Turner et al., 2014) identified phenotypic markers associated with tissue residence, including CD69 and CD103. In mice, CD69 is expressed by the majority of CD4+ and CD8+ TRM cells in multiple sites (Jiang et al., 2012; Masopust et al., 2006; Schenkel et al., 2013; Teijaro et al., 2011), while CD103 is only expressed by certain subsets of CD8+ TRM (Bergsbaken and Bevan, 2015; Mueller and Mackay, 2016) and not significantly by CD4+ TRM (Thom et al., 2015; Turner et al., 2014). CD69 has also been shown to have tissue-retention functions in lymph nodes through sequestration of the sphingosine-1-P receptor (S1PR) that mediates egress of T cells (Matloubian et al., 2004; Shiow et al., 2006) and is required for TRM retention in the skin (Mackay et al., 2015). Whether CD69 can delineate TRM from circulating TEM counterparts remains to be established in humans and is a critical outstanding question in the field.
In human tissues, we and others have identified and characterized TRM phenotype cells expressing CD69 and/or CD103 in multiple sites including lungs, liver, lymphoid sites, skin and intestines (Hombrink et al., 2016; Pallett et al., 2017; Purwar et al., 2011; Sathaliyawala et al., 2013; Thome and Farber, 2015; Thome et al., 2014; Watanabe et al., 2015; Wong et al., 2016; Woon et al., 2016). However, it is not known whether TRM represent a distinct subset in humans for both CD8+ and CD4+T cell lineages, with unifying functional, phenotypic, and transcriptional signatures across tissues and individuals.
We have established a human tissue resource to obtain blood, multiple lymphoid and mucosal tissues from previously healthy organ donors, enabling analysis of T cell compartmentalization and maintenance throughout life (Gordon et al., 2017; Sathaliyawala et al., 2013; Thome et al., 2016a; Thome et al., 2016b; Thome et al., 2014). We present here transcriptional, phenotypic, and functional analyses which define human TRM as a distinct subset in multiple sites. We show that CD69 is a key marker that distinguishes memory T cells in tissues from those in circulation, while CD103 is expressed only by a subset of tissue memory CD8+ and not by CD4+ T cells. CD69+ tissue memory T cells are transcriptionally and phenotypically distinct from CD69− memory T cells in tissues and blood and exhibit a core gene profile comprising adhesion, migration, and regulatory molecules with homology to mouse TRM. This core signature is shared between human CD4+ and CD8+TRM and in multiple lymphoid and mucosal tissues. Further, human TRM have an enhanced capacity for production of certain cytokines and regulatory molecules and decreased turnover compared to circulating TEM cells, suggesting long term maintenance in situ. Together, our study establishes human TRM as a distinct subset stably maintained in diverse anatomic locations.
RESULTS
CD69+ memory populations exist only in tissues and do not show evidence of activation
To identify the major phenotypic marker distinguishing tissue from circulating memory T cells, we assessed CD69 and CD103 expression as markers associated with TRM in mice by CD45RA−/CCR7−TEM-phenotype CD4+ and CD8+T cells in blood and 9 tissue sites of individual donors (Fig. 1A, B). We focused on TEM cells as the major memory subset in tissues that is common to both CD4+ and CD8+ T cells as previously determined (Thome et al., 2014). While blood memory T cells were predominantly CD69−/CD103−, the majority (>50–90%) of tissue memory CD4+ and CD8+T cells in all sites examined including lungs, intestines, salivary glands, tonsils, spleen, and various lymph nodes (LN) expressed CD69 (Fig. 1A,B). CD103 was expressed predominantly by memory CD8+T cells in tissues associated with the oral-gastrointestinal tract (salivary glands, tonsils, intestines) and lung, with significantly lower proportions of CD103+CD8+ memory T cells in spleen and lymph nodes (10–30%), with few tissue memory CD4+T cells expressing CD103 (<5–10%, Fig. 1A, B). Together, these findings indicate that CD69 expression distinguishes tissue from blood TEM across multiple lymphoid and barrier tissues and CD4/CD8 lineages, while CD103 expression is more variable and confined to certain tissue CD8+T cells.
Figure 1. CD69+ memory T cells are prevalent in tissues and do not show features of activation.

(A) Expression of CD69 and CD103 by CD4+ (top) and CD8+ (lower) memory T cells (CCR7-CD45RA-) within each indicated site from one individual (donor 332) representative of 6 donors. LLN: Lung lymph node, ILN: inguinal lymph node, MLN: mesenteric lymph node. (B) Frequency of CD69+CD103+ (grey) and CD69+CD103+ (blue) CD4+ (left) and CD8+ memory T cells in each tissue compiled from 16–22 donors. (C) Activation profile of T cells from human tissues. Flow cytometry plots show expression of CD25, CD38, and HLA-DR by naïve T cells (CCR7+ CD45RA+, blue line), and CD69− (black) and CD69+ (red) subsets of memory T cells (CCR7−CD45RA−). Data are representative of 3 donors. (D) Sorting strategy for isolation of CD4+ and CD8+ CD45RA−CCR7−CD69+ and CD45RA−CCR7−CD69− T cells for RNA sequencing is shown from spleen.
Because CD69 is also a marker of early activation, we assessed expression of the activation markers CD25, CD38, and HLA-DR by CD69+ and CD69− memory subsets from a representative lymphoid (spleen) and mucosal (lung) tissue. There was uniformly low expression of CD25, CD38, and HLA-DR on CD69+ TEM similar to expression levels on resting naïve T cells (Fig. 1C). Previously, we also found maintenance of CD28 and CD127 expression by the majority of CD69+ tissue memory T cells, indicative of a quiescent state (Thome et al., 2014). Together, our results show that CD69 expression by tissue memory T cells is not associated with markers of recent activation.
Human CD69+ tissue memory T cells comprise a transcriptionally distinct subset with features of tissue residency
Based on the phenotype analysis above, we hypothesized that human tissue-resident memory T cells could be found within the CD69+ subset of tissue memory T cells. We isolated CD4+ and CD8+TEM cells from the spleen and lungs of 3 previously healthy organ donors (sorting strategy shown in Fig. 1D; donor information in Table S1), fractionated them into CD69+ and CD69− subpopulations for whole transcriptome profiling by RNAseq, and analyzed the resultant profiles of CD69+ and CD69− subsets for each lineage and tissue. Principal component analysis (PCA) revealed that the transcriptome of CD69+ cells was distinct from that of the CD69− subset for CD4+ and CD8+ memory T cells in spleen and lung tissue for all three donors analyzed (Fig. 2A). This result indicates that CD69 expression defines a transcriptionally distinct subset of memory T cells in tissues.
Figure 2. CD69 expression defines a transcriptionally distinct memory subset in humans with features of tissue residency.

Whole transcriptome profiling by RNA sequencing was performed on CD69− and CD69+ subsets of CD4+ and CD8+ memory T cells from spleen and lungs of 3 donors (Donors 226, 233, 250; see methods). (A) Principle Component Analysis (PCA) of paired CD69+ and CD69− samples from spleen and lung and for CD4+ and CD8+ subsets, based on the global transcriptome (~20000 genes). (B) Diagram shows the number of significant differentially expressed genes (FDR≤0.05 and log2 fold-change ≥1) between CD69− and CD69+ samples within each tissue for CD4+ and CD8+ T cells showing overlap between tissues. (C) Heat map showing normalized expression levels of the overlap genes identified in (B) for CD4+ (77 genes) and CD8+ (133 genes) CD69− vs. CD69+ subsets from spleen (S) and lung (L). (D) Transcriptional downregulation of S1PR1 and KLF2 in all CD69+ vs. CD69− subsets. Normalized expression levels of S1PR1 (top) and KLF2 (bottom) transcripts in CD69− and CD69+ samples from spleen (S) and lung (L) of each donor are shown. Individual donors are indicated by distinct symbols, and lines connect samples from identical donors within a tissue. **** FDR≤10−5, *** FDR≤10−3. (E) PCA of CD69+ (red) and CD69− (black: tissue, blue: blood) memory subsets based on the genes in (C). S=spleen, L=lung, B=blood. See also Figure S1 and Table S6.
Applying the criteria for significance (FDR≤0.05 and absolute value of log2 fold-change ≥1), for CD4+ samples we identified 327 genes differentially expressed between lung CD69+ and CD69− subsets and 221 genes differentially expressed between spleen CD69+ and CD69− subsets, of which 77 genes (29 upregulated, 48 downregulated) were differentially expressed in both tissues (Fig. 2B, C). For CD8+ samples we identified 329 genes differentially expressed between lung CD69+ and CD69− subsets and 459 genes differentially expressed between spleen CD69+ and CD69− subsets, of which 133 genes (39 upregulated, 94 downregulated) were differentially expressed in both tissues (Fig. 2B, C). The expression differences in these key genes were similar between three donors (Fig. 2C).
The genes differentially expressed by human CD69+ and CD69−TEM cells (Fig. 2C) included key molecules associated with mouse CD8+TRM from infection models (Mackay et al., 2016; Mackay et al., 2013; Skon et al., 2013; Wakim et al., 2012). Notably, downregulation of S1PR1 and its associated transcription factor KLF2 are required for CD8+TRM establishment in mice (Skon et al., 2013), and we found striking downregulation of S1PR1 (8-16-fold) and KLF2 (2-16-fold) transcripts for all CD69+ compared with CD69− subsets in every donor for both CD4+ and CD8+T cells in lung and spleen (Fig. 2D). In addition, human CD8+CD69+ subsets exhibited upregulation of ITGAE (CD103), ITGA1 (CD49a), ICOS, and the transcription factor IRF4, also found to be upregulated by mouse CD8+TRM in different systems (Mackay and Kallies, 2017). Together, these results show that the CD69+ tissue memory T cells comprise a transcriptionally distinct subset enriched for features of tissue residency.
We further compared the transcriptional profiles of tissue memory T cell subsets with circulating TEM cells isolated from the blood of three healthy volunteers. PCA analysis using the gene signature in Fig. 2C resulted in clustering of blood TEM with CD69− tissue TEM, distinct from CD69+ samples which clustered together (Fig. 2E). By contrast, PCA analysis using an equal number of randomly selected genes as a negative control yielded no clustering pattern (Fig. S1). This grouping suggests that CD69 expression by memory T cells in tissues distinguishes circulating memory subsets from those retained in tissues.
A core gene signature of human CD69+ memory T cells
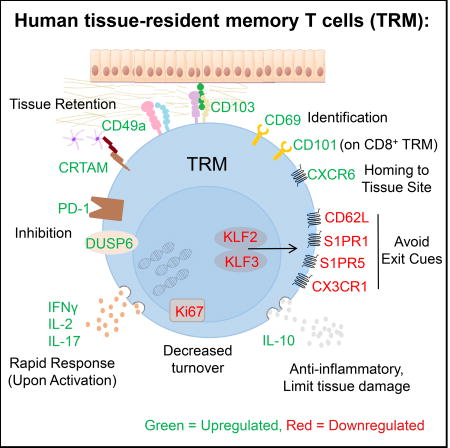
Based on the gene expression analysis above, we identified 31 core genes with consistent significant differential expression by CD4+ and CD8+ CD69+ compared with the corresponding CD69− subset from lung, spleen, and blood (Fig. 3A and Table S2). This core signature included upregulation of the adhesion markers ITGAE (CD103) and ITGA1 (CD49a), the chemokine-receptors CXCR6 and CX3CR1, and molecules with known inhibitory functions in T cells including PDCD1 (PD-1) (Barber et al., 2006), the dual-specificity phosphatase DUSP6 that turns off MAP Kinase signaling (Bertin et al., 2015), and IL10 (IL-10). Downregulated genes within the core signature included S1PR1 and its associated transcription factor KLF2, which together control T cell homing and tissue retention (Skon et al., 2013), the related Kruppel-like transcription factor KLF3, the lymph node homing receptor SELL (CD62L), as well as RAP1GAP1 and RGS1, G protein signaling genes that modulate T cell trafficking (Gibbons et al., 2011).
Figure 3. A core gene signature defines tissue CD69+ memory T cells distinct from circulating CD69− cells in tissues and blood.

(A) Heatmap shows normalized expression of genes with significant differential expression between CD69+ and CD69− memory T cells for all subsets (CD4+, CD8+) and tissues (spleen, lung). (B) Network analysis of the core gene set in (A) showing known and predicted interactions (activating, inhibitory) between proteins encoded by the core genes that are upregulated (red) or downregulated (green) by TRM compared with TEM with key pathways indicated in the shaded boxes. Relationships were determined using IPA software, String Protein database, GeneCards, and Pubmed literature searches. (C-G) Normalized mRNA expression levels of ITGA1 (C), ITGAE (D), CXCR6 (E), CX3CR1 (F), and PDCD1 (G) by CD4+ and CD8+ CD69+ and CD69− memory subsets in blood (B), spleen (S) and lung (L) of each individual donor.*FDR≤0.05, ** FDR≤10−2, ***FDR≤10−3, ****FDR≤10−5. Each donor is represented by a unique shape as indicated. See also Figures S2 and S3.
Pathways represented within the core signature include those controlling T cell adhesion and migration, proliferation, development, and activation (Table S3) that interconnect as diagrammed in Fig. 3B. Many of the upregulated genes map downstream of TCR signaling, including CD69, adhesion molecules (ITGA1, ITGAE, CRTAM), and activation-induced molecules IL2 (IL-2), IL10 (IL-10), and PDCD1 (PD-1) that can regulate proliferation (Fig. 3B). Differential upregulation or downregulation of specific chemokines and chemokine receptors (CXCL13, CXCR6, CX3CR1, SELL, S1PR1) and modulation of G-protein mediated signaling (Fig. 2B) indicates that tissue residence involves specific tuning of migratory properties. Overall, these results establish that human CD69+ tissue memory T cells maintain a core signature impinging on multiple signaling pathways affecting cellular migration, function, and proliferation.
The relative transcript levels of key genes within the core gene signature (ITGA1 (CD49a), CXCR6, ITGAE (CD103), CXCR6, CX3CR1, and PDCD1 (PD-1)) showed differential regulation between CD69+ and CD69− subsets that was consistent across tissues, lineages, and diverse donors (Fig. 3C-G). We also validated differential surface protein expression for each marker compiled from 8–20 donors (Fig. S2, S3 and see below). Interestingly, for a number of genes (ITGAE, CX3CR1, PDCD1), there was an expression gradient from blood to tissue CD69− to CD69+ subsets, with blood memory cells exhibiting lower (ITGAE, PDCD1) or higher (CX3CR1) expression than CD69− subsets from tissues (Fig 3D, F-G), suggesting some differences between CD69− subsets in blood and tissues. Together, these data establish CD49a, CD103, CXCR6, CX3CR1, and PD-1 as core surface markers that distinguish human CD69+ and CD69− memory subsets across tissues and lineages.
The human CD69+ tissue memory core signature bears key homologies with mouse TRM
To determine whether the core transcriptional profile common to CD69+ memory T cells in spleen and lungs defined a TRM signature, we compared the RNA-Seq profile of the human tissue and blood subsets with that of mouse antigen-specific CD8+TRM isolated from skin and intestines following infection (Mackay et al. 2016). PCA of whole transcriptomes shows species-specific transcriptional differences between human and mouse T cells dominating, with all human samples clustering together distinct from mouse TRM/TEM, with cells from the two mouse infection models also transcriptionally distinct (Fig. 4A, left). When analyzed based on the human core gene signature in Fig. 3, CD4+CD69+ and CD8+CD69+ subsets from human spleen and lung cluster together with mouse CD8+TRM from skin and gut in the two different infection models, and are distinct from all TEM/CD69− counterparts (Fig. 4A, right). Gene set enrichment analysis (GSEA) (Subramanian et al., 2005) also revealed a strong enrichment of the differentially expressed genes in human CD4+CD69+ and CD8+CD69+ subsets within the gene signatures of TRM from mouse brain (Wakim et al., 2012), and mouse skin and lung (Mackay et al., 2013) (Fig. 4B). Taken together, our results show that the gene signature of human CD69+ tissue memory T cells exhibits key features of TRM and likely contain the human TRM subset.
Figure 4. Comparison of the human and mouse TRM transcriptome.

(A) PCA was performed using RNA-Seq data presented here (black symbols) compared to mouse herpes simplex virus (HSV)-specific CD8+ TRM from skin and CD8+TEM from spleen (“mouse HSV”, yellow) and LCMV-specific CD8+TRM from intestine and CD8+TEM from spleen (“Mouse LCMV”, red) (Mackay et al. 2016). Left: PCA comparing whole transcriptomes of each dataset comprising 15571 common genes between human and mouse. Right: PCA comparing the core human gene signature (Fig. 3) to the mouse datasets. (B) Gene set enrichment analysis (GSEA) comparing our human CD8+ (left) and CD4+ (left) gene sets to published microarray data of CD103+ brain TRM vs. spleen TEM (top row), gut TRM vs. spleen TEM (middle row), and lung TRM vs. spleen TEM (middle row) (Wakim et al. 2012; Mackay et al. 2013). In each plot, the x-axis shows the genes ranked with absolute value of log fold change between TRM vs. TEM and y-axis shows running enrichment score (ES) comparing the ranked list of genes with indicated p values. (C) Comparison of Hobit gene expression in mouse and human datasets. Violin plots show Z score of gene expression levels from mouse TRM (from Mackay et al. 2016) and human CD69+ memory T cells (this study). Red dots represent Hobit, blue dots represent the housekeeping gene GAPDH, green dots represent CD69, and the white dot represents median gene expression.
A recent report showed that mouse CD8+ TRM in multiple tissues exhibit biased expression of the Hobit (homologue-of BLIMP in T cells) transcription factor, which can drive TRM differentiation in vivo (Mackay et al., 2016). As Hobit was not part of the core gene set in our analysis, we specifically analyzed the expression level of Hobit (ZNF683) by human CD69+ memory T cells compared with mouse TRM. In mouse TRM, Hobit levels were higher than the housekeeping gene GAPDH and comparable to CD69 transcript levels. By contrast, for human CD69+ memory T cells, Hobit transcript levels were below median gene expression and significantly lower than GAPDH and CD69 levels (Fig. 4C). These results suggest distinct molecular control of human and mouse TRM differentiation, despite similar core signatures.
Reduced clonal overlap and proliferative turnover of CD69+ compared with CD69− memory T cells
We compared the TCR repertoires of lung and spleen CD69+ and CD69− memory T cell subsets using a recently developed algorithm TRUST (TCR repertoire utilities for solid tissue) (Li et al., 2017) to extract TCR sequences from the RNAseq reads (see extended methods). Between 0.1% and 0.3% of mapped reads could be assigned to the TCR region (data not shown), with detection of several hundred to over 1000 unique clonotypes per sample (Fig. S4). From these data, we measured clonal diversity (# unique clonotypes per mapped reads) and overlap between sites. Overall, CD69− and CD69+ cells exhibited similar clonal diversity with CD4+ subsets maintaining higher clonal diversity compared to CD8+ memory subsets (Fig. 5A), consistent with previous findings showing increased clonality of memory CD8+ compared to CD4+T cells from lymphoid sites (Thome et al., 2014). Clonal overlap between sites was minimal (<1%) for CD4+ subsets, while CD8+CD69+ cells exhibited significantly reduced overlap between lung and spleen compared to CD8+CD69− cells (Fig. 5B), indicating that CD69+ memory T cells are more clonally segregated within the tissue compared to CD69− cells. These results provide some additional evidence that CD69+ memory T cells may be more retained in tissue site compared with CD69− cells.
Figure 5. TCR clonal analysis, turnover, and function of CD69+ and CD69− cells.

(A) CD8+ T cells have reduced TCR repertoire diversity compared with CD4+ cells. CDR3 sequences were inferred from RNA-Seq data using TRUST (See methods). Graph shows the number of unique CDR3 calls (clonotypes) in each sample per 103 reads mapped to the TCR region. (B) Increased tissue overlap of TCR clones within CD8+ CD69− compared to CD69+ memory T cells. Graph shows percentage of overlapping clones between lung and spleen samples from each donor, calculated by dividing the total number of overlapping clones by the total number of unique clones present in both tissues. See also Figure S4. (C) Reduced proliferative turnover by CD69+ memory T cells. Left: Representative flow cytometry plots of intracellular Ki67 expression from spleen and lungs of one individual donor. Right: Ki67 expression compiled from 10 donors depicted as mean frequency KI67+±SEM. (D) Increased CD57 by CD69− compared to CD69+ cells. Left: CD57 expression by CD69− and CD69+ memory T cell subsets from spleen and lung of one representative donor. Right: CD57 expression compiled from 11 donors displayed as mean percent positive ±SEM. * p≤0.05, ** p≤0.01. (E-G) Distinct functional profile of CD69+ cells. CD4+ and CD8+ CD69− and CD69+ memory T cells isolated from spleens and lungs were stimulated with PMA/Ionomycin and cytokine production was assessed by intracellular cytokine staining (ICS) (for IL-2, IFN-γ, IL-17), or were stimulated with anti-CD3/CD28 beads (for IL-10) and IL-10 levels in the supernatant were assessed by BD cytokine bead array. (E) Graph shows mean frequency of CD69− and CD69+ cells producing IL-2. (F) Graph shows mean ±SEM IL-10 production in pg/ml. (G) Graph shows mean frequency of CD69− and CD69+ cells producing IFN-γ (left) and IL-17A (right) ±SEM. n=6 donors spleen, 10 donors lung for IL-2, IFN-γ, IL-17, n=3 donors for IL-10. *p<0.05, **p<0.01, ***p<0.001. Unstimulated cells had minimal cytokine production (<5%).
We hypothesized that the biased maintenance of CD69+ clones in certain sites may indicate reduced turnover. The frequency of CD69+ cells expressing Ki67, a marker of proliferating cells, was markedly reduced relative to CD69− cells in both spleen and lung (Fig. 5C). Examination of CD57 expression, a marker of replicative senescence and terminal differentiation (Kared et al., 2016), revealed lower CD57 expression by CD8+CD69+ compared to CD8+CD69− cells in both spleen and lung. Taken together, these data suggest that human CD69+ memory T cells undergo reduced proliferative turnover and have reduced clonal overlap compared with CD69− cells.
Human CD69+ memory T cells have a distinct functional profile
We investigated cytokine production by CD69+ and CD69− cells based on differential transcript expression of genes encoding IL-2, IFN-γ, IL-17 and IL-10 identified as significantly upregulated by CD69+ versus CD69− memory T cells for both CD4+ and/or CD8+ subsets (Figs. 2C and 3A). IL-2 and IL-10 were produced by a consistently higher proportion of CD69+ compared with CD69− memory T cells for both CD4+ and CD8+ subsets in spleen and lung (Fig. 5E-F), consistent with increased IL2 and IL-10 transcription being part of the core signature (Fig. 3A). IFN-γ was produced by spleen and lung memory CD4+ and CD8+ T cells, with spleen CD69+ memory T cells exhibiting increased IFN-γ production compared with CD69− cells, while lung CD69+ and CD69− cells had comparable IFN-γ production (Fig. 5G, left). IL-17 was produced more extensively by lung CD4+ and CD8+CD69+ compared with lung CD69− memory T cells, and not significantly by spleen CD69+ and CD69− cells (Fig. 5G, right). Together these results indicate that the functional capacity of CD69+ memory T cells comprise core features (e.g., IL-2, IL-10 production) along with subset and tissue influences.
The TRM transcriptional profile is conserved across lineages and tissues
Isolation of both CD4+ and CD8+ memory T cell subsets from two tissue sites of individual donors enabled us to assess lineage- and tissue-specific gene expression patterns. To identify lineage-specific genes, we compared differential gene expression by CD8+ CD69+ vs. CD69− and CD4+ CD69+ vs. CD69− subsets for each tissue site. The majority of genes showed similar differential expression in terms of direction and magnitude of fold change when looking at CD69+ vs. CD69− subsets from either CD8+ or CD4+ lineages (Fig. 6A). From a total of 907 genes that were differentially expressed by at least one of our CD69+ vs. CD69− pairs, there were 4 protein-coding genes that showed differential expression in CD4+ but not in CD8+ subsets, and 27 genes that showed significant differential expression in CD8+ but not in CD4+ subsets (Figs. 6A and S5A-B). Together, these results indicate that human CD4+ and CD8+ memory T cells have similar overall gene expression profiles.
Figure 6. Lineage and tissue-specific transcription and phenotypic profiles in human CD69+ memory T cells.

(A) Analysis of lineage-specific gene expression in CD69+ and CD69− memory T cells. Scatter plots display log2 fold change of CD4+CD69+ vs. CD69− on the x axis and CD8+ subsets on the y axis from lung (left) and spleen (right). Grey dots represent genes with significant differential expression in any paired CD69+ vs. CD69− sample. Orange dots (“CD4 specific”) represent genes with significant differential expression in CD4+ CD69+ vs. CD69− but not in CD8+ samples. Green dots (“CD8 specific”) represent genes with significant differential expression in CD8+CD69+ vs. CD69− but not in CD4+ samples. (B) Analysis of tissue-specific genes in CD69+ and CD69− memory T cells. Scatter plots display log2 fold change of lung CD69+ vs. CD69− samples on the x axis and spleen samples on the y axis for CD4+ (left) and CD8+ (right) T cells using the same strategy as in (A) with red dots denoting “spleen specific” and blue dots denoting “lung specific” transcripts in the paired analysis. (C) CD101 expression in human tissues. Representative plots show CD101 expression in CD69+ (black outline) and CD69− (shaded) cells from one individual donor. Data are representative of 15 donors (see Figure S5).
We applied a similar type of analysis as above to identify genes specific to lung or spleen memory T cells (Fig. 6B). Only 10 genes showed differential expression in CD69+ vs. CD69− in lung but not spleen samples, and 12 genes that showed significant differential expression in CD69+ vs. CD69− in spleen but not lung samples (Fig. 6B; S5C-D). Notably, CD101, encoding a cell surface immunoglobulin superfamily protein which inhibits T cell activation and proliferation (Soares et al., 1998) was transcriptionally upregulated in lung compared to spleen memory T cells. However, examination of CD101 surface expression by flow cytometry revealed increased expression by CD8+CD69+ compared with CD69− cells in both lung and spleen, with minimal upregulation by CD4+ tissue memory subsets (Fig. 6C). These results indicate that CD101 could be an additional marker for CD8+TRM cells.
TRM cells are a phenotypically distinct subset across multiple tissues
We asked whether multiple elements within the core signature together distinguished tissue memory subsets in spleen and lung using t-distributed scholastic neighbor embedding (t-SNE) analysis (van der Matten and Hinton, 2008; Wong et al., 2016), a dimensionality reduction method used to visualize high-dimensional data in two dimensions such that cells expressing similar markers will be close to each other. Based on the expression of 6 markers defined as part of the core TRM signature (Fig. 3), CD49a, CD103, CXCR6, CX3CR1, PD-1, and CD101, we found that CD69+ and CD69− subsets were located in distinct regions of the t-SNE plots for both CD4+ and CD8+T cells in each tissue (Fig. 7A), and in density plots compiled from both sites (Fig. 7B, top). Manual gating within each dominant cluster reveals that CD69− subsets exhibit elevated expression of CX3CR1 and low expression of CD49a, PD-1, CD101, CD101, and CXCR6 compared to CD4+ and CD8+CD69+ subsets exhibiting high expression of CD49a, PD-1, and CXCR6, and low expression of CX3CR1, with CD8+CD69+ subsets having high expression of CD103 and CD101 (Fig. 7B). These results further support the designation of tissue CD69+ memory T cells as TRM and the CD69− subset as TEM.
Figure 7. TRM are a phenotypically distinct subset across multiple tissues.

Simultaneous expression of CD49a, CD103, CD101, CXCR6, CX3CR1, PD-1, and CD69 was visualized using t-SNE analysis. (A) CD69+ and CD69− memory T cells are phenotypically distinct in spleen and lung. Plots show CD69+ memory T cells (color coded green) and CD69− memory T cells (color coded black) from spleen and lungs of an individual donor (Donor 321) representative of 5 donors. (B) Defining the phenotype of TRM and TEM clusters. Regions with high cellular density were manually gated within TEM (CD69−), CD4+ TRM (CD69+), and CD8+ TRM (CD69+) fractions (top row). Histograms show expression levels of CD49a, CD103, CD101, CXCR6, CX3CR1, and PD-1 within gated regions (bottom row). (C-D) The core TRM phenotype is observed across multiple tissues. Phenotype analysis as in (A) was performed using lung, intestine, spleen, mesenteric lymph node (MLN), tonsils, and blood samples from one representative donor (Donor 332). (C) Plots show CD4+ (left) and CD8+ (right) TRM and TEM subsets from all tissues with cell number density color coded. (D) Plots shows cells from all tissues (left large plot) or each individual site (Right smaller plots) color coded by cell type (CD4+ TRM, red; CD8+ TRM, green; TEM, black) of one donor representative of 4 donors. See also Figure S6.
We assessed how multiple phenotypic properties of the core signature were distributed in diverse sites within an individual, including in intestines, mesenteric lymph nodes, tonsils, and blood in addition to lung and spleen (Figs. 7C-D and Fig. S6). We initially generated t-SNE plots using concatenated data from all six tissue sites, revealing phenotypically distinct TEM and TRM subsets across multiple tissues (Fig 7C). In density plots, CD4+ and CD8+TEM cells were localized to the same region of the t-SNE, suggesting that TEM phenotypes are conserved across lineages and tissues (Fig. 7C). By contrast, CD8+TRM and CD4+TRM appeared at different regions within the t-SNE density plots distinct from TEM cells, (Fig. 7C). Notably, there was a broader range of phenotypes based on these markers within the CD4+TRM subset compared with the tighter clustering of CD8+TRM phenotypes, suggesting increased heterogeneity of CD4+ tissue memory T cells.
To compare the pattern of subset phenotypes between tissues, we assigned distinct colors to CD8+TRM, CD4+TRM and TEM populations. Plotting all tissue samples on the same t-SNE reveals the localization of each cell population (Fig. 7D, left), with TEM cells and CD4+ and CD8+TRM cells maintaining their distinct clustering patterns and localization in each site (Figs. 7D, right, and S6). In blood, TEM cells clustered in a similar pattern as TEM in other tissues (Fig. 7D, right), providing additional evidence that TEM in tissues are circulating. Notably, CD8+TRM cells exhibit a focused clustering pattern in all tissues, suggesting that human TRM cells represent a unique subset in multiple sites. CD4+TRM cells in all tissues exhibited a broader array of phenotypes suggesting increased heterogeneity of CD4+TRM compared to CD8+TRM cells throughout the body.
DISCUSSION
In this study we provide key insights into TRM biology through a comprehensive analysis of human CD4+ and CD8+ tissue memory subsets in lymphoid and mucosal tissues within and between multiple human donors. Our results establish that human tissue memory T cells fractionated based on CD69 expression exhibit a core signature of 31 genes conserved across tissues and lineages, with key homologies to the transcriptional profile of mouse TRM. We demonstrate that human TRM persist in multiple lymphoid, mucosal and peripheral tissue sites, exist within both CD4+ and CD8+ lineages, and exhibit unique functional signatures compared with circulating TEM cells including proinflammatory and regulatory capacities, and low turnover. Together, our results suggest that human TRM are a distinct developmental subset uniquely adapted for in situ immunity.
A definitive phenotypic marker for human TRM has not previously been defined. Transcriptional profiling has been reported for mouse CD8+TRM in which CD8+ memory T cells isolated from a barrier site (skin, intestine or lung) were compared with spleen (Mackay et al., 2016; Mackay et al., 2013). In human studies, CD8+TRM isolated based on CD103 expression from individual tissues (lung, skin) have been profiled in comparison to blood subsets (Cheuk et al., 2017; Hombrink et al., 2016). Here, we employed an innovative and comprehensive approach to assess differences in putative circulating and resident populations within tissues by directly comparing CD69+ memory subsets from a lymphoid and mucosal site (spleen and lung) with the corresponding CD69− subset from each tissue as well as CD69− TEM from blood for both CD4+ and CD8+ lineages. While CD103 has been used to define CD8+ TRM in mice (Schenkel and Masopust, 2014) and humans (Hombrink et al., 2016), our results demonstrate that CD69 expression can delineate tissue from circulating memory T cells based on the following results: First, CD69 is the major marker that distinguishes memory T cells in diverse tissues from those in circulation for CD4+ and CD8+ T cells, while CD103 expression is limited to a subset of tissue CD8+T cells. Second, CD69+ tissue memory T cells are a transcriptionally and phenotypically distinct subset that share core features with mouse TRM while human tissue CD69− cells share features with circulatory blood T cells. Finally, core phenotypic markers associated the CD69+ subset such as CD49a, PD-1, CXCR6, and CD101 delineate TRM cells across multiple mucosal and lymphoid tissues.
Although we found the TRM signature to be enriched within the CD69+ subset of human tissue memory T cells, the role of CD69 in determining tissue residence remains unclear. In mouse models, the majority of TRM cells in barrier sites express CD69; however, TRM cells lacking CD69 expression have been detected (Steinert et al., 2015), and CD69+ cells in the thymus were shown to recirculate during homeostasis (Park et al., 2016). However, the extent of CD69 expression by tissue memory T cells appears to be a function of antigen and pathogen exposure. We consistently find higher frequencies of CD69 expression by human tissue memory T cells compared to that found in mouse models maintained in spf conditions, particularly in lymphoid sites (Teijaro et al., 2011; Thome et al., 2014). Interestingly, T cells in “dirty” pet store mice had significantly higher frequencies of CD69 expression by T cells in tissues that was similar to humans (Beura et al., 2016). In our results, we consistently see separation of transcriptional profiles between CD69+ and CD69− subsets (Fig. 2), suggesting that delineation between these subsets in humans may be more defined than in mouse spf models due to the history of antigen exposure.
The core TRM gene signature identified here includes canonical genes and proteins associated with tissue residence in mice including downregulation of S1PR1, KLF2, and CD62L, upregulation of specific adhesion molecules (CD49a, CRTAM), modulation of specific chemokine receptors (increased CXCR6, decreased CX3CR1), and upregulation of inhibitory or regulatory molecules (PD-1, DUSP6, IL-10). We also found TRM to exhibit a distinct functional profile encompassing both pro-inflammatory, activating, and regulatory functions conserved between diverse individuals, tissues, and lineages. We further identified a marker CD101, with immunomodulatory function that is expressed by CD8+ TRM in multiple sites and could be useful in conjunction with other markers to identify TRM. We found phenotypic heterogeneity based on the core markers, particularly among CD4+TRM, and additional tissue heterogeneity has been reported in CyTOF profiling of human tissue T cells (Wong et al., 2016). CD103 expression by mouse intestinal TRM (Bergsbaken and Bevan, 2015) and CD49a in human skin memory T cells (Cheuk et al., 2017), have been shown to delineate distinct functional capacities, and dissecting human TRM heterogeneity will be an important area of focus in future studies.
The dominant presence of TRM in human tissues suggests a key protective role in situ. Our results reveal that human TRM possess dichotomous functional capacities, not only being poised for enhanced production of IL-2 and pro-inflammatory cytokines, but also producing IL-10 and exhibiting reduced proliferation and increased expression of inhibitors of T cell activation (i.e., PD-1, CD101). This may enable potent mobilization of immune responses in situ through pro-inflammatory cytokines but prevent excessive inflammation and cellular proliferation to limit inflammation-induced tissue damage. Moreover, the quiescent, inhibited state of TRM as assessed by the low turnover could promote longevity and prevent inappropriate activation to non-pathogenic antigens to which many human tissues are continually exposed.
Our findings show that in humans, TRM exist in multiple tissue sites and within CD4+ and CD8+ T cell lineages. While TRM have been detected in mouse LN (Schenkel et al., 2014b; Ugur et al., 2014), the majority of mouse lymphoid memory CD4+ and CD8+ T cells in mice are circulating, particularly those in the spleen. The predominance of TRM-phenotype cells in all human lymphoid tissues examined here including spleen, lymph nodes, and tonsils may reflect their long-term persistence over decades and/or continual pathogen exposure, consistent with a recent study identifying memory T cells specific for persistent viruses in human tonsils (Woon et al., 2016). TRM persistence in diverse sites may be due to the aggregate experience of numerous antigens over the human lifespan.
Interest in TRM is rapidly expanding to the study of many diseases, from infection to cancer to inflammation and autoimmunity. In humans, it is essential to identify and analyze these cells and determine whether they are functioning aberrantly in disease sites. Our study elucidates major unifying features of all tissue memory T cells in multiple healthy tissue sites within an individual. These results will serve as a valuable baseline from which to detect and study the role of tissue memory T cells in diseases, and for promoting tissue immunity in vaccines, cell- and biologic-based immunotherapies.
EXPERIMENTAL PROCEDURES
Acquisition of tissue from human organ donors
Human tissues were obtained from deceased organ donors at the time of organ acquisition for clinical transplantation through an approved research protocol and MTA with LiveOnNY, the organ procurement organization for the New York metropolitan area. All donors were free of chronic disease and cancer, Hepatitis B, C, and HIV-negative. Isolation of tissues from organ donors does not qualify as “human subjects” research, as confirmed by the Columbia University IRB. For isolation of blood from living volunteers, blood was drawn via venipuncture from consented volunteers, as approved by the Columbia University IRB. A list of donors and individuals from whom samples were obtained for this study is presented in Table S1.
Cell isolation from human lymphoid and non-lymphoid tissues
Tissue samples were maintained in cold saline and brought to the laboratory within 2-4hrs of organ procurement. Spleen, lung, and intestinal samples were processed using enzymatic and mechanical digestion resulting in high yields of live leukocytes, as described previously (Sathaliyawala et al., 2013; Thome et al., 2014). Lymphocytes were isolated from blood samples using centrifugation through lymphocyte separation medium (Corning) for recovery of mononuclear cells.
Flow Cytometry Analysis and Cell Sorting
For flow cytometry analysis, single-cell suspensions were stained with fluorochrome-conjugated antibodies (See Table S4 for all antibodies used in this study) in staining buffer (PBS/1% fetal bovine serum/0.1% sodium azide). Intracellular staining was performed using the Fixation/Permeabilization Solution Kit (BD Biosciences) for detection of cytokines and Foxp3/Transcription Factor Staining Buffer (Ebiosciences) for detection of transcription factors. Control samples included unstained, single fluorochrome–stained compensation beads (UltraComp eBeads, eBioscience), and fluorescence minus one (FMO) controls. Stained cells were acquired using a BD LSRII or BD Fortessa. Data were analyzed using FlowJo software (Tree Star) and FCS Express (De Novo Software). FCS express software was used for generating t-SNE plots. For isolation of subsets by fluorescent-activated cell sorting, lymphocyte suspensions were enriched for T cells using the MojoSort Human CD3 T cell Isolation Kit (Biolegend), stained for surface markers as indicated, and sorted using the BD Influx high-speed sorter (BD Biosciences).
Whole transcriptome profiling by RNA Sequencing
CD3+CD4+ and CD3+CD8+ TEM (CD45RA−CCR7−) cells were sorted into CD69+ and CD69− subsets based on the gating strategy in Fig. S1, from spleen and lung tissue of three individual donors (D226, D233, D250, see Table S1), and CD4+ and CD8+TEM cells (CD45RA−CCR7−CD69−) were sorted from peripheral blood. RNA was isolated from cell pellets using the RNeasy Mini Kit (Qiagen), quantitated using an Agilent 2100 Bioanalyzer (Agilent Technologies), and library preparation and RNAsequencing was performed by the Columbia Genome center. Differential gene expression analysis was performed with EdgeR (Robinson et al., 2010), and pathway analysis with Ingenuity Pathway Analysis software (IPA, Qiagen). For GSEA analysis with microarray data (Suárez-Fariñas et al., 2010), the absolute value of log2 fold change between TRM and TEM was used to rank the genes on the x-axis. For a detailed description of RNA-Seq procedures and analyses, see Supplemental experimental procedures. For QC summary of RNA-Seq samples, see Table S5.
T cell stimulations and cytokine analysis
TEM (CD45−CCR7−CD69−) and TRM (CD45RA−CCR7−CD69+) cells were sorted from lung and spleen tissue, plated in 96-well round-bottom plates at 105 cells/well in complete RPMI medium and stimulated for 72 hours using anti CD3/CD28/CD2 beads (T cell activation/expansion kit, Miltenyi Biotech). Supernatants from a minimum of 3 wells were pooled for each donor and cytokine secretion was measured using BD Cytokine Bead Array (Human Th1/Th2/Th17 Cytokine Kit). For short-term stimulations, CD4+ or CD8+T cells from spleen and lung tissues were stimulated with PMA (50ng/ml) + ionomycin (1 µg/ml) for 3 hours at 37°C in the presence of BD Golgistop. Cytokine production was assessed by intracellular staining for cytokines as described above.
Statistical analysis
Descriptive statistics (percent, mean, median, SEM) were calculated for each cell subset and tissue using Prism (Graphpad software). Significant differences in subset frequencies, ratios, gMFI and density were assessed using a paired t test.
Supplementary Material
Table S6. Complete differential gene expression between CD69+ and CD69− memory T cell subsets from lung and spleen, Related to Figures 2 and 3. Differential gene expression was assessed using EdgeR and table shows differential expression of all genes measured in the indicated groups ranked by decreasing significance. Fold change shown is gene expression in CD69+ samples compared with CD69− samples. logFC: log 2 fold change, logCPM: log 2 counts per million. n=3 donors for each group.
Highlights.
CD69+ memory T cells predominate in multiple tissues throughout the human body.
A core signature defining human TRM is enriched within CD69+ tissue memory T cells.
Human TRM have unique adhesion and migratory abilities and functional capacities.
Human TRM exhibiting the core profile populate multiple lymphoid and mucosal sites.
Acknowledgments
This work was supported by NIH grants AI06697 and HL116136 awarded to D.L.F. These studies were performed in the CCTI Flow Cytometry Core funded in part through the S10 Shared Instrumentation Grants, 1S10RR027050 (LSRII) and S10OD020056 (Influx) and 5P30DK063608. We wish to gratefully acknowledge the generosity of the donor families and the outstanding efforts of LiveOnNY transplant coordinators and staff for making this study possible.
Footnotes
Publisher's Disclaimer: This is a PDF file of an unedited manuscript that has been accepted for publication. As a service to our customers we are providing this early version of the manuscript. The manuscript will undergo copyediting, typesetting, and review of the resulting proof before it is published in its final citable form. Please note that during the production process errors may be discovered which could affect the content, and all legal disclaimers that apply to the journal pertain.
AUTHOR CONTRIBUTIONS
B.V.K. designed experiments, processed tissues, performed flow cytometry, collected the data, and wrote the paper; W.M. analyzed RNA-Seq data, made figures, and wrote the paper; D.C. and T.S. obtained donor tissues; S.H. helped with flow cytometry experiments and analyses; X.S. performed TCR analysis; H.L. and A.F. coordinated tissue donation and acquisition; M.M. and R.G. did tissue processing and flow cytometry; T.G. did tissue processing; Y.S. planned experiments, analyzed data, and wrote the paper; D.L.F planned experiments, coordinated tissue and data acquisition, analyzed data, and wrote the paper.
ACCESSION NUMBERS
The accession number for the RNA-Seq data reported in this paper is GEO: GSE94964.
References
- Anderson KG, Mayer-Barber K, Sung H, Beura L, James BR, Taylor JJ, Qunaj L, Griffith TS, Vezys V, Barber DL, et al. Intravascular staining for discrimination of vascular and tissue leukocytes. Nat Protoc. 2014;9:209–222. doi: 10.1038/nprot.2014.005. [DOI] [PMC free article] [PubMed] [Google Scholar]
- Barber DL, Wherry EJ, Masopust D, Zhu B, Allison JP, Sharpe AH, Freeman GJ, Ahmed R. Restoring function in exhausted CD8 T cells during chronic viral infection. Nature. 2006;439:682–687. doi: 10.1038/nature04444. [DOI] [PubMed] [Google Scholar]
- Bergsbaken T, Bevan MJ. Proinflammatory microenvironments within the intestine regulate the differentiation of tissue-resident CD8(+) T cells responding to infection. Nat Immunol. 2015;16:406–414. doi: 10.1038/ni.3108. [DOI] [PMC free article] [PubMed] [Google Scholar]
- Bertin S, Lozano-Ruiz B, Bachiller V, Garcia-Martinez I, Herdman S, Zapater P, Frances R, Such J, Lee J, Raz E, et al. Dual-specificity phosphatase 6 regulates CD4+ T-cell functions and restrains spontaneous colitis in IL-10-deficient mice. Mucosal Immunol. 2015;8:505–515. doi: 10.1038/mi.2014.84. [DOI] [PMC free article] [PubMed] [Google Scholar]
- Beura LK, Hamilton SE, Bi K, Schenkel JM, Odumade OA, Casey KA, Thompson EA, Fraser KA, Rosato PC, Filali-Mouhim A, et al. Normalizing the environment recapitulates adult human immune traits in laboratory mice. Nature. 2016;532:512–516. doi: 10.1038/nature17655. [DOI] [PMC free article] [PubMed] [Google Scholar]
- Cheuk S, Schlums H, Gallais Serezal I, Martini E, Chiang SC, Marquardt N, Gibbs A, Detlofsson E, Introini A, Forkel M, et al. CD49a Expression Defines Tissue-Resident CD8+ T Cells Poised for Cytotoxic Function in Human Skin. Immunity. 2017;46:287–300. doi: 10.1016/j.immuni.2017.01.009. [DOI] [PMC free article] [PubMed] [Google Scholar]
- Gibbons DL, Abeler-Dorner L, Raine T, Hwang IY, Jandke A, Wencker M, Deban L, Rudd CE, Irving PM, Kehrl JH, et al. Cutting Edge: Regulator of G protein signaling-1 selectively regulates gut T cell trafficking and colitic potential. J Immunol. 2011;187:2067–2071. doi: 10.4049/jimmunol.1100833. [DOI] [PMC free article] [PubMed] [Google Scholar]
- Gordon CL, Miron M, Thome JJ, Matsuoka N, Weiner J, Rak MA, Igarashi S, Granot T, Lerner H, Goodrum F, et al. Tissue reservoirs of antiviral T cell immunity in persistent human CMV infection. J Exp Med. 2017;214:651–667. doi: 10.1084/jem.20160758. [DOI] [PMC free article] [PubMed] [Google Scholar]
- Hombrink P, Helbig C, Backer RA, Piet B, Oja AE, Stark R, Brasser G, Jongejan A, Jonkers RE, Nota B, et al. Programs for the persistence, vigilance and control of human CD8+ lung-resident memory T cells. Nat Immunol. 2016;17:1467–1478. doi: 10.1038/ni.3589. [DOI] [PubMed] [Google Scholar]
- Jiang X, Clark RA, Liu L, Wagers AJ, Fuhlbrigge RC, Kupper TS. Skin infection generates non-migratory memory CD8+ TRM cells providing global skin immunity. Nature. 2012;483:227–231. doi: 10.1038/nature10851. [DOI] [PMC free article] [PubMed] [Google Scholar]
- Kared H, Martelli S, Ng TP, Pender SL, Larbi A. CD57 in human natural killer cells and T-lymphocytes. Cancer immunology, immunotherapy : CII. 2016;65:441–452. doi: 10.1007/s00262-016-1803-z. [DOI] [PMC free article] [PubMed] [Google Scholar]
- Li B, Li T, Wang B, Dou R, Zhang J, Liu JS, Liu XS. Ultrasensitive detection of TCR hypervariable-region sequences in solid-tissue RNA-seq data. Nature genetics. 2017;49:482–483. doi: 10.1038/ng.3820. [DOI] [PMC free article] [PubMed] [Google Scholar]
- Mackay LK, Braun A, Macleod BL, Collins N, Tebartz C, Bedoui S, Carbone FR, Gebhardt T. Cutting edge: CD69 interference with sphingosine-1-phosphate receptor function regulates peripheral T cell retention. J Immunol. 2015;194:2059–2063. doi: 10.4049/jimmunol.1402256. [DOI] [PubMed] [Google Scholar]
- Mackay LK, Kallies A. Transcriptional Regulation of Tissue-Resident Lymphocytes. Trends Immunol. 2017;38:94–103. doi: 10.1016/j.it.2016.11.004. [DOI] [PubMed] [Google Scholar]
- Mackay LK, Minnich M, Kragten NA, Liao Y, Nota B, Seillet C, Zaid A, Man K, Preston S, Freestone D, et al. Hobit and Blimp1 instruct a universal transcriptional program of tissue residency in lymphocytes. Science. 2016;352:459–463. doi: 10.1126/science.aad2035. [DOI] [PubMed] [Google Scholar]
- Mackay LK, Rahimpour A, Ma JZ, Collins N, Stock AT, Hafon ML, Vega-Ramos J, Lauzurica P, Mueller SN, Stefanovic T, et al. The developmental pathway for CD103(+)CD8+ tissue-resident memory T cells of skin. Nat Immunol. 2013;14:1294–1301. doi: 10.1038/ni.2744. [DOI] [PubMed] [Google Scholar]
- Masopust D, Vezys V, Marzo AL, Lefrancois L. Preferential localization of effector memory cells in nonlymphoid tissue. Science. 2001;291:2413–2417. doi: 10.1126/science.1058867. [DOI] [PubMed] [Google Scholar]
- Masopust D, Vezys V, Wherry EJ, Barber DL, Ahmed R. Cutting edge: gut microenvironment promotes differentiation of a unique memory CD8 T cell population. J Immunol. 2006;176:2079–2083. doi: 10.4049/jimmunol.176.4.2079. [DOI] [PubMed] [Google Scholar]
- Matloubian M, Lo CG, Cinamon G, Lesneski MJ, Xu Y, Brinkmann V, Allende ML, Proia RL, Cyster JG. Lymphocyte egress from thymus and peripheral lymphoid organs is dependent on S1P receptor 1. Nature. 2004;427:355–360. doi: 10.1038/nature02284. [DOI] [PubMed] [Google Scholar]
- Mueller SN, Mackay LK. Tissue-resident memory T cells: local specialists in immune defence. Nat Rev Immunol. 2016;16:79–89. doi: 10.1038/nri.2015.3. [DOI] [PubMed] [Google Scholar]
- Pallett LJ, Davies J, Colbeck EJ, Robertson F, Hansi N, Easom NJW, Burton AR, Stegmann KA, Schurich A, Swadling L, et al. IL-2high tissue-resident T cells in the human liver: Sentinels for hepatotropic infection. J Exp Med. 2017;214:1567–1580. doi: 10.1084/jem.20162115. [DOI] [PMC free article] [PubMed] [Google Scholar]
- Park SL, Mackay LK, Gebhardt T. Distinct recirculation potential of CD69+CD103-and CD103+ thymic memory CD8+ T cells. Immunology and cell biology. 2016;94:975–980. doi: 10.1038/icb.2016.60. [DOI] [PubMed] [Google Scholar]
- Purwar R, Campbell J, Murphy G, Richards WG, Clark RA, Kupper TS. Resident memory T cells (T(RM)) are abundant in human lung: diversity, function, and antigen specificity. PLoS One. 2011;6:e16245. doi: 10.1371/journal.pone.0016245. [DOI] [PMC free article] [PubMed] [Google Scholar]
- Robinson MD, McCarthy DJ, Smyth GK. edgeR: a Bioconductor package for differential expression analysis of digital gene expression data. Bioinformatics. 2010;26:139–140. doi: 10.1093/bioinformatics/btp616. [DOI] [PMC free article] [PubMed] [Google Scholar]
- Sallusto F, Lenig D, Forster R, Lipp M, Lanzavecchia A. Two subsets of memory T lymphocytes with distinct homing potentials and effector functions [see comments] Nature. 1999;401:708–712. doi: 10.1038/44385. [DOI] [PubMed] [Google Scholar]
- Sathaliyawala T, Kubota M, Yudanin N, Turner D, Camp P, Thome JJ, Bickham KL, Lerner H, Goldstein M, Sykes M, et al. Distribution and compartmentalization of human circulating and tissue-resident memory T cell subsets. Immunity. 2013;38:187–197. doi: 10.1016/j.immuni.2012.09.020. [DOI] [PMC free article] [PubMed] [Google Scholar]
- Schenkel JM, Fraser KA, Beura LK, Pauken KE, Vezys V, Masopust D. T cell memory. Resident memory CD8 T cells trigger protective innate and adaptive immune responses. Science. 2014a;346:98–101. doi: 10.1126/science.1254536. [DOI] [PMC free article] [PubMed] [Google Scholar]
- Schenkel JM, Fraser KA, Masopust D. Cutting edge: resident memory CD8 T cells occupy frontline niches in secondary lymphoid organs. J Immunol. 2014b;192:2961–2964. doi: 10.4049/jimmunol.1400003. [DOI] [PMC free article] [PubMed] [Google Scholar]
- Schenkel JM, Fraser KA, Vezys V, Masopust D. Sensing and alarm function of resident memory CD8 T cells. Nat Immunol. 2013;14 doi: 10.1038/ni.2568. [DOI] [PMC free article] [PubMed] [Google Scholar]
- Schenkel JM, Masopust D. Tissue-Resident Memory T Cells. Immunity. 2014;41:886–897. doi: 10.1016/j.immuni.2014.12.007. [DOI] [PMC free article] [PubMed] [Google Scholar]
- Shin H, Iwasaki A. A vaccine strategy that protects against genital herpes by establishing local memory T cells. Nature. 2012;491:463–467. doi: 10.1038/nature11522. [DOI] [PMC free article] [PubMed] [Google Scholar]
- Shiow LR, Rosen DB, Brdickova N, Xu Y, An J, Lanier LL, Cyster JG, Matloubian M. CD69 acts downstream of interferon-alpha/beta to inhibit S1P1 and lymphocyte egress from lymphoid organs. Nature. 2006;440:540–544. doi: 10.1038/nature04606. [DOI] [PubMed] [Google Scholar]
- Skon CN, Lee JY, Anderson KG, Masopust D, Hogquist KA, Jameson SC. Transcriptional downregulation of S1pr1 is required for the establishment of resident memory CD8+ T cells. Nat Immunol. 2013;14:1285–1293. doi: 10.1038/ni.2745. [DOI] [PMC free article] [PubMed] [Google Scholar]
- Soares LR, Tsavaler L, Rivas A, Engleman EG. V7 (CD101) ligation inhibits TCR/CD3-induced IL-2 production by blocking Ca2+ flux and nuclear factor of activated T cell nuclear translocation. J Immunol. 1998;161:209–217. [PubMed] [Google Scholar]
- Steinert EM, Schenkel JM, Fraser KA, Beura LK, Manlove LS, Igyarto BZ, Southern PJ, Masopust D. Quantifying Memory CD8 T Cells Reveals Regionalization of Immunosurveillance. Cell. 2015;161:737–749. doi: 10.1016/j.cell.2015.03.031. [DOI] [PMC free article] [PubMed] [Google Scholar]
- Suárez-Fariñas M, Lowes MA, Zaba LC, Krueger JG. Evaluation of the psoriasis transcriptome across different studies by gene set enrichment analysis (GSEA) PloS one. 2010;5:e10247. doi: 10.1371/journal.pone.0010247. [DOI] [PMC free article] [PubMed] [Google Scholar]
- Subramanian A, Tamayo P, Mootha VK, Mukherjee S, Ebert BL, Gillette MA, Paulovich A, Pomeroy SL, Golub TR, Lander ES, et al. Gene set enrichment analysis: a knowledge-based approach for interpreting genome-wide expression profiles. Proc Natl Acad Sci U S A. 2005;102:15545–15550. doi: 10.1073/pnas.0506580102. [DOI] [PMC free article] [PubMed] [Google Scholar]
- Teijaro JR, Turner D, Pham Q, Wherry EJ, Lefrancois L, Farber DL. Cutting edge: tissue-retentive lung memory CD4 T cells mediate optimal protection to respiratory virus infection. J Immunol. 2011;187:5510–5514. doi: 10.4049/jimmunol.1102243. [DOI] [PMC free article] [PubMed] [Google Scholar]
- Thom JT, Weber TC, Walton SM, Torti N, Oxenius A. The Salivary Gland Acts as a Sink for Tissue-Resident Memory CD8(+) T Cells, Facilitating Protection from Local Cytomegalovirus Infection. Cell Rep. 2015;13:1125–1136. doi: 10.1016/j.celrep.2015.09.082. [DOI] [PubMed] [Google Scholar]
- Thome JJ, Bickham KL, Ohmura Y, Kubota M, Matsuoka N, Gordon C, Granot T, Griesemer A, Lerner H, Kato T, et al. Early-life compartmentalization of human T cell differentiation and regulatory function in mucosal and lymphoid tissues. Nat Med. 2016a;22:72–77. doi: 10.1038/nm.4008. [DOI] [PMC free article] [PubMed] [Google Scholar]
- Thome JJ, Farber DL. Emerging concepts in tissue-resident T cells: lessons from humans. Trends Immunol. 2015;36:428–435. doi: 10.1016/j.it.2015.05.003. [DOI] [PMC free article] [PubMed] [Google Scholar]
- Thome JJ, Grinshpun B, Kumar BV, Kubota M, Ohmura Y, Lerner H, Sempowski GD, Shen Y, Farber DL. Longterm maintenance of human naive T cells through in situ homeostasis in lymphoid tissue sites. Sci Immunol. 2016b;1 doi: 10.1126/sciimmunol.aah6506. [DOI] [PMC free article] [PubMed] [Google Scholar]
- Thome JJC, Yudanin NA, Ohmura Y, Kubota M, Grinshpun B, Sathaliyawala T, Kato T, Lerner H, Shen Y, Farber DL. Spatial Map of Human T Cell Compartmentalization and Maintenance over Decades of Life. Cell. 2014;159:814–828. doi: 10.1016/j.cell.2014.10.026. [DOI] [PMC free article] [PubMed] [Google Scholar]
- Turner DL, Bickham KL, Thome JJ, Kim CY, D’Ovidio F, Wherry EJ, Farber DL. Lung niches for the generation and maintenance of tissue-resident memory T cells. Mucosal Immunol. 2014;7:501–510. doi: 10.1038/mi.2013.67. [DOI] [PMC free article] [PubMed] [Google Scholar]
- Ugur M, Schulz O, Menon MB, Krueger A, Pabst O. Resident CD4+ T cells accumulate in lymphoid organs after prolonged antigen exposure. Nat Commun. 2014;5:4821. doi: 10.1038/ncomms5821. [DOI] [PubMed] [Google Scholar]
- van der Matten L, Hinton G. Visulazing data using t-SNEJ. Mach Learn Res. 2008;9:2579–2605. [Google Scholar]
- Wakim LM, Woodward-Davis A, Liu R, Hu Y, Villadangos J, Smyth G, Bevan MJ. The molecular signature of tissue resident memory CD8 T cells isolated from the brain. J Immunol. 2012;189:3462–3471. doi: 10.4049/jimmunol.1201305. [DOI] [PMC free article] [PubMed] [Google Scholar]
- Watanabe R, Gehad A, Yang C, Scott LL, Teague JE, Schlapbach C, Elco CP, Huang V, Matos TR, Kupper TS, et al. Human skin is protected by four functionally and phenotypically discrete populations of resident and recirculating memory T cells. Sci Transl Med. 2015;7:279ra239. doi: 10.1126/scitranslmed.3010302. [DOI] [PMC free article] [PubMed] [Google Scholar]
- Wong MT, Ong DE, Lim FS, Teng KW, McGovern N, Narayanan S, Ho WQ, Cerny D, Tan HK, Anicete R, et al. A High-Dimensional Atlas of Human T Cell Diversity Reveals Tissue-Specific Trafficking and Cytokine Signatures. Immunity. 2016;45:442–456. doi: 10.1016/j.immuni.2016.07.007. [DOI] [PubMed] [Google Scholar]
- Woon HG, Braun A, Li J, Smith C, Edwards J, Sierro F, Feng CG, Khanna R, Elliot M, Bell A, et al. Compartmentalization of Total and Virus-Specific Tissue-Resident Memory CD8+ T Cells in Human Lymphoid Organs. PLoS Pathog. 2016;12:e1005799. doi: 10.1371/journal.ppat.1005799. [DOI] [PMC free article] [PubMed] [Google Scholar]
- Zens KD, Chen J-K, Farber DL. Vaccine-Generated Lung Tissue-Resident Memory T cells Provide Heterosubtypic Protection to Influenza Infection. J Clin Invest Insight. 2016;1:e85832. doi: 10.1172/jci.insight.85832. [DOI] [PMC free article] [PubMed] [Google Scholar]
Associated Data
This section collects any data citations, data availability statements, or supplementary materials included in this article.
Supplementary Materials
Table S6. Complete differential gene expression between CD69+ and CD69− memory T cell subsets from lung and spleen, Related to Figures 2 and 3. Differential gene expression was assessed using EdgeR and table shows differential expression of all genes measured in the indicated groups ranked by decreasing significance. Fold change shown is gene expression in CD69+ samples compared with CD69− samples. logFC: log 2 fold change, logCPM: log 2 counts per million. n=3 donors for each group.