Abstract
Diffuse large B-cell lymphoma (DLBCL), the most frequently occurring type of lymphoid malignancy, has been demonstrated to be associated with mutations of Ten-Eleven Translocation (TET). In order to explore the association between DLBCL and TET mutations, the present study analyzed the gene expression and methylation profiles in human DLBCL biopsy tissues with wildtype and mutated TET2. The microarray dataset GSE37365, containing two subseries: the genome-wide gene expression dataset GSE37362 and the DNA methylation microarray dataset GSE37363, was downloaded from the Gene Expression Omnibus database. Differentially expressed genes (DEGs) were identified using the limma package of R. Furthermore, differentially methylated sites and differentially methylated regions were identified. Gene Ontology (GO) and Kyoto Encyclopedia of Genes and Genomes (KEGG) pathway enrichment analyses were performed via GO stats and GSEABase packages respectively. Finally, the Pathview package was used to construct the network of enriched pathways. A total of 198 DEGs (106 up- and 92 downregulated) were obtained. A total of 602 shared differentially methylated genes (DMGs) were identified according to differentially methylated levels. A total of 12 overlapping genes were identified in DEGs and DMGs. It was observed that 9 of the 12 overlapped genes were downregulated and hypermethylated, with 24 GO terms and one KEGG pathway significantly enriched. The results of the present study demonstrated that the genes cryptochrome circadian clock 1, zinc finger protein (ZNF) interacting with K protein 1, ZNF134, ZNF256 and ZNF615, which were hypermethylated and downregulated in DLBCL patients with TET2 mutations, were the key genes in the association between DLBCL and TET mutations. These genes may act as potential biomarkers for the diagnosis of DLBCL in the future.
Keywords: differentially expressed genes, diffuse large B-cell lymphoma, methylation, Ten-Eleven Translocation
Introduction
Diffuse large B-cell lymphoma (DLBCL) is the most frequently occurring type of lymphoid malignancy in adults worldwide. It arises from normal antigen-exposed B cells which have migrated to germinal centers in secondary lymphoid organs (1). DLBCL is a clinically heterogeneous disease and ~40% of patients may be cured by anthracycline-based chemotherapy (2). Therefore, the early diagnosis and treatment of DLBCL is critical.
A previous study indicated that specific genetic and epigenetic cancer characteristics were detectable in the plasma, serum and tissue of patients, and these were able to be used for the early detection and diagnosis of cancer (3). Ten-Eleven Translocation (TET) hydroxylases are able to convert 5-methylcytosine to 5-hydroxymethylcytosine and induce DNA demethylation (4). The use of a mutation screening assay and the genome-wide profiling has verified that TET2 mutations may result in the aberrant methylation of various genes (5). Microarray technology has contributed to the development of life sciences, making it possible to obtain large quantities of genes, microRNAs, or DNA methylated sites for further analysis of cancer at the molecular level (6,7). In addition, combining microarray data and statistical methods may be used to detect influential genes in cancers (8). Although TET mutations were considered to be associated with DLBCL, the mechanism of DNA methylation in DLBCL remains to be elucidated. Novel diagnostic targets and treatment strategies for this disease are urgently required and of primary concern.
The present study compared the data from the DNA methylation and gene expression profiles in TET2 mutated samples, with TET2 wild-type samples, and differentially expressed genes (DEGs) and differentially methylated regions (DMRs) were identified. Following this, functional and pathway analyses were conducted and various key genes and pathways associated with DLBCL and TET2 mutations were identified.
Materials and methods
Microarray data
The gene expression profile of GSE37365 was downloaded from the Gene Expression Omnibus (GEO) database (www.ncbi.nlm.nih.gov/geo/) and deposited by Asmar et al (5). It contained two subseries: the genome-wide gene expression dataset GSE37362 and the DNA methylation microarray dataset GSE37363. In GSE37362, there were 12 human DLBCL biopsy tissues with TET2 mutations and 19 TET2 wild-type DLBCL biopsy tissues, and the dataset was performed on the Illumina HumanMethylation450 BeadChip (GPL13534) platform (Illumina, San Diego, CA, USA). The gene expression dataset (GSE37363) contained 4 human DLBCL biopsy tissues with TET2 mutations and 5 TET2 wild-type DLBCL biopsy tissues and was detected with Affymetrix Human Gene 1.0 ST Array (GPL6244) platform (Affymetrix, Inc., Santa Clara, CA, USA).
Data preprocessing
The original CEL gene microarray data were imported into R and the Affy package (http://bioconductor.org/packages/release/bioc/html/affy.html) was used for the background correction and robust multi array normalization (9). The probe-level symbols were converted into gene-level symbols. If multiple probes corresponded to one gene symbol, the average expression value of all probes was defined as the gene expression value. For the DNA methylation dataset, the IMA package (https://www.rforge.net/IMA) of R was used to normalize the methylation level in each methylation site. The methylation sites located in the X and Y chromosomes or SNPs were removed. P-value <0.05 was set as the cut-off criterion for the DNA-methylation matrix.
Differential expression analysis
DEGs were identified by the limma package (http://bioconductor.org/packages/release/bioc/html/limma.html) (10) of R in TET2 mutated DLBCL samples compared with wild-type samples, according to the thresholds of Benjamini-Hochberg (BH) adjusted P-value <0.05 and |log2 (fold change)| >1. A total of 3 differentially methylated levels were identified. The first one was obtained by the P-value of a Student's t-test (P<0.05) in R (www.r-project.org) and the β value of the DNA methylation site in TET2 mutated samples compared with wild-type samples. The second one was determined by the gene regions, including the first exon area (EXON1), 1–200 bp upstream of the transcription start site (TSS200), 1–1500 bp upstream of the transcription start site (TSS1500), 3′-untranslated region (UTR) and 5′UTR. The third one was calculated by the locational data involving the CpG island, 1–200 bp upstream of the CpG island (N-CPGshore), 200–400 bp upstream of the CpG island (N-CPGshelf), 1–200 bp downstream of the CpG island (S-CPGshore) and 200–400 bp downstream of the CpG island (S-CPGshelf). Finally, with |∆β| >0.1 and P-value <0.05, the differentially methylated sites (DMSs) and DMRs were selected out in TET2 mutated samples and compared with wild-type samples.
The DMSs and DMRs were transformed to target genes termed differentially methylated genes (DMGs) using the annotation information, and the overlapping genes between the identified DMGs and DEGs were obtained.
Functional enrichment analysis
The biological process (BP) of Gene Ontology (GO) terms and Kyoto Encyclopedia of Genes and Genomes (KEGG) pathways for the aforementioned screened genes were identified using GOstats (http://www.bioconductor.org/packages/release/bioc/html/GOstats.html) (11) and GSEABase packages (http://www.bioconductor.org/packages/release/bioc/html/GSEABase.html) (12), respectively. The adjusted P-value <0.01 was selected as the cut-off criterion. The network of enriched pathways was constructed using the Pathview package (http://www.bioconductor.org/packages/release/bioc/html/pathview.html) (13).
Results
Screening of DEGs and DMGs
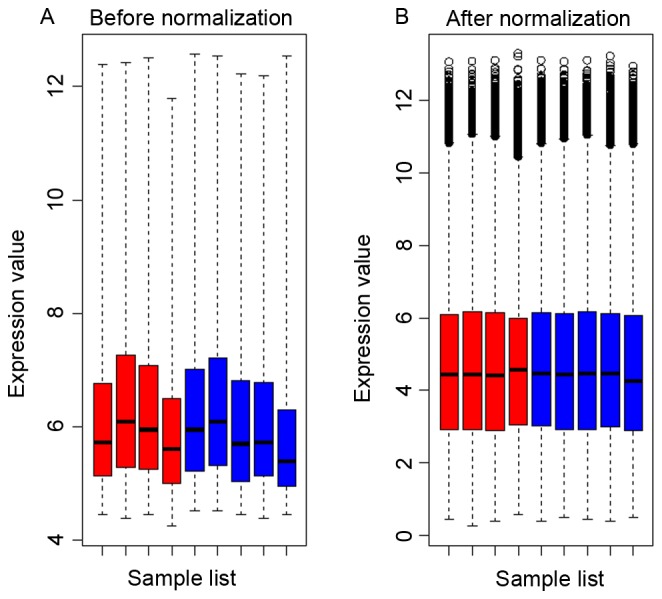
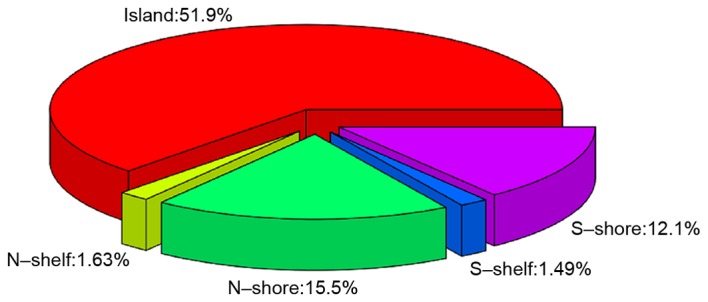
The raw data were normalized in all samples and are presented in Fig. 1. A total of 198 DEGs (106 up- and 92 downregulated) were identified in TET2 mutated DLBCL samples compared with wild-type samples and the top 30 DEGs are listed in Table I. A total of 10493 DMSs, distributed over 3768 genes with |∆β| >0.1 and P-value <0.05 (group 1) were screened. A total of 1411 non-redundant genes (group 2) were selected from the DMRs (Fig. 2). As presented, the majority of DMRs were located in the gene body accounting for 26.5%, followed by TSS1500 with 20.2%. A further 1670 non-redundant genes (group 3) were identified by their location, of which 51.9% genes were located in CpG islands, 15.5% in N-shore, 12.1% in S-shore, 1.63% in N-shelf and 1.49% in S-shelf (Fig. 3). The results revealed that 602 DMGs were shared among the three groups. In addition, 12 overlapping genes, cryptochrome circadian clock (CRY)1, cytochrome B5 reductase (CYB5R) 2, doublecortin like kinase (DCLK) 2, fibronectin 1, glutathione peroxidase 3, short chain dehydrogenase/reductase family 42E, member 1 (SDR42E1), secreted frizzled related protein 2, spi-B transcription factor (SPIB), zinc finger protein (ZNF) interacting with K protein (ZIK) 1, ZNF134, ZNF256 and ZNF615 were identified in the 198 DEGs and 602 DMGs.
Figure 1.

Boxplots for microarrays (A) prior to and (B) following application of normalization. Red boxes represent TET mutated diffuse large B-cell lymphoma samples. Blue boxes represent TET2 wild-type samples. TET, Ten-Eleven Translocation hydroxylases.
Table I.
The top 30 DEGs in TET2 mutated DLBCL samples compared with wild-type samples.
| Gene | LogFC | P-value |
|---|---|---|
| ZIK1 | −1.00204 | 5.43×10⁻⁵ |
| SLC9A7 | −2.12435 | 8.30×10⁻⁵ |
| FAM129C | −1.78254 | 0.000152 |
| VCAN | 1.888421 | 0.000272 |
| ZNF256 | −2.00847 | 0.00029 |
| ZNF542P | −1.48907 | 0.000365 |
| RNU2-6P | −2.03556 | 0.00037 |
| KIAA0226L | −3.08868 | 0.000435 |
| VDR | 1.206615 | 0.000439 |
| IFT57 | −1.36341 | 0.00056 |
| APOBEC3B | 2.477052 | 0.000594 |
| ZNF667-AS1 | −2.00769 | 0.000808 |
| SERPINB9 | 1.405557 | 0.001202 |
| SDR42E1 | −1.28485 | 0.001228 |
| BCL2 | −1.23809 | 0.001266 |
| KCNN3 | 1.915499 | 0.001271 |
| ZNF350 | −1.70697 | 0.001372 |
| PRRG4 | 1.080011 | 0.001556 |
| SLC7A11 | 2.276444 | 0.001604 |
| CEP68 | −1.00705 | 0.001643 |
| SPP1 | 3.186619 | 0.001661 |
| ZNF382 | −1.46886 | 0.00197 |
| EMP1 | 1.098811 | 0.001994 |
| PLA2G2A | 1.148008 | 0.002013 |
| GPR183 | −2.03511 | 0.002126 |
| PDGFRA | 2.247303 | 0.002385 |
| CHPF | 1.078177 | 0.002536 |
| CRY1 | −1.08059 | 0.00269 |
| LZTFL1 | −1.77782 | 0.002797 |
| AKT3 | −1.13853 | 0.002883 |
DEGs, differentially expressed genes; TET, Ten-Eleven Translocation; DLBCL, diffuse large B-cell lymphoma; LogFC, log (fold change).
Figure 2.

The distributions of differentially methylated genes based on the genetic regions. UTR, untranslated region; TSS, transcription start site.
Figure 3.

The distributions of differentially methylated genes based on the locations of CpG islands.
Enriched GO terms and KEGG pathways of key target genes
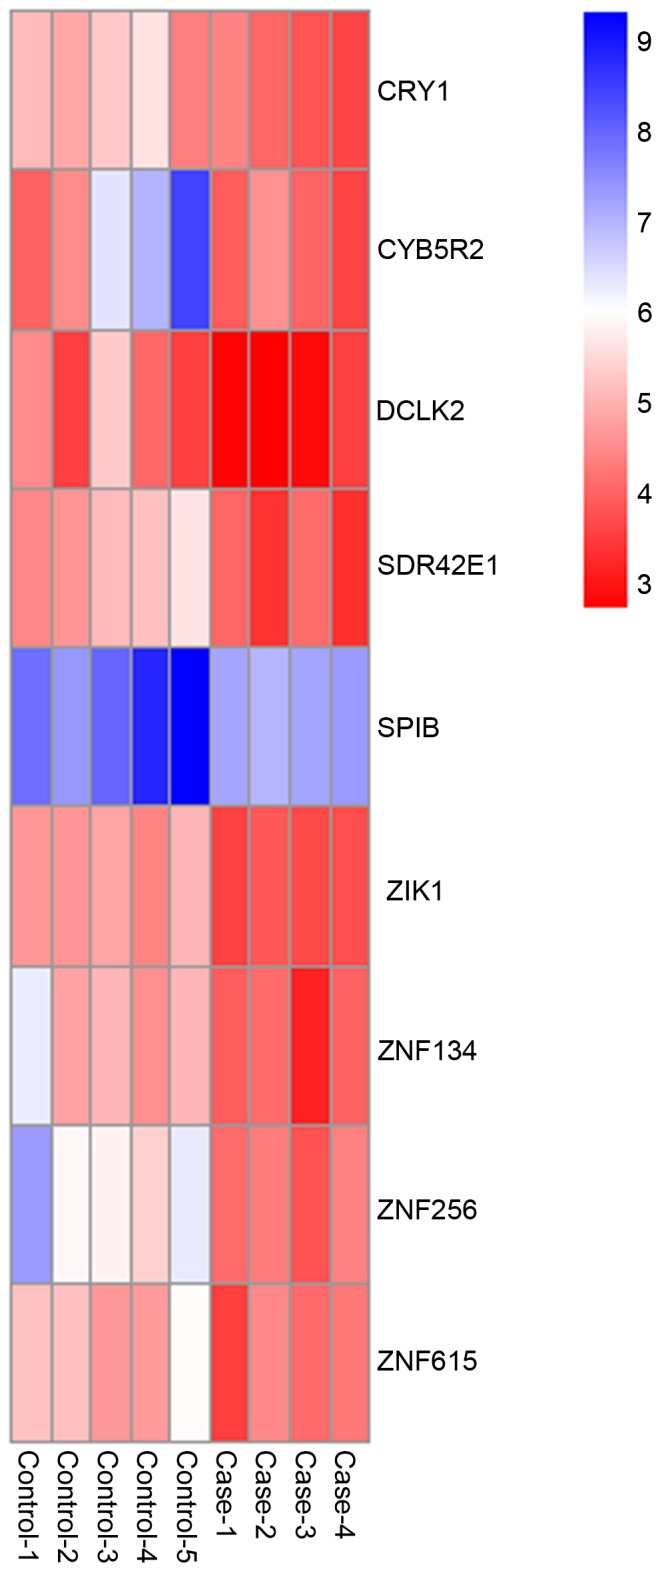
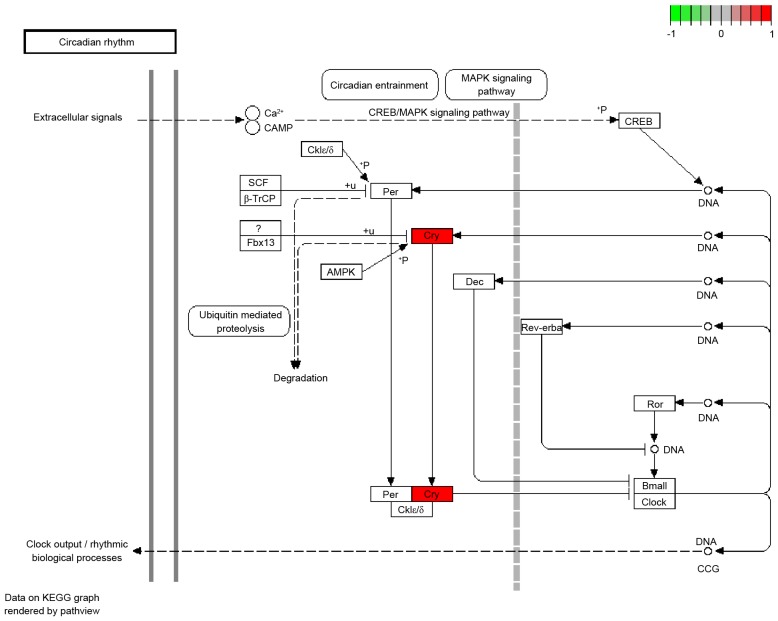
It was demonstrated that 9 of the 12 overlapped genes were downregulated and hypermethylated, including CRY1, CYB5R2, DCLK2, SDR42E1, SPIB, ZIK1, ZNF134, ZNF256 and ZNF615. The heatmap of these 9 genes is presented in Fig. 4. Furthermore, using the cut-off criterion of P-value <0.01, 24 BPs of GO terms were obtained, including organic cyclic compound biosynthetic process (P=0.000131518), blue light signaling pathway (P=0.001212284) and cellular response to blue light (P=0.001212284; Table II). A significant KEGG pathway associated with circadian rhythm was obtained (Fig. 5).
Figure 4.

Hierarchical clustering heatmap of CRY1, CYB5R2, DCLK2, SDR42E1, SPIB, ZIK1, ZNF134, ZNF256 and ZNF615. Each column corresponds to a single microarray and each row represents expression profile of a single gene. Red and blue represent the low and high values of the gene expression, respectively. Case-1, 2, 3, 4 represent human DLBCL biopsy tissue samples with TET mutations and control-1, 2, 3, 4, 5, represent TET2 wild-type DLBCL biopsy tissue samples. DLBCL, diffuse large B-cell lymphoma; TET, Ten-Eleven Translocation hydroxylases; CRY1 cryptochrome circadian clock 1; CYB5R2, cytochrome B5 reductase 2; DCLK2, doublecortin like kinase; SDR42E1, short chain dehydrogenase/reductase family 42E, member 1; SPIB, spi-B transcription factor; ZNF, zinc finger protein; ZIK1, ZNF interacting with K protein.
Table II.
Significant 24 GO terms for screened genes.
| GO term | Description | P-value | Genes |
|---|---|---|---|
| GO:1901362 | Organic cyclic compound biosynthetic process | 0.000131518 | CRY1, SPIB, ZNF134, ZNF256, CYB5R2, SDR42E1, ZIK1, ZNF615 |
| GO:0009785 | Blue light signaling pathway | 0.001212284 | CRY1 |
| GO:0071483 | Cellular response to blue light | 0.001212284 | CRY1 |
| GO:1901576 | Organic substance biosynthetic process | 0.001486849 | CRY1, SPIB, ZNF134, ZNF256, CYB5R2, SDR42E1, ZIK1, ZNF615 |
| GO:0009058 | Biosynthetic process | 0.00165506 | CRY1, SPIB, ZNF134, ZNF256, CYB5R2, SDR42E1, ZIK1, ZNF615 |
| GO:0009637 | Response to blue light | 0.001817937 | CRY1 |
| GO:1901360 | Organic cyclic compound metabolic process | 0.00276577 | CRY1, SPIB, ZNF134, ZNF256, CYB5R2, SDR42E1, ZIK1, ZNF615 |
| GO:0006355 | Regulation of transcription, DNA-dependent | 0.002884379 | CRY1, SPIB, ZNF134, ZNF256, ZIK1, ZNF615 |
| GO:2001141 | Regulation of RNA biosynthetic process | 0.002991969 | CRY1, SPIB, ZNF134, ZNF256, ZIK1, ZNF615 |
| GO:0006694 | Steroid biosynthetic process | 0.003173823 | CYB5R2, SDR42E1 |
| GO:0051252 | Regulation of RNA metabolic process | 0.003375671 | CRY1, SPIB, ZNF134, ZNF256, ZIK1, ZNF615 |
| GO:2000112 | Regulation of cellular macromolecule biosynthetic process | 0.004585358 | CRY1, SPIB, ZNF134, ZNF256, ZIK1, ZNF615 |
| GO:0006351 | Transcription, DNA-dependent | 0.004971651 | CRY1, SPIB, ZNF134, ZNF256, ZIK1, ZNF615 |
| GO:0010556 | Regulation of macromolecule biosynthetic process | 0.005245834 | CRY1, SPIB, ZNF134, ZNF256, ZIK1, ZNF615 |
| GO:0032774 | RNA biosynthetic process | 0.005738022 | CRY1, SPIB, ZNF134, ZNF256, ZIK1, ZNF615 |
| GO:0031326 | Rregulation of cellular biosynthetic process | 0.006573337 | CRY1, SPIB, ZNF134, ZNF256, ZIK1, |
| GO:0009889 | Regulation of biosynthetic process | 0.006882303 | CRY1, SPIB, ZNF134, ZNF256, ZIK1, ZNF615 |
| GO:0010468 | Regulation of gene expression | 0.006955993 | CRY1, SPIB, ZNF134, ZNF256, ZIK1, ZNF615 |
| GO:0019219 | Regulation of nucleobase-containing compound metabolic process | 0.007355736 | CRY1, SPIB, ZNF134, ZNF256, ZIK1, ZNF615 |
| GO:0018298 | Protein-chromophore linkage | 0.007856527 | CRY1 |
| GO:0051171 | Regulation of nitrogen compound metabolic process | 0.008353762 | CRY1, SPIB, ZNF134, ZNF256, ZIK1, ZNF615 |
| GO:0034654 | Nucleobase-containing compound biosynthetic process | 0.008928906 | CRY1, SPIB, ZNF134, ZNF256, ZIK1, ZNF615 |
| GO:0018130 | Heterocycle biosynthetic process | 0.009820777 | CRY1, SPIB, ZNF134, ZNF256, ZIK1, ZNF615 |
| GO:0019438 | Aromatic compound biosynthetic process | 0.009834588 | CRY1, SPIB, ZNF134, ZNF256, ZIK1, ZNF615 |
GO, Gene Ontology.
Figure 5.
Pathway of circadian rhythm. The red gene is the significant gene involved in the pathway. CRY1 cryptochrome circadian clock 1; KEGG, kyoto encyclopedia of genes and genomes; CREB1, CAMP responsive element binding protein 1; MAPK, mitogen activated protein kinase; Fbx 13, F-box 13; Ror, RAR related orphan receptor; PER, period circadian clock; Cklε, casein kinase 1 ε; Cklδ, casein kinase 1δ; SCF, Skp1-Cul1-F-box protein; β-TrCP, β-transducin repeat containing E3 ubiquitin protein ligase.
Discussion
TET2, one of the three proteins of the TET family, catalyzes the conversion of 5-methyl-cytosine to 5-hydroxymethyl-cytosine and promotes DNA demethylation (14). The present study, by using the data reported by Asmar et al (5), analyzed the DNA methylation and gene expression profiles in TET2 mutated samples compared with wild-type samples.
DNA methylation is one of the most common epigenetic modifications which may regulate gene expression in mammalian cells (15). Abnormal DNA methylation may lead to tumor formation and development (16,17). DLBCL represents the most frequently occurring B-cell malignancy with a high mortality rate, with a rapid progression and fatal outcome (18). It has previously been demonstrated that abnormal DNA methylation is associated with the pathogenesis and development of DLBCL. Shaknovich et al (19) reported that methylation of Src homology region 2 domain-containing phosphatase (SHP) 1 is frequently detected in plasma and tissues of DLBCL patients and therefore methylation of SHP1 may serve as a candidate biomarker for DLBCL. Additionally, TET mutations are typically observed in early hematopoietic progenitors (20) and it was hypothesized that they resulted in gene aberrant methylation in hematopoietic development (5). In the present study, 198 DEGs and 602 DMGs were identified and 9 genes CRY1, CYB5R2, DCLK2, SDR42E1, SPIB, ZIK1, ZNF134, ZNF256 and ZNF615 were revealed to be downregulated and hypermethylated in the TET2 mutated DLBCL samples compared with wild-type samples. The results demonstrated that CRY1, a gene associated with the circadian system (21), was significantly enriched in the circadian rhythm pathway. CRY1 and CRY2, interact with the period circadian clock (PER) proteins, and have a role in the negative limbs of the clock feedback loop (22). Circadian rhythms control a variety of metabolic and physiological functions, and abnormal circadian rhythms may be directly associated with the development of cancer (23). A previous study demonstrated that the downregulated clock gene PER2 in DLBCL patients was targeted by the transcription factor (CCAAT/enhancer-binding protein α and PER2 may act as a tumor suppressor gene (24). In addition, the epigenetic inactivation of aryl hydrocarbon receptor nuclear translocator-like protein (BMAL) 1, another circadian clock gene, has been revealed to contribute to the development of hematologic malignancies (25). Furthermore, CRY1 may modulate the ATR-mediated DNA damage checkpoint response by interacting with the timeless gene (26). The role of CRY1 as a key gene in the association between DLBCL and TET mutations has previously been investigated.
Furthermore, it was noted that ~50% of the aforementioned 9 genes encoded zinc finger proteins, including ZIK1, ZNF134, ZNF256 and ZNF615. Consistent with Asmar et al (5), ZIK1 was hypermethylated and downregulated in the results of the present study. Numerous studies have reported an association between zinc finger proteins and lymphoma or lymphatic disease. Bond et al (27) suggests that early hematopoietic zinc finger proteins are important in the regulation of human hematopoiesis and may be associated with the development of hematopoietic malignancies. Möröy et al (28) suggests that zinc finger protein growth factor independent 1 transcriptional repressor may maintain development and progression of lymphoid leukemia by suppressing the activation of the tumor suppressor p53. This suggests that different zinc finger proteins serve different roles in various types of cancer. Therefore, it was hypothesized that ZIK1, ZNF134, ZNF256 and ZNF615 may be involved in the development of DLBCL with TET2 mutations. Further validation of these genes is required.
In conclusion, the results of the present study suggested that the genes which were hypermethylated and downregulated in DLBCL biopsy tissues with TET2 mutations, exhibited important roles in the development of DLBCL. These genes, including CRY1, ZIK1, ZNF134, ZNF256 and ZNF615, may be affected by TET mutations and may act as potential biomarkers for the early diagnosis, therapy and prognosis of DLBCL. However, further experiments are required in order to validate the specific function of these genes in DLBCL.
Acknowledgements
The present study was supported by the Municipal Science and Technology Commission of Tianjin (grant nos. 15ZLZLZF00440 and 16ZLZXZF00120), the Health Bureau Science and Technology Foundation of Tianjin (grant no. 2014KZ102) and the National Natural Science Foundation of China (grant nos. 81302082, 81272685, 31301151 and 81172355).
References
- 1.Monti S, Savage KJ, Kutok JL, Feuerhake F, Kurtin P, Mihm M, Wu B, Pasqualucci L, Neuberg D, Aguiar RC, et al. Molecular profiling of diffuse large B-cell lymphoma identifies robust subtypes including one characterized by host inflammatory response. Blood. 2005;105:1851–1861. doi: 10.1182/blood-2004-07-2947. [DOI] [PubMed] [Google Scholar]
- 2.Coiffier B. Diffuse large cell lymphoma. Curr Opin Oncol. 2001;13:325–334. doi: 10.1097/00001622-200109000-00003. [DOI] [PubMed] [Google Scholar]
- 3.Tsang JC, Lo YM. Circulating nucleic acids in plasma/serum. Pathology. 2007;39:197–207. doi: 10.1080/00313020701230831. [DOI] [PubMed] [Google Scholar]
- 4.Tahiliani M, Koh KP, Shen Y, Pastor WA, Bandukwala H, Brudno Y, Agarwal S, Iyer LM, Liu DR, Aravind L, Rao A. Conversion of 5-methylcytosine to 5-hydroxymethylcytosine in mammalian DNA by MLL partner TET1. Science. 2009;324:930–935. doi: 10.1126/science.1170116. [DOI] [PMC free article] [PubMed] [Google Scholar]
- 5.Asmar F, Punj V, Christensen J, Pedersen MT, Pedersen A, Nielsen AB, Hother C, Ralfkiaer U, Brown P, Ralfkiaer E, et al. Genome-wide profiling identifies a DNA methylation signature that associates with TET2 mutations in diffuse large B-cell lymphoma. Haematologica. 2013;98:1912–1920. doi: 10.3324/haematol.2013.088740. [DOI] [PMC free article] [PubMed] [Google Scholar]
- 6.Schumacher A, Kapranov P, Kaminsky Z, Flanagan J, Assadzadeh A, Yau P, Virtanen C, Winegarden N, Cheng J, Gingeras T, Petronis A. Microarray-based DNA methylation profiling: Technology and applications. Nucleic Acids Res. 2006;34:528–542. doi: 10.1093/nar/gkj461. [DOI] [PMC free article] [PubMed] [Google Scholar]
- 7.Sato F, Tsuchiya S, Terasawa K, Tsujimoto G. Intra-platform repeatability and inter-platform comparability of MicroRNA microarray technology. PLoS One. 2009;4:e5540. doi: 10.1371/journal.pone.0005540. [DOI] [PMC free article] [PubMed] [Google Scholar]
- 8.Khoshhali M, Mahjub H, Saidijam M, Poorolajal J, Soltanian AR. Predicting the survival time for diffuse large B-cell lymphoma using microarray data. J Mol Genet Med. 2012;6:287–292. doi: 10.4172/1747-0862.1000051. [DOI] [PMC free article] [PubMed] [Google Scholar]
- 9.Irizarry RA, Hobbs B, Collin F, Beazer-Barclay YD, Antonellis KJ, Scherf U, Speed TP. Exploration, normalization, and summaries of high density oligonucleotide array probe level data. Biostatistics. 2003;4:249–264. doi: 10.1093/biostatistics/4.2.249. [DOI] [PubMed] [Google Scholar]
- 10.da Huang W, Sherman BT, Lempicki RA. Bioinformatics enrichment tools: Paths toward the comprehensive functional analysis of large gene lists. Nucleic Acids Res. 2009;37:1–13. doi: 10.1093/nar/gkn923. [DOI] [PMC free article] [PubMed] [Google Scholar]
- 11.Falcon S, Gentleman R. Using GOstats to test gene lists for GO term association. Bioinformatics. 2007;23:257–258. doi: 10.1093/bioinformatics/btl567. [DOI] [PubMed] [Google Scholar]
- 12.Merico D, Isserlin R, Stueker O, Emili A, Bader GD. Enrichment map: A network-based method for gene-set enrichment visualization and interpretation. PLoS One. 2010;5:e13984. doi: 10.1371/journal.pone.0013984. [DOI] [PMC free article] [PubMed] [Google Scholar]
- 13.Luo W, Brouwer C. Pathview: An R/Bioconductor package for pathway-based data integration and visualization. Bioinformatics. 2013;29:1830–1831. doi: 10.1093/bioinformatics/btt285. [DOI] [PMC free article] [PubMed] [Google Scholar]
- 14.Solary E, Bernard OA, Tefferi A, Fuks F, Vainchenker W. The ten-eleven translocation-2 (TET2) gene in hematopoiesis and hematopoietic diseases. Leukemia. 2014;28:485–496. doi: 10.1038/leu.2013.337. [DOI] [PubMed] [Google Scholar]
- 15.Otto SP, Walbot V. DNA methylation in eukaryotes: Kinetics of demethylation and de novo methylation during the life cycle. Genetics. 1990;124:429–437. doi: 10.1093/genetics/124.2.429. [DOI] [PMC free article] [PubMed] [Google Scholar]
- 16.Robertson KD. DNA methylation, methyltransferases, and cancer. Oncogene. 2001;20:3139–3155. doi: 10.1038/sj.onc.1204341. [DOI] [PubMed] [Google Scholar]
- 17.Jones PA, Baylin SB. The fundamental role of epigenetic events in cancer. Nat Rev Genet. 2002;3:415–428. doi: 10.1038/nrg816. [DOI] [PubMed] [Google Scholar]
- 18.Pasqualucci L, Trifonov V, Fabbri G, Ma J, Rossi D, Chiarenza A, Wells VA, Grunn A, Messina M, Elliot O, et al. Analysis of the coding genome of diffuse large B-cell lymphoma. Nat Genet. 2011;43:830–837. doi: 10.1038/ng.892. [DOI] [PMC free article] [PubMed] [Google Scholar]
- 19.Shaknovich R, Geng H, Johnson NA, Tsikitas L, Cerchietti L, Greally JM, Gascoyne RD, Elemento O, Melnick A. DNA methylation signatures define molecular subtypes of diffuse large B-cell lymphoma. Blood. 2010;116:e81–e89. doi: 10.1182/blood-2010-05-285320. [DOI] [PMC free article] [PubMed] [Google Scholar]
- 20.Quivoron C, Couronné L, Della Valle V, Lopez CK, Plo I, Wagner-Ballon O, Do Cruzeiro M, Delhommeau F, Arnulf B, Stern MH, et al. TET2 inactivation results in pleiotropic hematopoietic abnormalities in mouse and is a recurrent event during human lymphomagenesis. Cancer Cell. 2011;20:25–38. doi: 10.1016/j.ccr.2011.08.006. [DOI] [PubMed] [Google Scholar]
- 21.Ko CH, Takahashi JS. Molecular components of the mammalian circadian clock. Hum Mol Genet 15 Spec No. 2006;2:R271–R277. doi: 10.1093/hmg/ddl207. [DOI] [PubMed] [Google Scholar]
- 22.Kume K, Zylka MJ, Sriram S, Shearman LP, Weaver DR, Jin X, Maywood ES, Hastings MH, Reppert SM. mCRY1 and mCRY2 are essential components of the negative limb of the circadian clock feedback loop. Cell. 1999;98:193–205. doi: 10.1016/S0092-8674(00)81014-4. [DOI] [PubMed] [Google Scholar]
- 23.Sahar S, Sassone-Corsi P. Metabolism and cancer: The circadian clock connection. Nat Rev Cancer. 2009;9:886–896. doi: 10.1038/nrc2747. [DOI] [PubMed] [Google Scholar]
- 24.Thoennissen NH, Thoennissen GB, Abbassi S, Nabavi-Nouis S, Sauer T, Doan NB, Gery S, Müller-Tidow C, Said JW, Koeffler HP. Transcription factor CCAAT/enhancer-binding protein alpha and critical circadian clock downstream target gene PER2 are highly deregulated in diffuse large B-cell lymphoma. Leuk Lymphoma. 2012;53:1577–1585. doi: 10.3109/10428194.2012.658792. [DOI] [PMC free article] [PubMed] [Google Scholar]
- 25.Taniguchi H, Fernández AF, Setién F, Ropero S, Ballestar E, Villanueva A, Yamamoto H, Imai K, Shinomura Y, Esteller M. Epigenetic inactivation of the circadian clock gene BMAL1 in hematologic malignancies. Cancer Res. 2009;69:8447–8454. doi: 10.1158/0008-5472.CAN-09-0551. [DOI] [PubMed] [Google Scholar]
- 26.Kang TH, Leem SH. Modulation of ATR-mediated DNA damage checkpoint response by cryptochrome 1. Nucleic Acids Res. 2014;42:4427–4434. doi: 10.1093/nar/gku094. [DOI] [PMC free article] [PubMed] [Google Scholar]
- 27.Bond HM, Mesuraca M, Carbone E, Bonelli P, Agosti V, Amodio N, De Rosa G, Di Nicola M, Gianni AM, Moore MA, et al. Early hematopoietic zinc finger protein (EHZF), the human homolog to mouse Evi3, is highly expressed in primitive human hematopoietic cells. Blood. 2004;103:2062–2070. doi: 10.1182/blood-2003-07-2388. [DOI] [PubMed] [Google Scholar]
- 28.Möröy T. The zinc finger protein Gfi1 maintains development and progression of lymphoid leukemia by blocking the activation of the tumor suppressor p53. Experimental Hematol. 2014;42(Suppl):S7. doi: 10.1016/j.exphem.2014.07.024. [DOI] [Google Scholar]


