

Abstract
Bone marrow-derived mesenchymal stem cells (BMSCs) and adipose tissue-derived mesenchymal stem cells (ADSCs) are able to differentiate into neuron-like cells when exposed to small molecule compounds, however the specific differences in their neuronal differentiation abilities remain to be fully elucidated. The present study aimed to compare the neuronal differentiation abilities of BMSCs and ADSCs. BMSCs and ADSCs from the same Sprague Dawley rats were isolated and cultured for use. The proliferation capacity was revealed using a cell counting method. Following BMSCs and ADSCs induction by four types of small-molecular compounds, the expression of various neuronal markers and the secretion of several neurotrophic factors were detected by immunofluorescence, western blotting, reverse transcription-quantitative polymerase chain reaction and ELISA. It was demonstrated that the ADSCs exhibited an increased proliferation capacity compared with BMSCs, according to cumulative population doubling analyses. Following a 7-day neuronal induction period, BMSCs and ADSCs exhibited a neuron-like morphology, and were termed neuronal induced (NI)-BMSCs and NI-ADSCs. They expressed neuronal markers including β-tubulin III, microtubule associated protein 2 and choline acetyltransferase. The number of NI-BMSCs that positively expressed the neuronal markers was significantly decreased compared with NI-ADSCs, and the expression and secretion of the neurotrophic factors nerve growth factor and 3′-nucleotidase in NI-BMSCs were additionally decreased compared with NI-ADSCs. The findings of the present study indicated that the neuronal differentiation abilities and neurotrophic factor secretion abilities of ADSCs were increased compared with BMSCs. ADSCs may therefore act as efficient candidates in cell transplantation therapy for diseases and injuries of the nervous system.
Keywords: bone marrow, adipose tissue, mesenchymal stem cells, neuronal differentiation neuron-like cells
Introduction
Treatment of nervous system diseases and injuries remains a clinical challenge, because neurons, terminally differentiated cells, can hardly regenerate once damaged. So seeking for suitable cells to replace damaged neurons has long been a hot research topic in cell therapy field (1,2). Mesenchymal stem cells (MSCs) have been generally considered a viable source for cell therapy due to their self-renewal and multiple differentiation capabilities, as well as their easy availability from various sources including the marrow, adipose tissue, cord blood and other adult tissues (3,4). As BMSCs can proliferate rapidly and differentiate into neuron-like cells under certain conditions, continuous attention has been paid to their potential application to the treatment of nerve injuries and degeneration (5,6). However, the differentiation potential, available quantity and the duration of BMSCs has been weakened with aging (7,8), while ADSCs are less affected by aging. In addition, an individual has abundant adipose tissues separated easily without causing significant injuries (9,10). Given the same mass, more cells could be obtained from the adipose tissue than those from the bone marrow (11). ADSCs differ insignificantly from BMSCs in morphology and phenotypic characteristics (12,13), but their differences in neuronal differentiation ability under the same circumstance remain unknown and need to be further explored.
Knowing that BMSCs can promote functional recovery and protect neurons by secreting neurotrophic factors in nervous system (6), the ability of BMSCs in secreting neurotrophic factors in vitro can reflect their therapeutic ability in vivo to some extent. The aim of the present study was to investigate whether ADSCs and BMSCs have the same ability to secrete neurotrophic factors, and whether these neurotrophic factors undergo any significant changes during neuronal induction.
There are controversies over the selection of the neuronal differentiation methods. For instance, neuron-like cells induced by some methods only expressed immature rather than mature neuronal markers (5,11,14,15). In addition, some studies (12,16–18) reported that induced cells differed greatly from neuronsin morphology and no electrophysiological characteristics of neurons. However, cells induced by our group method, showed neuron-like morphology and expressed mature neuronal marker MAP2 (19,20). In addition, it exhibited electrophysiological characteristics of neurons and expressed the sodium and potassium channels. When they were transplanted into the injured sciatic nerves of the rats, there presented an obvious effect on recovering the nerve function.
Currently, cell proliferation ability, differentiation ability into neuron-like cells, expression and secretion of neurotrophic factors in BMSCs and ADSCs have been compared in the present study.
Materials and methods
Animals
Male SD rats aged 3 weeks and weighing 40–50 g were obtained from the Animal Center of the Second Military Medical University (Shanghai, China). All animal care and experimental procedures were approved by the Animal Research Ethics Committee of the Second Military Medical University, Shanghai, China (permit no. SYXK-2002-042).
Isolation and culture of BMSCs
Bone marrow was harvested from the bilateral femurs and tibias by cutting off both ends. The marrow cavity was flushed with 10 ml Dulbecco's modified Eagle's medium/nutrient mixture F-12 (DMEM/F12, Gibco, Grand Island, NY, USA). The flushing fluid was collected and centrifuged at 230 × g (Becman Allegra X-12 Centrifuge, Becman Coulter, Inc., Brea, CA, USA). Cells were placed in a 25-cm2 flask at a concentration of 2×10⁴ cells/cm2 in a Growth Medium for SD rat BMSCs (Cyagen, Guangzhou, China), and then incubated in the humidified atmosphere with 5% CO2 at 37°C. After 24 h incubation, the medium was replaced, and nonadherent cells were removed. Cells of passages 2–4 were used for all experiments.
Isolation and culture of ADSCs
ADSCs were obtained from the same animals used for isolating BMSCs. Adipose tissue was harvested from inguinal adipose tissues, cut into about 1×1×1 mm3 small pieces with a sterile blade and digested in 0.15% type I collagenase (Sigma, St. Louis, MO, USA) under 37°C for 60 min. Cells were suspended in Growth Medium for SD rat ADSCs (Cyagen, Guangzhou, China), seeded into the 25-cm2 flask at a concentration of 2×10⁴ cells/cm2, and finally cultured in a 5% CO2 incubator under 37°C. Cells of passages 2–4 were used for all experiments.
Flow cytometry analysis
Passage 4 BMSCs and ADSCs were digested by digestive enzyme (Tryple Express; Gibco), re-suspended in phosphate-buffered saline (PBS) supplemented with 5% fetal bovine serum (FBS; Gibco) and incubated in FITC-marked anti-rat monoclonal antibody CD34, CD4, CD29 and CD90 (1:200; Abcam, Cambridge, UK) at room temperature for 1 h. Analysis was performed with FACSCalibur (BD Biosciences, San Diego, CA, USA).
Cell proliferation assay
Passage 4 BMSCs and ADSCs were digested into single-cell suspension, and then plated into 24-well culture plates with 8 wells per plate: 4 wells for BMSCs and 4 wells for ADSCs at a concentration 1×10⁴ cells/well. The number of cells in each well was counted every other day usingCountstar automated cell counter IC 1000 (Inno-Alliance Biotech, USA). The mean values were used to map the growth curve diagram.
Neuronal induction
Neuronal induction was performed by the method described before (20). Briefly, an appropriate amount of passage 4 BMSCs and ADSCs were digested by digestive enzyme (Tryple Express, Gibco) and plated at 8.5×10³ cells/cm2 in 6-well plates or 24-well plates coated by poly-L-ornithine/laminin (Gibco, USA). Then neuronal induction medium, consisting of DMEM/F12, 0.5% FBS, 1% penicillin/streptomycin (Gibco), 1% glutamin, 1% N2, 20 ng/ml basic fibroblast growth factor (bFGF; all Gibco), 200 nM trichostatin A (TSA, histone deacetylases inhibitor; Sigma), 10 µM RG-108 (DNA methyltransferase inhibitor, Santa Cruz, USA), 10 µM 8-BrcAMP (highly stable, biologically active form of cAMP; Sigma) and 1 µM Rolipram (phosphodiesterases inhibitor; Sigma) was added. Half of the medium was replaced every other day. Related markers of neuronal differentiation were detected at day 1, 3 and 7.
Immunofluorescence
Cells in the 24-well plate were fixed by acetone at 4°C for 10 min, flushed with PBS for three times, permeabilized with 0.3% Triton X-100 for 10 min, and blocked with 10% goat serum (Google, Wuhan, China) for 30 min. The primary antibody was diluted with 0.3% Triton X-100 and stayed overnight at 4°C. The primary antibodies are mouse anti-β-tubulin III (1:400), mouse anti-MAP2 (1:400) and mouse anti-ChAT (1:200; all Abcam). The second antibody (goat anti-mouse, 1:400 Dylight, Invitrogen, CA, USA) was hatched at room temperature for 1 h. DAPI (Google) was counterstained for 5 min. Immunofluorescence staining was observed under a fluorescence microscope (Leica Microsystems GmbH, Wetzlar, Germany).
Quantitative real-time PCR (qRT-PCR)
Both BMSCs and ADSCs were divided into four groups: native group, and 1-, 3- and 7-day neuronal induction groups. TRIzol was used to extract total RNA. The concentration and purification of cells were detected by using a nucleic acid detector (Nanodrop-2000, Thermo Fisher Scientific, Wilmington, DE, USA, USA). Reverse transcription and PCR amplification were performed as per instructions on the kit. The primers were designed and synthesized by Google Biological Company (Wuhan, China (Table I). The primers sequences were listed in Table I. β-actin was used as an endogenous control to normalize gene expression levels. The reverse transcription conditions are as follows: 37°C 15 min, 85°C 5 sec, thermal insulation at 4°C, and the PCR amplification conditions are as follows: 5°C 3 min, 95°C 10 sec, 58.5°C 30 sec, 72°C 40 sec, 40 cycles. Analysis of relative gene expression data was usingthe 2−ΔΔCt method (21).
Table I.
Sequences of primers used for reverse transcription-quantitative polymerase chain reaction analysis.
| Target | Forward primer (5′-3′) | Reverse primer (5′-3′) |
|---|---|---|
| Nestin | GGACTCAGAACAAGTGAATGGG | CTGTCCCTGTAATAGGAGTTCTTG |
| β-tubulin III | GAGCGGATCAGCGTCTACTA | GTCGCAGTTTTCACACTCCT |
| MAP2 | CTCTTCCGCTCAGACACCCT | CCCTCATCAGTCGTGGTTTG |
| ChAT | TTTGTCCTCTCCACTAGCCA | ATACCCATTTGGGACCACAG |
| NGF | CATCACTGTGGACCCCAAACTGT | GTCCGTGGCTGTGGTCTTATCTC |
| NT-3 | GCGATGCTACCGCAAAGAAC | ATGGCGTCTCCCACACTACC |
| BDNF | TTGATGAGACCGGGTTCCCT | GTCCGTGGACGTTTGCTTCTT |
| β-actin | TGCTATGTTGCCCTAGACTTCG | GTTGGCATAGAGGTCTTTACGG |
MAP2, microtubule associated protein 2; ChAT, Choline acetyltransferase; NGF, nerve growth factor; NT-3, 3′-nucleotidase; BDNF, brain derived neurotrophic factor.
Western blot analysis
BMSCs and ADSCs in the 6-well plate were flushed with 0.1M PBS, lysed by addition of radio-immunoprecipitation assay (RIPA) buffer (Google), and centrifuged at 4°C to harvest the supernatant and detected the protein concentration by Bradford method. Then, the supernatant was boiled at 100°C and centrifuged for later use. After preparation of the separation gel and addition of the sample, sodium dodecyl sulphate-polyacrylamide gel electrophoresis (SDS-PAGE) was performed. An equal amount (10 mg) of protein extracted from these samples was resolved on a 4–15% polyacrylamide gradient. Then the protein was transferred to the nitrocellulose membrane. The membrane was blocked in 5% skimmed milk/PBS for 1 h and then incubated with primary antibodies nestin (rabbit anti-rat monoclonal antibody, 1:2,000), β-tubulin III (rabbit anti-rat monoclonal antibody, 1:1,000), MAP2 (rabbit anti-rat monoclonal antibody, 1:2,000), synaptophysin (rabbit anti-rat monoclonal antibody, 1:2,000), NGF (rabbit anti-rat monoclonal antibody, 1:2,000), NT-3 (rabbit anti-rat monoclonal antibody, 1:1,000), brain derived neurotrophic factor (BDNF, rabbit anti-rat monoclonal antibody, 1:2,000; all Abcam) and GAPDH (rabbit anti-rat monoclonal antibody, 1:2,000; Wei'ao, Shanghai, China). After incubation with horseradish peroxidase (HRP)-marked goat anti-rabbit second antibody (1:2,000, Jackson ImmunoResearch Laboratories, Inc., West Grove, PA, USA), chemiluminescence was detected by exposure to X-rays. The bands were quantified using Odyssey v1.2 software (LI-COR Biosciences, Lincoln, NE, USA) by measuring the band intensity for each group and normalizing to GAPDH as an internal control. The western blot experiment was repeated at least three times.
ELISA
Enzyme-linked immunosorbent assay (ELISA) kit (Wei'ao) was used to measure the level of NGF, NT-3, BDNF in culture medium according to the manufacturer's instruction. Passage 4 BMSCs and ADSCs were resuspended and plated into 6-well culture plates at a concentration of 5×10⁵ cells/well, and induced by the medium used above. Then DMEM/F12 was replaced by serum-free medium. After 48 h induction, the supernatant was collected and used for the measurement of NGF, NT-3, BDNF level secreted by BMSCs and ADSCs.
Statistical analysis
All the above tests were performed at least in triplicate. The results were analyzed by using the statistical software SPSS 21.0 (IBM SPSS, Armonk, NY, USA The data were expressed as Standard Deviation (SD). The quantitative figures in this work represent the mean ± standard error of mean (SEM). Repeated measure Analysis of Variance (ANOVA) was used for statistical analysis. Values of P<0.05 were considered statistically significant.
Results
Morphology and phenotypic characteristics of BMSCs and ADSCs
Both BMSCs and ADSCs were long spindle-shaped with oval-shaped nuclei, growing homogeneously. Compared with ADSCs, BMSCs were thinner and longer. Neither BMSCs nor ADSCs underwent significant morphologic change from the primary generation to the fourth generation (Fig. 1A-D).
Figure 1.

Morphology of BMSCs and ADSCs. Passage 2 BMSCs (A), ADSCs (B) and passage 4 BMSCs (C), ADSCs (D), which were long spindle-shaped. Compared with ADSCs, BMSCs were thinner and longer. Scale bar, 100 µm.
To further explore the phenotypic characteristics of BMSCs and ADSCs, immunophenotypic analysis was performed by flow cytometry method. It was found that both BMSCs and ADSCs expressed CD44 and CD90 (>99%), but neither CD34 nor CD45, indicating that both BMSCs and ADSCs expressed typical surface markers of MSCs. In addition, the purity of both mesenchymal stem cells were relatively high (Fig. 2).
Figure 2.

Immunophenotypic analysis of BMSCs and ADSCs. Both BMSCs and ADSCs expressed CD44 and CD90, but neither CD34 nor CD45. BMSCs, bone marrow-derived mesenchymal stem cells; ADSCs, adipose tissue-derived mesenchymal stem cells.
Cell proliferation ability
Knowing that harvest of large amounts of cells within a short period is of great clinical significance in cell therapy, the cell proliferation ability of passage 4 BMSCs and ADSCs was compared by cell counting method. It was found that the population doubling time for BMSCs was 17.69±2.22 h vs. 14.51±0.89 h for ADSCs (P<0.05). Both BMSCs and ADSCs reached the lag phase of growth at day 15 (Fig. 3). The results suggested that ADSCs proliferated more quickly than BMSCs in vitro.
Figure 3.
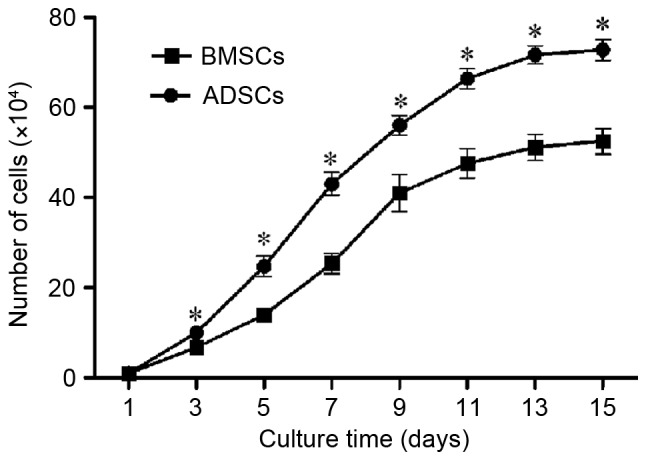
Cell proliferation ability of BMSCs and ADSCs. ADSCs proliferated faster than BMSCs, and both cells reached the lag phase of growth at day 15. The data were expressed in mean ± SD. *P<0.05 vs. BMSCs at the same time point. BMSCs, bone marrow-derived mesenchymal stem cells; ADSCs, adipose tissue-derived mesenchymal stem cells.
Morphological changes of BMSCs and ADSCs after neuronal induction
Morphological changes were observed in BMSCs at day 4 after neuronal induction. It was found the cellular bodies became round or oval gradually, and the processes became thinner and longer. These changes were observed in ADSCs at day 3 after neuronal induction, indicating that morphologic changes occurred earlier in ADSCs than those in BMSCs. At day 7 after neuronal induction, both NI-BMSCs and NI-ADSCs exhibited a neuronal morphology (Fig. 4A-D). In NI-BMSCs, the cellular bodies were looked round or oval, much bigger in size and with 3–5 long processes, while they were round, much smaller in size and with 2–3 short processes in NI-ADSCs. The induction rate were (73.61±3.43) and (93.01±2.65)% for BMSCs and ADSCs, respectively (P<0.05). These changes suggested that both BMSCs and ADSCs were able to differentiate into neuron-like cells in morphology. In comparison, ADSCs differentiation was faster and induction rate was higher.
Figure 4.

Morphology of NI-BMSCs (A and C) and NI-ADSCs (B and D). After 7-day induced, cellular bodies of both cells became round or oval gradually, and the processes became thinner and longer, indicating that they exhibited a neuronal morphology. Scale bar, 100 µm.
Expression of neuronal markers in BMSCs and ADSCs
Immunocytochemistry was used to characterize ADSCs and BMSCs (Fig. 5). It was found that the positive cells for β-tubulin III of BMSCs (Fig. 5A) were (12.5±1.80)%, which were lower than (19.5±1.50)% of ADSCs (P<0.05; Fig. 5D). No MAP2 or ChAT positive cells was exhibited in BMSCs (Fig. 5B and C) and ADSCs (Fig. 5E and F) before neuronal induction.
Figure 5.

Immunocytochemical characterization of BMSCs and ADSCs. Native BMSCs (A) express less β-tubulin IIIthan native ADSCs (D). No MAP2 and ChAT positive cells was observed in either BMSCs (B and C) or ADSCs (E and F). After 7-day neuronal induction, the positive cells of β-tubulin III, MAP2, and ChAT for both cells (G-L) significantly increased. Scale bar, 100 µm. BMSCs, bone marrow-derived mesenchymal stem cells; ADSCs, adipose tissue-derived mesenchymal stem cells. MAP2, microtubule associated protein 2; ChAT, Choline acetyltransferase.
After 7-day neuronal induction, the positive cells of β-tubulin III, MAP2 and ChAT in NI-BMSCs was (71.67±3.51), (73.3±4.04) and (53.47±3.53)% respectively, vs. (79.67±2.52) (61.17±2.75) and (64.26±6.88)% in NI-ADSCs (P<0.05) (Fig. 5G-L). After neuronal induction, the neuronal marker expression was increased significantly in both NI-BMSCs and NI-ADSCs. The expression of β-tubulin III and ChAT in NI-BMSCs were significantly lower than that in NI-ADSCs, while the expression of MAP2 in BMSCs was higher than that in ADSCs.
The expressions of neuronal marker genes at transcriptional level of BMSCs and ADSCs were detected by qRT-PCR. Expressions of these genes of both cells increased significantly after neuronal induction. Expression of nestin mRNA (Fig. 6A) began to increase after 1-day induction, and remained unchanged significantly after 1-, 3- and 7-day induction, While mRNA expression of β-tubulin III, MAP2 and ChAT (Fig. 6B-D) began to increase after 1-day induction, and reached the peaks at day 7. Compared with BMSCs, the mRNA expression of nestin, β-tubulin III and ChAT in ADSCs were relatively higher both before and after induction, while the mRNA expression of MAP2 mRNA was lower than that in BMSCs.
Figure 6.

The expression of neuronal marker genes at transcriptional level in BMSCs and ADSCs were quantified by using qRT-PCR. Expression levels were normalized to β-actin, calibrated to native BMSCs expression levels. The expression of nestin (A), β-tubulin III (B), MAP2 (C) and ChAT (D) increased significantly after induction. Compared with BMSCs, the mRNA expression of nestin, β-tubulin III and ChAT in ADSCs were relatively higher. Error bars represent by ± SEM.*P<0.05 vs. BMSCs at the same time point, #P<0.05 vs. the same cells at day 0. BMSCs, bone marrow-derived mesenchymal stem cells; ADSCs, adipose tissue-derived mesenchymal stem cells ChAT, Choline acetyltransferase.
The results of western blot were consistent with the immunofluorescence and qRT-PCR. After 7-day neuronal induction, the protein expression of nestin, β-tubulin III, MAP2 and synaptophysin (Fig. 7A-E) was higher than that of native BMSCs and ADSCs. The protein expression of β-tubulin III and synaptophysin protein in ADSCs was higher than that in BMSCs both before and after neuronal induction, while the protein expression of MAP2 in ADSCs was lower than that in BMSCs. There was no difference between BMSCs and ADSCs in protein expression of nestin.
Figure 7.

The expression of the neuronal marker genes, nestin (B), β-tubulin III (C), MAP2 (D) and Synaptophysin (E), in BMSCs and ADSCs were detected by western blot (A). Expression levels were normalized to GAPDH, error bars represent by ± SEM. *P<0.05 vs. BMSCs at the same time point. #P<0.05 vs. the same cells before induction.
Expression and secretion of neurotrophic factors
The results of qRT-PCR showed that both BMSCs and ADSCs expressed constitutive gene of neurotrophic factors such as NGF, NT-3 and BDNF at transcriptional levels. After neuronal induction, the NGF, NT-3 and BDNF increased with culture time and reached the peak at day 7. There was higher expression of BDNF, but lower expression of NGF and NT-3 in BMSCs compared with ADSCs (Fig. 8A-C). We also detected the neurotrophin glial cell derived neurotrophic factor (GDNF) and found that there was no significant difference between native and neuronal induced BMSCs and ADSCs.
Figure 8.

The expression of neurotrophic factors at transcriptional levels. qRT-PCR was used to detected the gene expression of NGF (A), NT-3 (B), BDNF (C) in BMSCs and ADSCs. Expression levels were normalized to β-actin, calibrated to native BMSCs expression levels. Error bars represent by ± SEM. NGF: nerve growth factor; NT-3: 3′-nucleotidase; BDNF: brain derived neurotrophic factor. *P<0.05 vs. BMSCs at the same time point, #P<0.05 vs. the same cells at day 0.
We qualified the protein expression of neurotrophic factors by western blot (Fig. 9A). The results confirmed that native BMSCs and ADSCs had also expressed NGF, NT-3 and BDNF (Fig. 9B-D). After neuronal induction, the expression of NT-3 in NI-ADSCs was increased compared with that in NI-BMSCs, whereas the change of NGF had no statistical significance. However, NI-BMSCs and NI-ADSCs expressed less BDNF than native ones. The protein expression of NGF and NT-3 in NI-ADSCs were greater than those in NI-BMSCs, while the protein expression of BDNF had no statistical significance between NI-BMSCs and NI-ADSCs.
Figure 9.

The protein expression of the NGF (B), NT-3 (C), BDNF (D) in BMSCs and ADSCs were quantified by western blot (A). Expression levels were normalized to GAPDH. Error bars represent by ± SEM. *P<0.05 vs. BMSCs at the same time point, #P<0.05 vs. the same cells before induction.
Secretions of neurotrophic factor in BMSCs and ADSCs
The secretions of neurotrophic factor in BMSCs and ADSCs were measured by ELISA. It was found that both NI-BMSCs and NI-ADSCs secreted more NGF, NT-3 and BDNF compared with the native ones (Table II, Fig. 10). Compared with ADSCs, native and NI-BMSCs secreted more BDNF, but less NGF and NT-3.
Table II.
Secretion of NGF, NT-3 and BDNF (pg/ml)
| BMSCs | NI-BMSCs | ADSCs | NI-ADSCs | |
|---|---|---|---|---|
| NGF | 210.88±44.22 | 276.84±54.29a | 267.22±29.42b | 348.62±37.41a,b |
| NT-3 | 214.21±44.58 | 379.77±45.24a | 349.24±22.70b | 537.76±155.38a,b |
| BDNF | 115.50±22.58 | 142.06±14.77a | 83.83±19.67b | 119.51±10.25a,b |
NGF, nerve growth factor; NT-3, 3′-nucleotidase; BDNF, brain derived neurotrophic factor.
P<0.05 vs. the same cells before induction,
P<0.05 vs. BMSCs at the same time point.
Figure 10.

The secretion of neurotrophic factors were measured by ELISA. NI-BMSCs and NI-ADSCs secreted more NGF (A), NT-3 (B) and BDNF (C) compared with the native ones. ADSCs secreted more NGF and NT-3, but less BDNF, compared with BMSCs. Error bars represented ± SEM. *P<0.05 vs. BMSCs at the same time point. #P<0.05 vs. the same cells before induction.
Discussion
ADSCs have advantage in harvest
MSCs can be easily obtained from the bone marrow and adipose tissues, but more easily from subcutaneous adipose tissues, which is more acceptable for the patients. In our study, 8×10⁴ adherent BMSCs could be obtained from the bone marrow of bilateral tibias and femurs in a 45 g SD rat after 24 h incubation, and increased to 7–8×10⁵ cells after one-week culture, while 1×10⁵ adherent ADSCs were harvested from inguinal adipose tissues in the same rat, then increased to 7–9×10⁶ after one-week culture. Compared with BMSCs, more ADSCs could be easily harvested from the same donor, and ADSCs also proliferated more rapidly than BMSCs at same condition. The quantity and activity of the BMSCs reduced apparently with aging, while ADSCs were less affected, suggesting that ADSCs are a more effective source for clinical use.
Neuronal differentiation ability
BMSCs and ADSCs are known to differentiate into neurons (22,23). In our study, nestin, a neural precursor stem cells marker, and β-tubulin III, an immature neuronal marker, were expressed in native BMSCs and ADSCs, which suggested that both MSCs retained a native potential for neuronal differentiation and were in conformity with other studies (20). After 7-day neuronal induction, the expression of β-tubulin III, ChAT and synaptophysin in ADSCs was significantly higher than that in BMSCs, indicating that ADSCs had a higher ability of neuronal differentiation than BMSCs. The reason may be that MSCs are composed of more than one type of precursor cells. As the proportion of different precursor cells is different in BMSCs and ADSCs, their adipogenic, osteogenic and neurogenic abilities are different (24).
Ability of secreting neurotrophic factors of induced cells
Neurotrophic factors such as NGF, NT-3, BDNF are known as neuron growth nutrients, which play an important role in neuroblast proliferation, maturation and phenotype maintenance (25–28). To explore whether the NI-BMSCs and NI-ADSCs had neuronal functions, we detected the expression and secretion of neurotrophic factors. It was found that NGF, NT-3 and BDNF mRNA expressions in both BMSCs and ADSCs increased in varying degrees after neuronal induction. But surprisingly, protein expression of NGF, NT-3 had insignificantly changed and BDNF decreased to some extent. The mechanism of this phenomenon is unknown. qRT-PCR detects the mRNA of genes at transcriptional level, while western blot and ELISA are at protein level. Expression of neurotrophins, such as NGF, BDNF, NT-3, not only are regulated at the transcriptional level, also are post-translationally modificated by elaborated intracellular systems (29). They are synthesized as inactive precursor proteins, pro-neurotrophins, and then are processed into active molecules via multipe steps involving glycosylation, sorting, proteolytic cleavage and secretion (30). For example, after synthesis of BDNF mRNA, BDNF protein is initially produced as a precursor protein (proBDNF), followed by post-translational cleavage of proBDNF into the mature form of BDNF by intracellular and/or extracellular proteases (31). Another interesting finding was reported that the mRNA levels of NGF and BDNF in both ADSCs and BMSCs improved rapidly but their protein levels decreased during the course of neural differentiation which was attributed to neurotrophins might be consumed during the course of neural differentiation (17). So there may exist some differences between different levels.
Both BMSCs and ADSCs secreted more NGF, NT-3 and BDNF after neuronal induction. The native and NI-ADSCs secreted more NGF and NT-3, but less BDNF than BMSCs, suggesting that the two types of MSCs may express different neurotrophic factors.
Based on the results of this comparative study, we draw the following conclusions: (i) There are insignificant differences in morphologic and phenotypic characteristics between BMSCs and ADSCs derived from the same SD rats, except that cell bodies of BMSCs are larger than those of ADSCs. (ii) Compared with BMSCs, ADSCs proliferate significantly faster. (iii) BMSCs and ADSCs can be easily induced into neuron-like cells by using the four small- molecular compounds. (iv) The expression of neuronal marker β-tubulin III, ChAT and synaptophysin in ADSCs are higher than those in BMSCs, suggesting that ADSCs have stronger capability of differentiation into neuron-like cells. (5) The expression and secretion of neurotrophic factors NGF and NT-3 in ADSCs are higher than those both in native and NI-BMSCs, suggesting that ADSCs have a better trophic effect in neuronal replacement therapy.
In summary, ADSCs differs insignificantly from BMSCs in morphology and phenotypic characteristics. However, ADSCs proliferate significantly faster, differentiate into neuron-like cells faster, and express higher levels of NGF and NT-3. ADSCs may have more potential than BMSCs in the treatment of nervous systems diseases.
Acknowledgements
The present study was supported by the Funds of the National Natural Science Foundation of China (81271396).
References
- 1.Morita T, Sasaki M, Kataoka-Sasaki Y, Nakazaki M, Nagahama H, Oka S, Oshigiri T, Takebayashi T, Yamashita T, Kocsis JD, Honmou O. Intravenous infusion of mesenchymal stem cells promotes functional recovery in a model of chronic spinal cord injury. Neuroscience. 2016;335:221–231. doi: 10.1016/j.neuroscience.2016.08.037. [DOI] [PubMed] [Google Scholar]
- 2.Spejo AB, Carvalho JL, Goes AM, Oliveira AL. Neuroprotective effects of mesenchymal stem cells on spinal motoneurons following ventral root axotomy: Synapse stability and axonal regeneration. Neuroscience. 2013;250:715–732. doi: 10.1016/j.neuroscience.2013.07.043. [DOI] [PubMed] [Google Scholar]
- 3.Kern S, Eichler H, Stoeve J, Kluter H, Bieback K. Comparative analysis of mesenchymal stem cells from bone marrow, umbilical cord blood, or adipose tissue. Stem Cells. 2006;24:1294–1301. doi: 10.1634/stemcells.2005-0342. [DOI] [PubMed] [Google Scholar]
- 4.Zou JP, Huang S, Peng Y, Liu HW, Cheng B, Fu XB, Xiang XF. Mesenchymal stem cells/multipotent mesenchymal stromal cells (MSCs): Potential role in healing cutaneous chronic wounds. Int J Low Extrem Wounds. 2012;11:244–253. doi: 10.1177/1534734612463935. [DOI] [PubMed] [Google Scholar]
- 5.Huang T, He D, Kleiner G, Kuluz J. Neuron-like differentiation of adipose-derived stem cells from infant piglets in vitro. J Spinal Cord Med. 2007;30(Suppl 1):S35–S40. doi: 10.1080/10790268.2007.11753967. [DOI] [PMC free article] [PubMed] [Google Scholar]
- 6.Alexanian AR, Fehlings MG, Zhang Z, Maiman DJ. Transplanted neurally modified bone marrow-derived mesenchymal stem cells promote tissue protection and locomotor recovery in spinal cord injured rats. Neurorehabil Neural Repair. 2011;25:873–880. doi: 10.1177/1545968311416823. [DOI] [PubMed] [Google Scholar]
- 7.Stenderup K, Justesen J, Clausen C, Kassem M. Aging is associated with decreased maximal life span and accelerated senescence of bone marrow stromal cells. Bone. 2003;33:919–926. doi: 10.1016/j.bone.2003.07.005. [DOI] [PubMed] [Google Scholar]
- 8.Lei Z, Yongda L, Jun M, Yingyu S, Shaoju Z, Xinwen Z, Mingxue Z. Culture and neural differentiation of rat bone marrow mesenchymal stem cells in vitro. Cell Biol Int. 2007;31:916–923. doi: 10.1016/j.cellbi.2007.02.006. [DOI] [PubMed] [Google Scholar]
- 9.Kingham PJ, Kalbermatten DF, Mahay D, Armstrong SJ, Wiberg M, Terenghi G. Adipose-derived stem cells differentiate into a Schwann cell phenotype and promote neurite outgrowth in vitro. Exp Neurol. 2007;207:267–274. doi: 10.1016/j.expneurol.2007.06.029. [DOI] [PubMed] [Google Scholar]
- 10.Filardo G, Perdisa F, Roffi A, Marcacci M, Kon E. Stem cells in articular cartilage regeneration. J Orthop Surg Res. 2016;11:42. doi: 10.1186/s13018-016-0378-x. [DOI] [PMC free article] [PubMed] [Google Scholar]
- 11.Ning H, Lin G, Lue TF, Lin CS. Neuron-like differentiation of adipose tissue-derived stromal cells and vascular smooth muscle cells. Differentiation. 2006;74:510–518. doi: 10.1111/j.1432-0436.2006.00081.x. [DOI] [PubMed] [Google Scholar]
- 12.Chung CS, Fujita N, Kawahara N, Yui S, Nam E, Nishimura R. A comparison of neurosphere differentiation potential of canine bone marrow-derived mesenchymal stem cells and adipose-derived mesenchymal stem cells. J Vet Med Sci. 2013;75:879–886. doi: 10.1292/jvms.12-0470. [DOI] [PubMed] [Google Scholar]
- 13.Lotfy A, Salama M, Zahran F, Jones E, Badawy A, Sobh M. Characterization of mesenchymal stem cells derived from rat bone marrow and adipose tissue: A comparative study. Int J Stem Cells. 2014;7:135–142. doi: 10.15283/ijsc.2014.7.2.135. [DOI] [PMC free article] [PubMed] [Google Scholar]
- 14.Taha MF, Javeri A, Kheirkhah O, Majidizadeh T, Khalatbary AR. Neural differentiation of mouse embryonic and mesenchymal stem cells in a simple medium containing synthetic serum replacement. J Biotechnol. 2014;172:1–10. doi: 10.1016/j.jbiotec.2013.11.028. [DOI] [PubMed] [Google Scholar]
- 15.Jiang D, Du J, Zhang X, Zhou W, Zong L, Dong C, Chen K, Chen Y, Chen X, Jiang H. miR-124 promotes the neuronal differentiation of mouse inner ear neural stem cells. Int J Mol Med. 2016;38:1367–1376. doi: 10.3892/ijmm.2016.2751. [DOI] [PMC free article] [PubMed] [Google Scholar]
- 16.Han C, Zhang L, Song L, Liu Y, Zou W, Piao H, Liu J. Human adipose-derived mesenchymal stem cells: A better cell source for nervous system regeneration. Chin Med J (Engl) 2014;127:329–337. [PubMed] [Google Scholar]
- 17.Zhang HT, Liu ZL, Yao XQ, Yang ZJ, Xu RX. Neural differentiation ability of mesenchymal stromal cells from bone marrow and adipose tissue: A comparative study. Cytotherapy. 2012;14:1203–1214. doi: 10.3109/14653249.2012.711470. [DOI] [PubMed] [Google Scholar]
- 18.Nan C, Shi Y, Zhao Z, Ma S, Liu J, Yan D, Song G, Liu H. Monosialoteterahexosyl ganglioside induces the differentiation of human umbilical cord-derived mesenchymal stem cells into neuron-like cells. Int J Mol Med. 2015;36:1057–1062. doi: 10.3892/ijmm.2015.2307. [DOI] [PMC free article] [PubMed] [Google Scholar]
- 19.Zhang Z, Alexanian AR. Dopaminergic-like cells from epigenetically reprogrammed mesenchymal stem cells. J Cell Mol Med. 2012;16:2708–2714. doi: 10.1111/j.1582-4934.2012.01591.x. [DOI] [PMC free article] [PubMed] [Google Scholar]
- 20.Zhang Z, Alexanian AR. The neural plasticity of early-passage human bone marrow-derived mesenchymal stem cells and their modulation with chromatin-modifying agents. J Tissue Eng Regen Med. 2014;8:407–413. doi: 10.1002/term.1535. [DOI] [PubMed] [Google Scholar]
- 21.Livak KJ, Schmittgen TD. Analysis of relative gene expression data using real-time quantitative PCR and the 2(−Delta Delta C(T)) Method. Methods. 2001;25:402–408. doi: 10.1006/meth.2001.1262. [DOI] [PubMed] [Google Scholar]
- 22.Zarei MH, Soodi M, Qasemian-Lemraski M, Jafarzadeh E, Taha MF. Study of the chlorpyrifos neurotoxicity using neural differentiation of adipose tissue-derived stem cells. Environ Toxicol. 2016;31:1510–1519. doi: 10.1002/tox.22155. [DOI] [PubMed] [Google Scholar]
- 23.Ye Y, Peng YR, Hu SQ, Yan XL, Chen J, Xu T. In vitro differentiation of bone marrow mesenchymal stem cells into neuron-like cells by cerebrospinal fluid improves motor function of middle cerebral artery occlusion rats. Front Neurol. 2016;7:183. doi: 10.3389/fneur.2016.00183. [DOI] [PMC free article] [PubMed] [Google Scholar]
- 24.Pittenger MF, Mackay AM, Beck SC, Jaiswal RK, Douglas R, Mosca JD, Moorman MA, Simonetti DW, Craig S, Marshak DR. Multilineage potential of adult human mesenchymal stem cells. Science. 1999;284:143–147. doi: 10.1126/science.284.5411.143. [DOI] [PubMed] [Google Scholar]
- 25.Yamada M, Tanabe K, Wada K, Shimoke K, Ishikawa Y, Ikeuchi T, Koizumi S, Hatanaka H. Differences in survival-promoting effects and intracellular signaling properties of BDNF and IGF-1 in cultured cerebral cortical neurons. J Neurochem. 2001;78:940–951. doi: 10.1046/j.1471-4159.2001.00497.x. [DOI] [PubMed] [Google Scholar]
- 26.Tong L, Balazs R, Thornton PL, Cotman CW. Beta-amyloid peptide at sublethal concentrations downregulates brain-derived neurotrophic factor functions in cultured cortical neurons. J Neurosci. 2004;24:6799–6809. doi: 10.1523/JNEUROSCI.5463-03.2004. [DOI] [PMC free article] [PubMed] [Google Scholar]
- 27.Weishaupt N, Mason AL, Hurd C, May Z, Zmyslowski DC, Galleguillos D, Sipione S, Fouad K. Vector-induced NT-3 expression in rats promotes collateral growth of injured corticospinal tract axons far rostral to a spinal cord injury. Neuroscience. 2014;272:65–75. doi: 10.1016/j.neuroscience.2014.04.041. [DOI] [PubMed] [Google Scholar]
- 28.Camerino C, Conte E, Cannone M, Caloiero R, Fonzino A, Tricarico D. Nerve growth factor, brain-derived neurotrophic factor and osteocalcin gene relationship in energy regulation, bone homeostasis and reproductive organs analyzed by mRNA quantitative evaluation and linear correlation analysis. Front Physiol. 2016;7:456. doi: 10.3389/fphys.2016.00456. [DOI] [PMC free article] [PubMed] [Google Scholar]
- 29.Fujimoto M, Hayashi T, Urfer R, Mita S, Su TP. Sigma-1 receptor chaperones regulate the secretion of brain-derived neurotrophic factor. Synapse. 2012;66:630–639. doi: 10.1002/syn.21549. [DOI] [PMC free article] [PubMed] [Google Scholar]
- 30.Lu B, Pang PT, Woo NH. The yin and yang of neurotrophin action. Nat Rev Neurosci. 2005;6:603–614. doi: 10.1038/nrn1726. [DOI] [PubMed] [Google Scholar]
- 31.Nikoletopoulou V, Lickert H, Frade JM, Rencurel C, Giallonardo P, Zhang L, Bibel M, Barde YA. Neurotrophin receptors TrkA and TrkC cause neuronal death whereas TrkB does not. Nature. 2010;467:59–63. doi: 10.1038/nature09336. [DOI] [PubMed] [Google Scholar]