Abstract
Electric field (EF) exposure can affect the elongation, migration, orientation, and division of cells. The present study tested the hypothesis that EF may also affect epithelial-mesenchymal transition (EMT) in lens epithelial cells and that this effect may be an important inducer in the pathological process of posterior capsule opacification (PCO). Human lens epithelial (HLE)-B3 cells were exposed to an EF. Experiments were performed in the presence or absence of an anti-integrin β1 blocking antibody or a small molecule inhibitor targeting focal adhesion kinase (FAK). Cell morphology changes were observed by microscopy. The expression levels of integrin β1, FAK, phosphorylated (p)FAK and of EMT markers, E-cadherin and Vimentin, were examined by immunofluorescence, reverse transcription-quantitative polymerase chain reaction and western blotting. Following exposure to EF, HLE-B3 cells appeared elongated and resembled more fibroblast-like cells. Expression of E-cadherin was decreased, while expression of Vimentin was increased in HLE-B3 cells exposed to EF, compared with control cells. In addition, the mRNA expression levels of integrin β1 were increased, and the protein expression levels of integrin β1 and pFAK were increased in HLE-B3 cells exposed to EF, compared with control cells. Blocking of integrin β1 suppressed the EMT-related morphological changes of HLE-B3 cells and reduced the activation of FAK following EF exposure. However, blocking of pFAK did not affect the EMT status of HLE-B3 cells induced by EF. In conclusion, the present study demonstrated that EF exposure induced EMT in HLE-B3 cells and that this effect may partially be mediated by the activation of integrin β1-FAK signaling. The present results may provide a new mechanistic approach to prevent the development of PCO.
Keywords: posterior capsule opacification, electric field, epithelial-mesenchymal transition, integrin, focal adhesion kinase, human lens epithelial cell
Introduction
Posterior capsule opacification (PCO) is the most common postoperative complication following cataract surgery (1) The incidence of adult PCO is >25% in the first 5 years postoperatively (2) Pediatric patients are reported to have a higher incidence of PCO, because the lens epithelial cells of children grow faster, therefore they are also more likely to undergo increased migration, proliferation and fibrosis in the posterior capsule (3). PCO is mainly caused by the epithelial-mesenchymal transition (EMT), migration and proliferation of remnant lens epithelial cells (LECs) following cataract surgery (4,5). EMT refers to the process that polarized epithelial cells transform to mesenchymal cells via multiple biochemical changes. The EMT process therefore results in a loss of cell adhesion molecules, such as E-cadherin, and an increase of mesenchymal cell markers, such as Vimentin (6). EMT serves a critical role in embryonic development, fibrosis disease, chronic inflammation, pathological wound healing and cancer progression and metastasis (7). Despite previous studies on the cell proliferation and EMT of LECs, the underlying mechanisms of how LECs change into lens fibers following surgery remain largely unknown. A previous study has demonstrated that the lens has a unique pattern of circulating electric currents, which exit at the lens equator and enter at both poles, serving as an internal circulatory system (8). It is hypothesized that this endogenous electric field (EF) provides a stable internal circulatory system in order to maintain the lens clarity and homeostasis (8,9). Previous findings have suggested that electrical signals lead to distortion, migration, and orientation of LECs, and even regulate LEC division (10–12). However, the cataract surgery removes a large part of the anterior lens capsule and the lens nucleus, which changes the inward electrical currents at the anterior lens surface and significantly disrupts the normal electric current pattern. This abnormal electrical signal may trigger LEC migration and proliferation, and eventually the formation of PCO (13,14). Furthermore, several studies have reported that there is a strong association between the integrin signaling pathway, EMT and the development of fibrotic lens disease (15–17).
The present study therefore tested the hypothesis that changes in EF may be an important inducer of EMT in LECs, and that integrin signaling pathways may be involved in the regulation of this process. The results revealed that EF induced EMT in LECs and elicited the activation of integrin-focal adhesion kinase (FAK) signaling. Blocking of integrin β1 prevented FAK activation and EMT in LECs following EF exposure, while blocking of FAK had no effect. The results of the present study may provide novel insights for the treatment of patient with PCO.
Materials and methods
Cell culture
The human lens epithelial (HLE)-B3 cell line was obtained from Zhong Shan Ophthalmic Center of Sun Yat-Sen University (Guangzhou, China). The cells were maintained in Dulbecco's modified Eagle's medium (DMEM; Gibco; Thermo Fisher Scientific, Inc., Waltham, MA, USA) supplemented with 12.5% fetal bovine serum (Gibco; Thermo Fisher Scientific, Inc.), 100 IU/ml penicillin and 100 µg/ml streptomycin, at 37°C in a 5% CO2 incubator. The medium was replaced every 2–3 days. Cells were incubated overnight for single-cell experiments, while to form a confluent monolayer, cells were incubated for 2–3 days. For functional blocking of integrin β1 subunit, HLE-B3 cell suspensions were incubated with 10 µg/ml of the function blocking antibody MAB1965 (EMD Millipore, Billerica, MA, USA) for 1 h at 37°C. In order to block FAK phosphorylation, a novel small molecule inhibitor of FAK was used, PF-573,228 (Tocris Bioscience, Bristol, UK) (18,19). The cells were incubated with 10 µM PF-573,228 for 1 h at 37°C.
EF application
The cells were exposed to an EF as described by Han et al (20) and Zhao et al (21). Briefly, 2 parallel strips of glass coverslip 2.2 cm-long were fixed 10 mm apart to the base of a tissue culture dish with silicone grease (DC4; Dow Corning, Midland, MI, USA). Cells were cultured in monolayer in the area between the 2 parallel strips of glass coverslip. A cover glass lid was applied to the shallow culture trough and sealed with silicone grease to create a chamber (22×10×0.3 mm). Agar-salt bridges of ~15 cm long were used to connect silver/silver chloride electrodes in salt solution to prevent the electrolytic products into the cultures. No significant fluctuation in field strength was observed. The cells were exposed to a 100 mV/mm EF for 24 h at 37°C in 5% CO2 incubator. Control cells were treated identically except for they were not exposed to EF.
Confocal fluorescence microscopy analysis
Following exposure to EF, the cells were washed three times with PBS and fixed with 4% paraformaldehyde for 20 min at room temperature. The coverslips were washed three times with PBS and blocked with 10% normal goat serum (Beyotime Institute of Biotechnology, Haimen, China) in 0.1% Triton X-100/PBS for 2 h at 4°C, then incubated with rabbit anti-human integrin β1 antibody (1:300; cat no. SAB4300655; Sigma-Aldrich; Merck KGaA, Darmstadt, Germany), rabbit anti-human Vimentin antibody (1:300; cat no. sc-7557; Santa Cruz Biotechnology, Inc., Dallas, TX, USA), or rabbit anti-human E-cadherin antibody (1:100; cat no. SAB4503751; Sigma-Aldrich; Merck KGaA) for 2 h at 4°C. Following washing, the cells were incubated with goat anti-rabbit antibodies conjugated with Cy3 (1:300; cat no. GB21303; Jingke Huaxue, Shanghai, China) for 1 h at room temperature and washed three times with PBS. The nuclei were stained with 0.5 µg/ml DAPI (Sigma-Aldrich; Merck KGaA) for 10 min at room temperature. Finally, images were captured with a confocal microscope (FV-1000; Olympus Corporation, Tokyo, Japan).
Reverse transcription-quantitative polymerase chain reaction (RT-qPCR)
Total RNA was isolated using TRIzol (Invitrogen; Thermo Fisher Scientific, Inc.), according to the manufacturer's protocol. Total RNA (5 µg) was reverse transcribed into cDNA using SuperScript II reverse transcriptase (Invitrogen; Thermo Fisher Scientific, Inc.), according to the manufacturer's protocol. The reaction volume was 20 µl. RNA and primers were mixed in a 12 µl volume and denatured for 5 min at 65°C. Then, RT buffer, RNase inhibitor, dNTPs and Revert Aid Reverse Transcriptase were added to a total volume of 20 µl. The mixture was incubated for 60 min at 42°C, followed by 5 min at 25°C. The reaction was terminated by incubation at 70°C for 5 min. qPCR was performed using SYBR Premix Ex Taq (Takara Biotechnology Co., Ltd., Dalian, China). The reaction mixture contained 2X SYBR mixture, PCR forward primer, PCR reverse primer, cDNA and dH2O in a total volume of 20 µl. Reactions were performed on an Agilent Mx3005P QPCR system (Agilent Technologies, Inc., Santa Clara, CA, USA). Thermocycling conditions were as follows: Initial denaturation at 95°C for 10 min, followed by 35 cycles at 95°C for 15 sec, at 62°C for 30 sec and at 72°C for 50 sec. GAPDH was used as an internal control. Relative gene expression was calculated according to the comparative Cq method (22) and normalized to GAPDH expression. The sequences of the primers used for qPCR are listed in Table I.
Table I.
Sequences of primers used for reverse transcription-quantitative polymerase chain reaction.
| Gene | NCBI accession no. | Primer | Sequence (5′-3′) | Product size (bp) |
|---|---|---|---|---|
| E-cadherin | NM_001317186.1 | Forward | CAAGCAGCAGTACATTCTA | 148 |
| Reverse | CACTTCCACTCTCTTTTC | |||
| Vimentin | NM_003380.3 | Forward | AATGGCTCGTCACCTTCG | 225 |
| Reverse | CTAGTTTCAACCGTCTTAATCAG | |||
| Integrin β1 | NM_002211.3 | Forward | GCCTTACATTAGCACAACACC | 284 |
| Reverse | CATCTCCAGCAAAGTGAAACC | |||
| GAPDH | NM_001289746.1 | Forward | GTCGGAGTCAACGGATTT | 277 |
| Reverse | ACTCCACGACGTACTCAG |
Western blotting
The cells were lysed with radioimmunoprecipitation assay buffer on ice for 1 h and centrifuged at 14,000 × g for 30 min at 4°C. The supernatant was then harvested and the protein concentration was determined using the bicinchoninic acid protein assay. Equal amounts of extracted protein samples (50 µg) were separated by 12% SDS-PAGE and transferred onto polyvinylidene fluoride membranes. Membranes were blocked with 8% skimmed milk for 1 h at room temperature and then were incubated at 4°C overnight with antibodies against integrin β1 (1:1,000; cat no. SAB4300655; Sigma-Aldrich; Merck KGaA), Vimentin (1:1,000; cat no. sc-7557; Santa Cruz Biotechnology, Inc.), E-cadherin (SAB4503751) (1:1,000; Sigma-Aldrich; Merck KGaA), FAK (1:1,000; cat no. 3285; Cell Signaling Technology, Inc., Danvers, MA, USA), phosphorylated (p)FAK [pY-397] (1:1,000; cat no. D20B1; Cell Signaling Technology, Inc.), and GAPDH (1:1,000; cat no. SAB2100894; Sigma-Aldrich; Merck KGaA). Membranes were then washed with TBS containing 0.1% Tween-20, and subsequently incubated with secondary horseradish peroxidase (HRP)-conjugated goat anti-rabbit antibodies (1:5,000; cat no. CW0103S; CWBIO, Beijing, China) at 37°C for 1 h, followed by color development using the Immobilon Western Chemiluminescent HRP substrate (EMD Millipore) and observation under a chemiluminescence analyzer (Bio-Rad Laboratories, Inc., Hercules, CA, USA). Blots were semi-quantified by densitometry using Adobe Photoshop software version 2015 (Adobe Systems, Inc., San Jose, CA, USA).
Statistical analysis
All experiments were repeated at least three times independently. Data are expressed as the mean ± standard deviation. Statistical analysis was performed with GraphPad Prism software version 5.0 (GraphPad Software, Inc., La Jolla, CA, USA). The statistical significance of the differences between groups was assessed using one-way analysis of variance followed by Tukey's post hoc test. P<0.05 was considered to indicate a statistically significant difference.
Results
EF induces morphologic changes in HLE-B3 cells
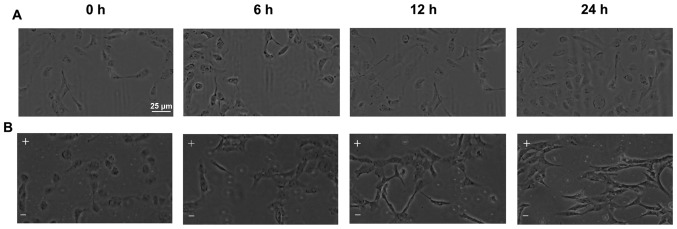
Untreated HLE-B3 cells exhibited an appearance of polygon monolayer or cuboidal shape when examined by microscopy analysis (Fig. 1A). However, the cells lost their epithelial cell morphology and acquired a mesenchymal appearance starting at 6 h of EF exposure (Fig. 1B). The EF-exposed cells appeared elongated and exhibited a fibroblast-like appearance with a long spindle-shape and larger intercellular spaces (Fig. 1B).
Figure 1.
EF exposure induces morphological changes in HLE-B3 cells. (A) HLE-B3 cells exhibited a cobblestone-like morphology in the absence of EF. (B) The cells were exposed to an EF of 100 mv/mm for 6, 12 and 24 h. Following EF exposure, the cells appeared larger and elongated, with a fibroblast-like or long spindle-shaped morphology, compared with untreated cells. Scale bar, 25 µm. EF, electric field; -, cathode; +, anode.
Effect of EF on expression of E-cadherin and Vimentin in HLE-B3 cells
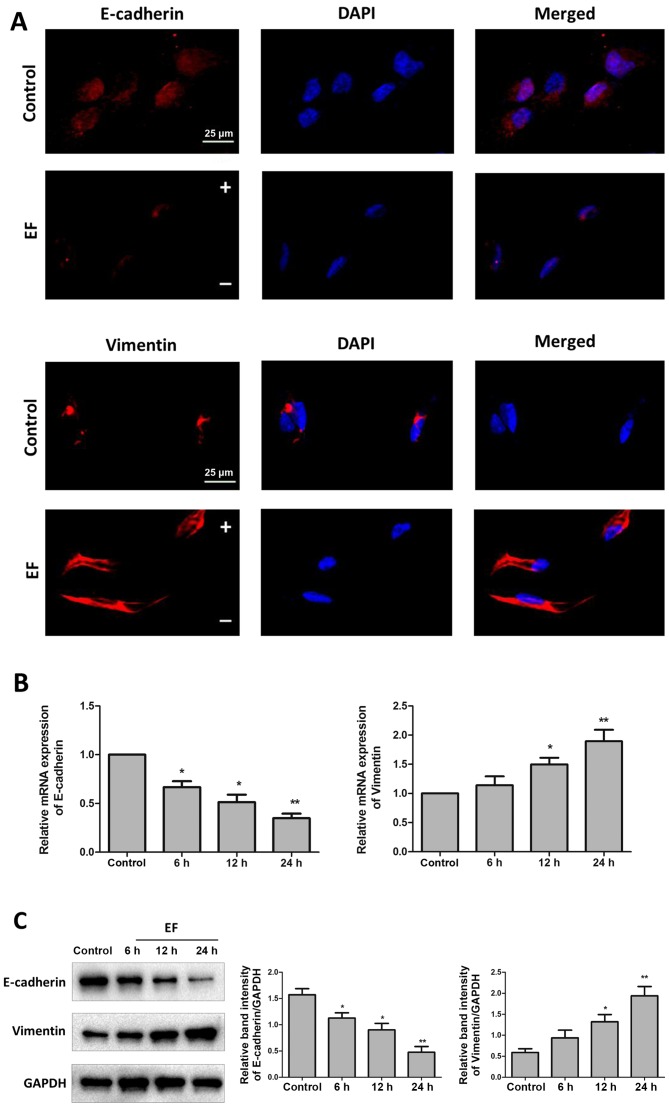
EMT is characterized by loss of epithelial makers, such as E-cadherin, and replacement by mesenchymal markers, such as Vimentin (23). HLE-B3 cells were exposed to an EF of 100 mV/mm for 24 h, and then the levels of E-cadherin and Vimentin were examined by immunofluorescence. The results revealed that EF exposure decreased the expression of the epithelial marker E-cadherin, while it increased the expression of the mesenchymal marker Vimentin (Fig. 2A). The mRNA expression levels of E-cadherin and Vimentin were also examined by RT-qPCR, and the results confirmed a significant shift of gene expression from a pattern characteristic of epithelial cells to that of mesenchymal cells in HLE-B3 cells following 24 h of EF exposure. The mRNA expression levels of E-cadherin decreased to 35% (P<0.01) and the mRNA expression of Vimentin increased by 90% (P<0.01) compared with control (Fig. 2B). At the protein expression level, E-cadherin protein levels decreased by ~70% (P<0.01) and Vimentin protein levels increased by approximately ~400% (P<0.01) compared with control (Fig. 2C).
Figure 2.
EF exposure promotes expression of EMT markers in HLE-B3 cells. Cells were examined for expression of E-cadherin and Vimentin, without (control) or with (EF) exposure to an EF of 100 mV/mm. (A) Immunofluorescent staining of EMT markers (red) following 24 h EF exposure. Nuclei were counterstained with DAPI (blue). Scale bar, 25 µm. (B) Reverse transcription-quantitative polymerase chain reaction analysis following 6, 12, and 24 h EF exposure. (C) Western blot analysis following 6, 12, and 24 h EF exposure. Data were presented as mean + standard deviation. *P<0.05 and **P<0.01 vs. control. EF, electric field; EMT, epithelial-mesenchymal transition; -, cathode; +, anode.
EF exposure promotes integrin β1 expression and FAK activation in HLE-B3 cells
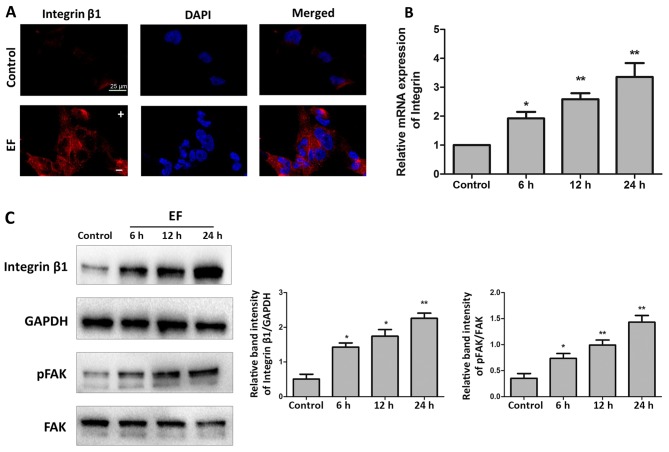
Results from immunofluorescence analysis revealed that EF exposure increased the expression of integrin β1 in HLE-B3 cells compared with control cells (Fig. 3A). RT-qPCR analysis confirmed that exposure to EF for 24 h stimulated an increase in the mRNA expression of integrin β1 in HLE-B3 cells by 3.35-fold, compared with control cells (P<0.01; Fig. 3B). Finally, the protein expression levels of integrin β1 were examined as well, and an increase of ~4.43-fold was observed following EF exposure for 24 h compared with control cells (P<0.01; Fig. 3C). Because activation of FAK is one of the key events in the integrin signaling cascade, phosphorylation of FAK in the HLE-B3 cells following exposure to EF was examined by western blot analysis. Exposure to EF for 6, 12 and 24 h, while not affecting the levels of total FAK protein, resulted in a significant increase in the levels of pFAK by 2.09-fold (P<0.05), 2.84-fold (P<0.01) and 4.07-fold (P<0.01), respectively, compared with control cells (Fig. 3C).
Figure 3.
EF exposure activates integrin β1/FAK signaling. (A) Immunofluorescent staining for integrin β1 (red) in control group and EF-treated group for 24 h. Nuclei were counterstained with DAPI (blue). Scale bar, 25 µm. (B) Reverse transcription-quantitative polymerase chain reaction analysis of integrin β1 mRNA expression levels following 6, 12, and 24 h EF exposure. (C) Western blot analysis for the protein expression levels of integrin β1, pFAK and total FAK following 6, 12, and 24 h EF exposure. Data were presented as mean + standard deviation. *P<0.05 and **P<0.01 vs. control. EF, electric field; FAK, focal adhesion kinase; p, phosphorylated; -, cathode; +, anode.
Inhibition of integrin β1 affects abolishes the EF-induced EMT
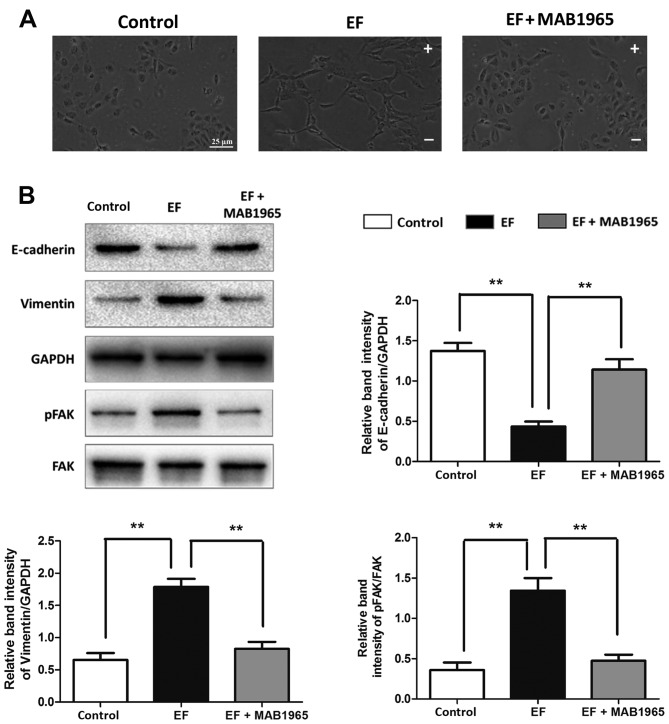
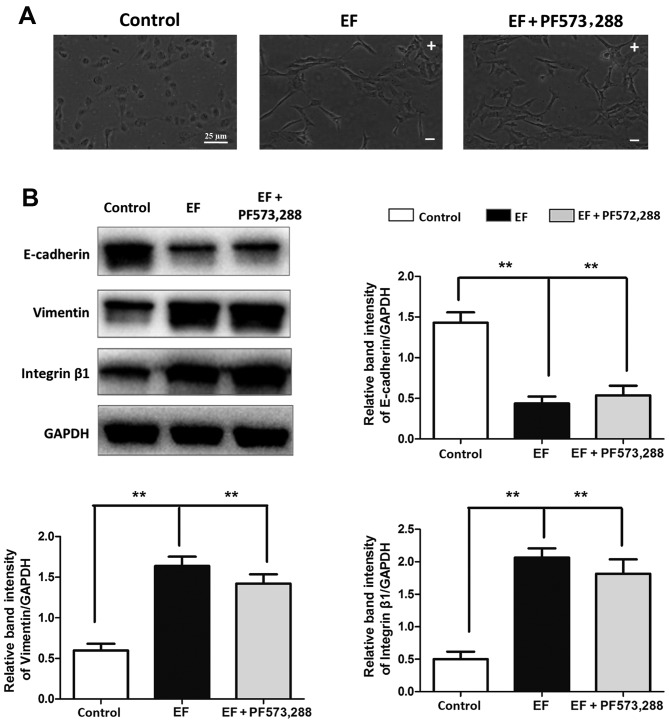
To further explore the role of integrin β1 and FAK in the EF-induced EMT in HLE-B3 cells, the integrin β1 specific blocking antibody MAB1965, and the small molecule inhibitor of pFAK PF-573,228, were used in the present study. When HLE-B3 cells were pretreated with MAB1965, EF exposure failed to affect their cell morphology, and the cells retained their epithelial-like cuboidal shape (Fig. 4A). Notably, the EF-induced changes in the protein expression levels of E-cadherin, Vimentin and the ratio of pFAK/FAK were almost completely reversed by MAB1965 pretreatment to the levels of the control untreated cells (Fig. 4B). By contrast, PF-573,288 pretreatment did not attenuate the EF-induced effects. Cells pretreated with PF-573,288 exhibited a fibroblast-like morphology following EF exposure, similar to the EF-exposed cells alone (Fig. 5A). Furthermore, the protein expression levels of E-cadherin, Vimentin and integrin β1 were not affected by PF-573,288 pretreatment compared with the EF-exposed cells alone (Fig. 5B).
Figure 4.
Effect of integrin β1 inhibition on EF-induced EMT. (A) Cell morphology was observed by microscopy in HLE-B3 cells following EF exposure, with or without pretreatment with the integrin β1 function blocking antibody MAB1965. Scale bar, 25 µm. (B) Western blot analysis of HLE-B3 cells following EF exposure, with or without pretreatment with MAB1965. Data were presented as mean + standard deviation. **P<0.01, with comparisons indicated by lines. EF, electric field; EMT, epithelial-mesenchymal transition; p, phosphorylated; FAK, focal adhesion kinase; -, cathode; +, anode.
Figure 5.
Effect of FAK inhibition on EF-induced EMT. (A) Cell morphology was observed by microscopy in HLE-B3 cells following EF exposure, with or without pretreatment with the pFAK specific inhibitor PF-573,288. Scale bar, 25 µm. (B) Western blot analysis of HLE-B3 cells following EF exposure, with or without pretreatment with PF-573,288. Data were presented as mean + standard deviation. **P<0.01, with comparisons indicated by lines. FAK, focal adhesion kinase; EF, electric field; EMT, epithelial-mesenchymal transition; p, phosphorylated; -, cathode; +, anode.
Discussion
Previous studies have reported that EFs have various effects on ocular cell behavior, including cell migration, division and proliferation (8,11,24,25). Wang et al (12) observed that LECs expanded and flattened in an applied EF. They proposed that EF may sequester growth factors, such as the fibroblast growth factor, and thus create gradients involved in EMT (12). In the present study, HLE-B3 cells were demonstrated to exhibit an elongated and fibroblast-like cell morphology following exposure to EF, confirming that EF can induce morphological changes in LECs under certain conditions. The results also demonstrated that expression of the epithelial marker E-cadherin was downregulated, while expression of the mesenchymal marker Vimentin was upregulated in HLE-B3 cells following EF exposure, suggesting that EF may induce EMT in LECs.
Previous studies have suggested that integrin β1 signaling may serve an important role in EMT. The engagement of integrin β1 with collagen type I results in loss of E-cadherin and indirect upregulation of N-cadherin, which directly leads to EMT (26,27). It has been reported that expression of integrin β1 is increased in the kidneys of patients with chronic tubulointerstitial fibrosis, and that blockage of integrin β1 signaling in an animal model of unilateral ureteral obstruction alleviates renal fibrosis (28). A previous study from our group has demonstrated that EF-induced migration in retinal pigment epithelial cells may involve the upregulation of integrin β1 subunit and the activation of FAK (29). The present study demonstrated that the expression of integrin β1 was upregulated by EF exposure, and that the blockage of integrin β1 significantly inhibited the expression of EMT markers in HLE-B3 cells. Taken together, the present results suggest that integrin signaling might be a critical mediator in the EMT transformation induced by EF.
Integrins are a large family of transmembrane, adhesion molecules on the cell surface. Their binding to components of the extracellular matrix and subsequent activation requires the action of kinases to enable signal transduction. FAK is a non-receptor tyrosine kinase, whose phosphorylation and tyrosine protein kinase activity is triggered by integrin clustering and ligation to initiate signal transduction (30,31). In the present study, blocking of integrin β1 reduced the activation of FAK and inhibited EMT in HLE-B3 cells following EF exposure. These results further demonstrated a functional relationship between integrin β1 and FAK in response to EF exposure. However, blockage of FAK with the PF-573,288 specific inhibitor did not attenuate the EF-induced EMT in HLE-B3 cells, suggesting that downstream regulators other than FAK may be involved in the role of integrin β1 in the EF-induced EMT. It is known that EMT is regulated by a variety of signals. For example, it has been reported that integrin β1 induces EMT through activating transforming growth factor-β (32,33). Therefore, the present results indicated that the EF-induced EMT in LECs may be mediated through, but not limited, the integrin β1-FAK signaling pathway.
In conclusion, EF exposure induced EMT in HLE-B3 cells, which may partially be mediated through activation of integrin β1-FAK signaling. EFs may therefore be crucial regulators of LEC behavior via inducing EMT following cataract surgery. Clinically, inhibition of this effect may provide new insights into the treatment of PCO.
Acknowledgements
This work was supported by the National Natural Science Foundation of China (grant no. 81200671).
References
- 1.Apple DJ, Solomon KD, Tetz MR, Assia EI, Holland EY, Legler UF, Tsai JC, Castaneda VE, Hoggatt JP, Kostick AM. Posterior capsule opacification. Surv Ophthalmol. 1992;37:73–116. doi: 10.1016/0039-6257(92)90073-3. [DOI] [PubMed] [Google Scholar]
- 2.Lundqvist B, Mönestam E. Ten-year longitudinal visual function and Nd: YAG laser capsulotomy rates in patients less than 65 years at cataract surgery. Am J Ophthalmol. 2010;149:238–244. doi: 10.1016/j.ajo.2009.08.029. [DOI] [PubMed] [Google Scholar]
- 3.Knight-Nanan D, O'Keefe M, Bowell R. Outcome and complications of intraocular lenses in children with cataract. J Cataract Refract Surg. 1996;22:730–736. doi: 10.1016/S0886-3350(96)80312-9. [DOI] [PubMed] [Google Scholar]
- 4.Marcantonio JM, Vrensen GF. Cell biology of posterior capsular opacification. Eye(Lond) 1999;13:484–488. doi: 10.1038/eye.1999.126. [DOI] [PubMed] [Google Scholar]
- 5.Yang Y, Ye Y, Lin X, Wu K, Yu M. Inhibition of pirfenidone on TGF-beta2 induced proliferation, migration and epithlial-mesenchymal transition of human lens epithelial cells line SRA01/04. PloS One. 2013;8:e56837. doi: 10.1371/journal.pone.0056837. [DOI] [PMC free article] [PubMed] [Google Scholar]
- 6.Savagner P. The epithelial-mesenchymal transition (EMT) phenomenon. Ann oncol. 2010;21(Suppl 7):S89–S92. doi: 10.1093/annonc/mdq292. [DOI] [PMC free article] [PubMed] [Google Scholar]
- 7.Kalluri R, Weinberg RA. The basics of epithelial-mesenchymal transition. J Clin Invest. 2009;119:1420–1428. doi: 10.1172/JCI39104. [DOI] [PMC free article] [PubMed] [Google Scholar]
- 8.Zhao M, Chalmers L, Cao L, Vieira AC, Mannis M, Reid B. Electrical signaling in control of ocular cell behaviors. Prog Retin Eye Res. 2012;31:65–88. doi: 10.1016/j.preteyeres.2011.10.001. [DOI] [PMC free article] [PubMed] [Google Scholar]
- 9.Mathias RT, Rae JL, Baldo GJ. Physiological properties of the normal lens. Physiol Rev. 1997;77:21–50. doi: 10.1152/physrev.1997.77.1.21. [DOI] [PubMed] [Google Scholar]
- 10.Wang E, Zhao M, Forrester JV, McCaig CD. Electric fields and MAP kinase signaling can regulate early wound healing in lens epithelium. Invest Ophthalmol Vis Sci. 2003;44:244–249. doi: 10.1167/iovs.02-0456. [DOI] [PubMed] [Google Scholar]
- 11.Wang E, Zhao M, Forrester JV, McCaig CD. Bi-directional migration of lens epithelial cells in a physiological electrical field. Exp Eye Res. 2003;76:29–37. doi: 10.1016/S0014-4835(02)00257-9. [DOI] [PubMed] [Google Scholar]
- 12.Wang E, Zhao M, Forrester JV, MCCaig CD. Re-orientation and faster, directed migration of lens epithelial cells in a physiological electric field. Exp Eye Res. 2000;71:91–98. doi: 10.1006/exer.2000.0858. [DOI] [PubMed] [Google Scholar]
- 13.Wang E, Reid B, Lois N, Forrester JV, McCaig CD, Zhao M. Electrical inhibition of lens epithelial cell proliferation: An additional factor in secondary cataract? Faseb J. 2005;19:842–844. doi: 10.1096/fj.04-2733fje. [DOI] [PMC free article] [PubMed] [Google Scholar]
- 14.Lois N, Reid B, Song B, Zhao M, Forrester J, McCaig C. Electric currents and lens regeneration in the rat. Exp Eye Res. 2010;90:316–323. doi: 10.1016/j.exer.2009.11.007. [DOI] [PubMed] [Google Scholar]
- 15.Gil D, Ciołczyk-Wierzbicka D, Dulińska-Litewka J, Zwawa K, McCubrey JA, Laidler P. The mechanism of contribution of integrin linked kinase (ILK) to epithelial-mesenchymal transition (EMT) Adv Enzyme Regul. 2011;51:195–207. doi: 10.1016/j.advenzreg.2010.09.005. [DOI] [PubMed] [Google Scholar]
- 16.Walker J, Menko AS. Integrins in lens development and disease. Exp Eye Res. 2009;88:216–225. doi: 10.1016/j.exer.2008.06.020. [DOI] [PMC free article] [PubMed] [Google Scholar]
- 17.Borok Z. Role for alpha3 integrin in EMT and pulmonary fibrosis. J Clin Invest. 2009;119:7–10. doi: 10.1172/JCI38084. [DOI] [PMC free article] [PubMed] [Google Scholar]
- 18.Xu B, Song G, Ju Y. Effect of focal adhesion kinase on the regulation of realignment and tenogenic differentiation of human mesenchymal stem cells by mechanical stretch. Connect Tissue Res. 2011;52:373–379. doi: 10.3109/03008207.2010.541961. [DOI] [PubMed] [Google Scholar]
- 19.Slack-Davis JK, Martin KH, Tilghman RW, Iwanicki M, Ung EJ, Autry C, Luzzio MJ, Cooper B, Kath JC, Roberts WG, Parsons JT. Cellular characterization of a novel focal adhesion kinase inhibitor. J Biol Chem. 2007;282:14845–14852. doi: 10.1074/jbc.M606695200. [DOI] [PubMed] [Google Scholar]
- 20.Han J, Yan XL, Han QH, Li Y, Zhu J, Hui YN. Electric fields contribute to directed migration of human retinal pigment epithelial cells via interaction between F-actin and beta1 integrin. Curr Eye Res. 2009;34:438–446. doi: 10.1080/02713680902879033. [DOI] [PubMed] [Google Scholar]
- 21.Zhao M, Agius-Fernandez A, Forrester JV, McCaig CD. Orientation and directed migration of cultured corneal epithelial cells in small electric fields are serum dependent. J Cell Sci. 1996;109:1405–1414. doi: 10.1242/jcs.109.6.1405. [DOI] [PubMed] [Google Scholar]
- 22.Livak KJ, Schmittgen TD. Analysis of relative gene expression data using real-time quantitative PCR and the 2(−Delta Delta C(T)) Method. Methods. 2001;25:402–408. doi: 10.1006/meth.2001.1262. [DOI] [PubMed] [Google Scholar]
- 23.Kalluri R, Neilson EG. Epithelial-mesenchymal transition and its implications for fibrosis. J Clin Invest. 2003;112:1776–1784. doi: 10.1172/JCI200320530. [DOI] [PMC free article] [PubMed] [Google Scholar]
- 24.Gamboa OL, Pu J, Townend J, Forrester JV, Zhao M, McCaig C, Lois N. Electrical estimulation of retinal pigment epithelial cells. Exp Eye Res. 2010;91:195–204. doi: 10.1016/j.exer.2010.04.018. [DOI] [PubMed] [Google Scholar]
- 25.Zhao M, McCaig CD, Agius-Fernandez A, Forrester JV, Araki-Sasaki K. Human corneal epithelial cells reorient and migrate cathodally in a small applied electric field. Curr Eye Res. 1997;16:973–984. doi: 10.1076/ceyr.16.10.973.9014. [DOI] [PubMed] [Google Scholar]
- 26.Shintani Y, Fukumoto Y, Chaika N, Svoboda R, Wheelock MJ, Johnson KR. Collagen I-mediated up-regulation of N-cadherin requires cooperative signals from integrins and discoidin domain receptor 1. J Cell Biol. 2008;180:1277–1289. doi: 10.1083/jcb.200708137. [DOI] [PMC free article] [PubMed] [Google Scholar]
- 27.Koenig A, Mueller C, Hasel C, Adler G, Menke A. Collagen type I induces disruption of E-cadherin-mediated cell-cell contacts and promotes proliferation of pancreatic carcinoma cells. Cancer Res. 2006;66:4662–4671. doi: 10.1158/0008-5472.CAN-05-2804. [DOI] [PubMed] [Google Scholar]
- 28.Yeh YC, Wei WC, Wang YK, Lin SC, Sung JM, Tang MJ. Transforming growth factor-{beta}1 induces Smad3-dependent {beta}1 integrin gene expression in epithelial-to-mesenchymal transition during chronic tubulointerstitial fibrosis. Am J Pathol. 2010;177:1743–1754. doi: 10.2353/ajpath.2010.091183. [DOI] [PMC free article] [PubMed] [Google Scholar]
- 29.Han J, Yan XL, Han QH, Li YJ, Du ZJ, Hui YN. Integrin β1 subunit signaling is involved in the directed migration of human retinal pigment epithelial cells following electric field stimulation. Ophthalmic Res. 2011;45:15–22. doi: 10.1159/000313552. [DOI] [PubMed] [Google Scholar]
- 30.Santos AR, Corredor RG, Obeso BA, Trakhtenberg EF, Wang Y, Ponmattam J, Dvoriantchikova G, Ivanov D, Shestopalov VI, Goldberg JL, et al. β1 integrin-focal adhesion kinase (FAK) signaling modulates retinal ganglion cell (RGC) survival. PloS One. 2012;7:e48332. doi: 10.1371/journal.pone.0048332. [DOI] [PMC free article] [PubMed] [Google Scholar]
- 31.Yao K, Tan J, Ye P, Wang K, Xu W, ShenTu X, Tang X. Integrin beta1-mediated signaling is involved in transforming growth factor-beta2-promoted migration in human lens epithelial cells. Mol Vis. 2007;13:1769–1776. [PubMed] [Google Scholar]
- 32.Mamuya FA, Duncan MK. aV integrins and TGF-β-induced EMT: A circle of regulation. J Cell Mol Med. 2012;16:445–455. doi: 10.1111/j.1582-4934.2011.01419.x. [DOI] [PMC free article] [PubMed] [Google Scholar]
- 33.Parvani JG, Galliher-Beckley AJ, Schiemann BJ, Schiemann WP. Targeted inactivation of β1 integrin induces β3 integrin switching, which drives breast cancer metastasis by TGF-β. Mol Biol Cell. 2013;24:3449–3459. doi: 10.1091/mbc.E12-10-0776. [DOI] [PMC free article] [PubMed] [Google Scholar]


