Abstract
The purpose of the present study was to screen the prognostic targets for breast cancer based on a co-expression modules analysis. The microarray dataset GSE73383 was downloaded from the Gene Expression Omnibus (GEO) database, including 15 breast cancer samples with good prognosis and 9 breast cancer samples with poor prognosis. The differentially expressed genes (DEGs) were identified with the limma package. The Database for Annotation, Visualization and Integrated Discovery was used to perform Gene Ontology (GO) and Kyoto Encyclopedia of Genes and Genomes (KEGG) pathway enrichment analysis. Furthermore, the co-expression analysis of DEGs was conducted with weighted correlation analysis. The interaction associations were analyzed with the Human Protein Reference Database and BioGRID. The protein-protein interactions (PPI) network was constructed and visualized by Cytoscape software. A total of 491 DEGs were identified in breast cancer samples with poor prognosis compared with those with good prognosis, and they were enriched in 85 GO terms and 4 KEGG pathways. 368 DEGs were co-expressed with others, and they were clustered into 10 modules. Module 6 was the most relevant to the clinical features, and 21 genes and 273 interaction pairs were selected out. Abnormal expression levels of required for meiotic nuclear division 5 homolog A (RMND5A) and angiopoietin-like protein 1 (ANGPTL1) were associated with a poor prognosis. It was indicated that SWI/SNF related, matrix associated, actin dependent regulator of chromatin, subfamily D, member 1, SWI/SNF related, matrix associated, actin dependent regulator of chromatin, subfamily D, member 1, dihydropyrimidinase-like 2, RMND5A and ANGPTL1 were potential prognostic markers in breast cancer, and the cell cycle may be involved in the regulation of breast cancer.
Keywords: breast cancer, prognosis, co-expression modules analysis
Introduction
Breast cancer is the uncontrolled growth of breast cells, which develops from breast tissue. It is one of the most common cancers among the female malignant tumors in worldwide, that affects about 12% of global women (1). In North America and Western Europe, breast cancer is the most common malignancy and the second most common cause of cancer-associated death for women (2). It was estimated that there were 246,660 new cases and 40,450 mortalities from breast cancer in the US in 2016 (3). Morbidity and mortality increase year by year, particularly in Southeast Asia (4). Patients with breast cancer experience various symptoms, including a lump in the breast, fluid coming from the nipple, dimpling of the skin and a change in breast shape (5). Breast cancer is usually treated with surgery, which may be followed by chemotherapy or radiotherapy, and a multidisciplinary approach is preferable, such as surgery, radiotherapy, chemotherapy and hormone therapy (6). Breast cancers that are estrogen receptor positive (ER+) and human epidermal growth factor receptor-2 positive (HER2+) can be treated with agents that target these receptors (such as tamoxifen, toremifene, and fulvestrant for ER+ breast cancers and trastuzumab, pertuzumab and lapatinib for HER2+ breast cancers) (7). Unfortunately, the prognosis is still unsatisfactory, especially in advanced patients. Prognostic factors of breast cancer mainly depend on stage (i.e., tumor size, location, and metastasis), grade, recurrence, age and health of the patient. The stage of breast cancer has a greater effect on the prognosis than the other factors, and it is considered the most important component of traditional classification methods (8).
Breast cancer is a complex systemic disease with multi-genes involved, and a series of abnormal changes of genome which participate in the regulation of cell growth, differentiation and apoptosis, may affect the prognosis. Some prognostic markers have been reported, such as, INPP4b, KLF4, NANOG, OXYTAM and EZH2 (9,10). However, the ability to predict the metastatic behavior in breast cancer is still limited, and the clinical outcome of breast cancer remains to be improved. In the present study, breast cancer samples with different prognosis were analyzed via microarray analysis, in order to find more prognostic markers and provide some clues for the metastatic behavior in breast cancer.
Materials and methods
Microarray data
The expression microarray dataset GSE73383 was downloaded from the Gene Expression Omnibus (www.ncbi.nlm.nih.gov/geo) database. In this profile, there was a subset of 24 breast cancer samples comprising 15 samples that remained free of disease after surgery (good prognosis) and 9 samples that developed metastasis (poor prognosis). In this study, the 24 samples were used to identify candidate biomarkers associated with the prognosis of breast cancer, which were detected with the GPL11010 CodeLink Human Whole Genome Bioarray platform (Applied Microarrays, Inc., Tempe, AZ, USA).
Data pre-processing and identification of differentially expressed genes
The original data were converted into recognizable format in R, and the preprocess Core package was used for the normalization. Afterwards, the limma (11) package of R was used to identify the differentially expressed genes (DEGs) in the 9 samples with poor prognosis compared with the 15 samples with good prognosis. Furthermore, the DEGs were selected out according to the criteria: |log (fold change)|>1 and P<0.05.
Functional and pathway enrichment analysis
The Database for Annotation, Visualization and Integrated Discovery (david.ncifcrf.gov) (12) is a widely-used web-based tool for functional and pathway enrichment analysis. Here, it was used to perform Gene Ontology (GO; www.geneontology.org) and Kyoto Encyclopedia of Genes and Genomes (KEGG; www.genome.jp/kegg) pathway enrichment analysis of DEGs. GO terms and KEGG pathways were selected out with a P-value <0.05.
Module analysis
Weighted correlation analysis (WGCNA) version 1.13 (www.genetics.ucla.edu/labs/horvath/CoexpressionNetwork/Rpackages/WGCNA), an R software package, is a comprehensive collection of R functions for performing various aspects of weighted correlation network analysis (13). In the present study, the co-expression analysis of DEGs was conducted with WGCNA. Afterwards, the co-expression modules were obtained, and the relationships between every module and clinical features were calculated.
Construction of the protein-protein interactions network
The Human Protein Reference Database (HPRD) is an object database that integrates a wealth of information relevant to the function of human proteins in health and disease (14). The Biological General Repository for Interaction Datasets (BioGRID) is a curated biological database of protein-protein interactions, genetic interactions, chemical interactions and post-translational modifications (15). The module which had the closest correction with the prognosis was analyzed with HPRD version 9 (www.hprd.org) and BioGRID version 2.0 (thebiogrid.org) software. In addition, genes in the above module and their associated interaction pairs were selected out. In addition, the protein-protein interactions (PPI) network was constructed and visualized by Cytoscape version 3.0.1 (16) software. Nodes were screened out in the PPI network with degree ≥ 1, and ‘degree’ represented the connections with other nodes. In addition, the associations between certain nodes and the prognosis of breast cancer were analyzed using the online tool kmplot, version 1.2.0 (edu.kde.org/kmplot), which is a mathematical function plotter for the KDE-Desktop, and can be used to plot different functions simultaneously and combine their function terms to build new functions.
Results
DEGs
A total of 491 DEGs (316 up- and 175 downregulated) were identified in breast cancer samples with poor prognosis compared with those with good prognosis. The top 30 most significant DEGs are presented in Table I.
Table I.
Top 30 most significant DEGs in breast cancer samples with poor prognosis compared with those with good prognosis.
| Gene | P-value | LogFC | Gene | P-value | LogFC |
|---|---|---|---|---|---|
| CHRDL2 | 5.74E-05 | −2.95172 | CSH1 | 0.003025 | 1.197913 |
| ERP27 | 0.000228 | −1.67607 | CPT1A | 0.003214 | 1.239627 |
| PRSS21 | 0.000235 | −1.98312 | LOC105370832 | 0.003264 | −1.71612 |
| LOC100129447 | 0.000542 | −3.5659 | IBSP | 0.003517 | 1.247671 |
| TRIM37 | 0.001246 | 1.758675 | TMEM185B | 0.00362 | 1.212002 |
| TTF2 | 0.001416 | 1.823105 | PPM1D | 0.003634 | 1.3262 |
| ANKRD60 | 0.001461 | −2.87722 | PDP1 | 0.003666 | 2.083321 |
| HMGB3 | 0.001635 | 1.915918 | CDC45 | 0.003698 | 2.059617 |
| NBR1 | 0.001681 | −1.71848 | NEB | 0.003822 | 1.118614 |
| FKBP1B | 0.001731 | 1.198828 | PDE1B | 0.003835 | −1.64844 |
| MGC16275 | 0.002375 | 1.402384 | ZNF264 | 0.004253 | −1.65155 |
| C9orf64 | 0.0025 | 1.277235 | GTSE1 | 0.004292 | 1.209348 |
| OPRK1 | 0.002525 | 1.891967 | HIST1H3B | 0.004466 | 1.522681 |
| LGI4 | 0.002658 | −1.67571 | EMX2 | 0.004667 | −1.25036 |
| HIST1H2BE | 0.002916 | 1.817212 | FAM9C | 0.004707 | 1.524613 |
DEGs, differentially expressed genes; FC, fold-change.
GO terms and KEGG pathways
The above DEGs were enriched in 85 GO terms and 4 KEGG pathways. The top 15 GO terms were presented in Table II, including cell cycle phase, chromosome segregation and nuclear division. Furthermore, the 4 KEGG pathways were cell cycle, neuroactive ligand-receptor interaction, oocyte meiosis and progesterone-mediated oocyte maturation.
Table II.
Top 15 most significant GO terms of DEGs.
| Category | Term | Count | P-value |
|---|---|---|---|
| BP | GO:0022403~cell cycle phase | 29 | 2.07E-07 |
| BP | GO:0000087~M phase of mitotic cell cycle | 20 | 7.28E-07 |
| BP | GO:0000278~mitotic cell cycle | 26 | 9.76E-07 |
| BP | GO:0007059~chromosome segregation | 12 | 1.84E-06 |
| BP | GO:0007067~mitosis | 19 | 2.41E-06 |
| BP | GO:0000280~nuclear division | 19 | 2.41E-06 |
| BP | GO:0022402~cell cycle process | 32 | 4.12E-06 |
| BP | GO:0048285~organelle fission | 19 | 4.25E-06 |
| BP | GO:0000279~M phase | 23 | 5.26E-06 |
| BP | GO:0007049~cell cycle | 38 | 1.18E-05 |
| CC | GO:0000940~outer kinetochore of condensed chromosome | 5 | 3.64E-05 |
| BP | GO:0000075~cell cycle checkpoint | 11 | 3.64E-05 |
| BP | GO:0051301~cell division | 20 | 3.92E-05 |
| BP | GO:0007093~mitotic cell cycle checkpoint | 8 | 4.35E-05 |
| CC | GO:0000777~condensed chromosome kinetochore | 9 | 6.51E-05 |
GO, Gene Ontology; DEGs, differentially expressed genes; BP, biological process; CC, Cellular Component.
Modules
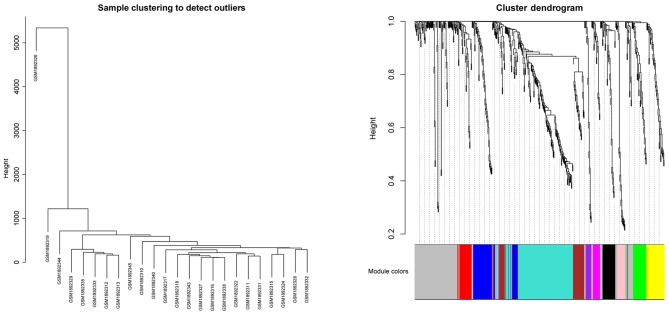
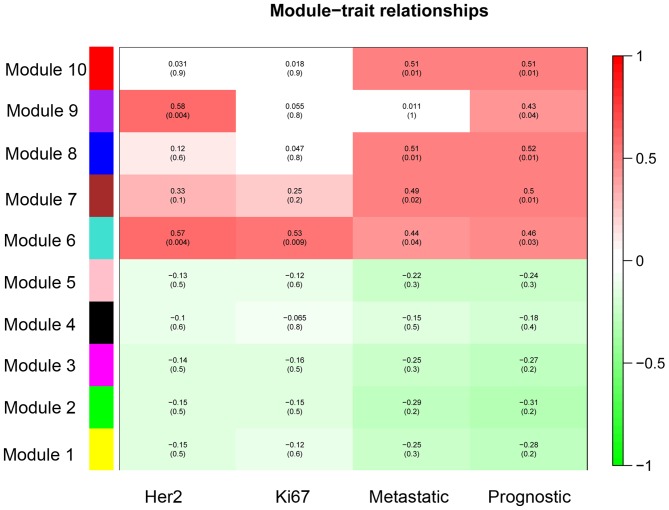
A total of 368 DEGs were co-expressed with others and they were clustered into 10 modules (recorded as Module 1–10). The cluster graph of samples and genes are presented in Fig. 1. From the sample cluster graph, GSM1892326 was identified as an outlier; thus, it was excluded in the further module analysis. The associations between every module and clinical features (Her 2, Ki67, metastasis and prognosis) are presented in Fig. 2. Module 6 was the most relevant to the clinical features (Fig. 2). There were 26 DEGs (23 over-expressed and 3 low-expressed) in Module 6, and the associations between their expression and the prognosis of breast cancer are presented in Fig. 3 (‘Pgood’ represents good prognosis and ‘Ppoor’ represents poor prognosis).
Figure 1.
Cluster graph of samples and genes.
Figure 2.
Associations between every module and clinical features.
Figure 3.
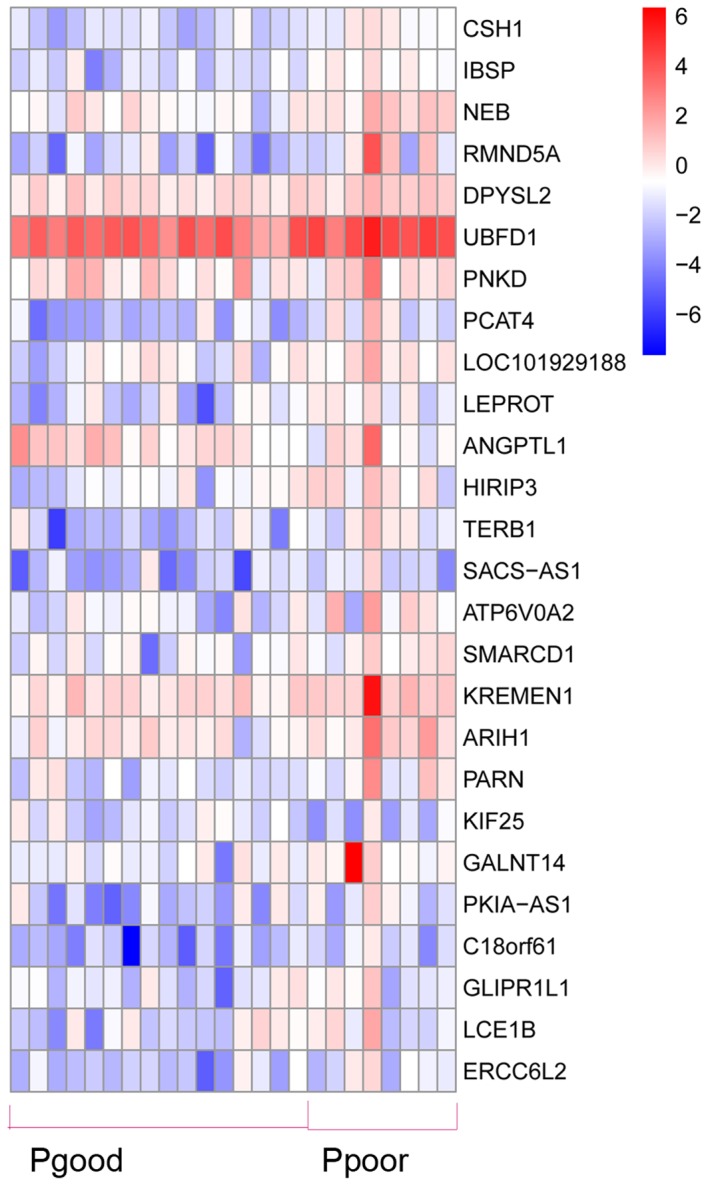
Associations between gene expression and prognosis. Pgood, good prognosis; Ppoor, poor prognosis.
PPI network
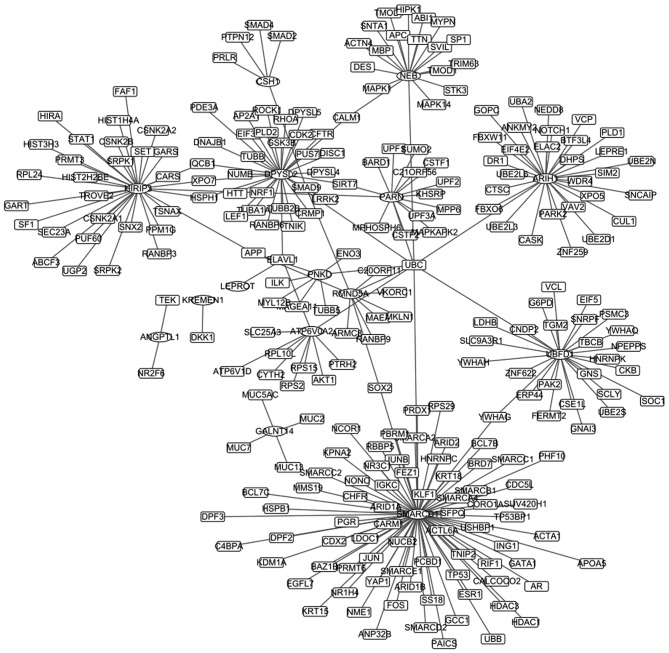
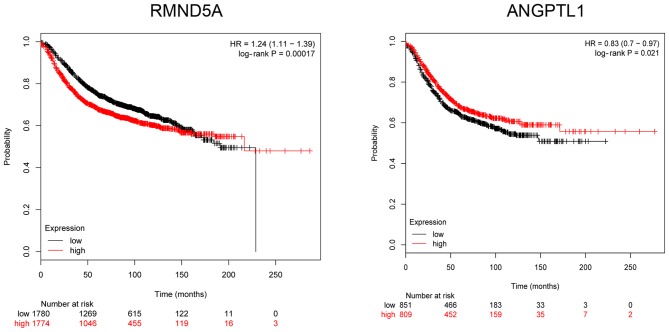
Module 6 was analyzed with HPRD and BioGRID, and 21 genes and 273 interaction pairs were selected out. Afterwards, the PPI network was established based on the above interactions, including 266 nodes, and is presented in Fig. 4. The top 20 nodes are presented in Table III. One of the over-expressed gene in Module 6, required for meiotic nuclear division 5 homolog A (RMND5A), and the low-expressed gene angiopoietin-like protein 1 (ANGPTL1) were screened out, and the association between them and prognosis were analyzed with the online tool of kmplot. Survival curves are presented in Fig. 5. It revealed that abnormal expression levels (low- and over-expression) of RMND5A and ANGPTL1 were associated with a poor prognosis.
Figure 4.
Protein-protein interaction network.
Table III.
Top 20 nodes in the PPI network.
| Gene | Degree | Gene | Degree |
|---|---|---|---|
| SMARCD1 | 78 | PNKD | 7 |
| DPYSL2 | 32 | CSH1 | 5 |
| HIRIP3 | 32 | GALNT14 | 4 |
| ARIH1 | 30 | APP | 3 |
| UBFD1 | 27 | ELAVL1 | 3 |
| NEB | 19 | NRF1 | 3 |
| PARN | 15 | ANGPTL1 | 2 |
| ATP6V0A2 | 10 | CALM1 | 2 |
| RMND5A | 10 | HSPH1 | 2 |
| UBC | 9 | IQCB1 | 2 |
PPI, protein-protein interaction.
Figure 5.
Survival curve of RMND5A and ANGPTL1. RMND5A, required for meiotic nuclear division 5 homolog A; ANGPTL1, angiopoietin-like protein 1.
Discussion
DEGs were identified in breast cancer samples with poor prognosis compared with those with good prognosis, and they were mainly enriched certain cell cycle- and mitosis-associated biological processes. At present, research has indicated that the cell cycle is closely associated with the outcome of breast cancer. Certain cell cycle markers (for example cyclin B1) are differentially expressed in benign and malignant papillary breast lesions (17). Over-expression of a novel cell cycle regulator ecdysoneless predicted a poorer survival in Her2/neu over-expressing breast cancer patients. Oxygenase domain-containing protein 1 is required for breast cancer cell proliferation and is involved in poor prognosis of breast cancer (18). Therefore, it is important to intervene the progression, prognosis and drug efficacy in breast cancer by regulating or modulating some cell cycle phases or cyclin proteins. The transcription factor deleted in esophageal cancer could regulate breast cancer cell proliferation by stabilizing cyclin E protein and delaying the progression of cell cycle S phase (19). Phosphatase and tensin homolog (PTEN) was a well-known tumor suppressor gene and is frequently mutated or lost in breast cancer. Insufficiency of PTEN could modulate ER+ breast cancer cell cycle progression and increase cell growth, and thus is associated with advanced breast cancer and poor prognosis of breast cancer patients (20). Nexrutine inhibits survival and induces G1 cell cycle arrest, which might provide a novel approach for protection against breast cancer (21). Mitosis is the most important factor in cell the cycle, which is a complicated and refined adjusting process. However, relatively few studies have reported that mitosis is a relevant biological process involved in the prognosis of breast cancer. Mitosis counts in histopathological slides serve a crucial role for invasive breast cancer grading (22,23). To summarize, the biological processes of cell cycle and mitosis are closely involved in the prognosis of breast cancer, which might provide novel insights into the clinical therapy for breast cancer patients. Furthermore, it was possible to reveal more prognostic biomarkers by exporting primarily involved and regulatory genes.
In the present study, DEGs were enriched in 4 KEGG pathways, namely, cell cycle, neuroactive ligand-receptor interaction, oocyte meiosis and progesterone-mediated oocyte maturation. The neuroactive ligand-receptor interaction pathway mainly serves roles in neurological illness and injury, such as Parkinson's Disease (24). Huan et al (25) identified time courses of genes that were either stimulated or inhibited by estradiol (E2) in human breast cancer cells, and results showed that the changes were mainly enriched in neuroactive ligand-receptor interaction at the 24 h time point. A study of the hub subnetwork in breast cancer revealed that oocyte meiosis pathways were significant subnetworks, in which hub nodes mostly distributed (26). Another bioinformatics analysis reported that the pathogenesis of breast cancer was associated with oocyte meiosis and progesterone-mediated oocyte maturation (27). In this study, it was indicated the prognosis of breast cancer was associated with cell cycle, neuroactive ligand-receptor interaction, oocyte meiosis and progesterone-mediated oocyte maturation. However, further laboratory and clinical researches are required to verify this.
In the present study, SWI/SNF related, matrix associated, actin dependent regulator of chromatin, subfamily D, member 1 (SMARCD1) and dihydropyrimidinase-like 2 (DPYSL2) were the top two nodes in the PPI network. SMARCD1, a regulator gene of embryonic stem cell differentiation, was considered as one of the driver mutations in breast cancer (28,29). Furthermore, the attenuated expression of SMARCD1 could inhibit breast cancer cell proliferation in vitro and in mouse tumor xenografts (30). DPYSLs are a family of proteins developmentally regulated during maturation of the nervous system, and mainly comprising of DPYSL1, DPYSL2 and DPYSL3. DPYSL2 encodes the DPYSL2 protein, which is a target gene of gastric cancer (31). DPYSL2 is identified to increase with selenomethionine treatment in colon cancer (32). In the present study, it was revealed that SMARCD1 and DPYSL2 may be prognostic markers in breast cancer, although further studies are required to confirm this. Furthermore, in the present study, abnormal expression levels of RMND5A and ANGPTL1 were associated with poor prognosis in breast cancer patients. RMND5A is involved in microtubule dynamics, cell migration, nucleokinesis and chromosome segregation (33). However, few reports have revealed the association between RMND5A and breast cancer. ANGPTL1 encodes ANGPTL1 protein, which targets endothelial cells and affects tumor cell behavior. A previous study reported that ANGPTL1 represses lung cancer cell motility (34). The results of the present study revealed that RMND5A and ANGPTL1 are novel potential prognostic markers in breast cancer.
In conclusion, the results of the present study indicated that SMARCD1, DPYSL2, RMND5A and ANGPTL1 are potential prognostic markers in breast cancer. Furthermore, cell cycle, mitosis, neuroactive ligand-receptor interaction, oocyte meiosis and progesterone-mediated oocyte maturation may be involved in the regulation of breast cancer.
References
- 1.McGuire A, Brown JA, Malone C, Mclaughlin R, Kerin MJ. Effects of age on the detection and management of breast cancer. Cancers. 2015;7:908–929. doi: 10.3390/cancers7020815. [DOI] [PMC free article] [PubMed] [Google Scholar]
- 2.Sciubba DM, Goodwin CR, Yurter A, Ju D, Gokaslan ZL, Fisher C, Rhines LD, Fehlings MG, Fourney DR, Mendel E, et al. A systematic review of clinical outcomes and prognostic factors for patients undergoing surgery for spinal metastases secondary to breast cancer. Global Spine J. 2016;6:482–496. doi: 10.1055/s-0035-1564807. [DOI] [PMC free article] [PubMed] [Google Scholar]
- 3.Siegel RL, Miller KD, Jemal A. Cancer statistics, 2016. CA Cancer J Clin. 2016;66:7–30. doi: 10.3322/caac.21332. [DOI] [PubMed] [Google Scholar]
- 4.GBD 2013 Mortality and Causes of Death Collaborators: Global, regional, and national age-sex specific all-cause and cause-specific mortality for 240 causes of death, 1990–2013: A systematic analysis for the Global Burden of Disease Study 2013. Lancet. 2015;385:117–171. doi: 10.1016/S0140-6736(14)61682-2. [DOI] [PMC free article] [PubMed] [Google Scholar]
- 5.Golubnitschaja O, Debald M, Yeghiazaryan K, Kuhn W, Pešta M, Costigliola V, Grech G. Breast cancer epidemic in the early twenty-first century: Evaluation of risk factors, cumulative questionnaires and recommendations for preventive measures. Tumour Biol. 2016;37:12941–12957. doi: 10.1007/s13277-016-5168-x. [DOI] [PubMed] [Google Scholar]
- 6.Saini KS, Taylor C, Ramirez AJ, Palmieri C, Gunnarsson U, Schmoll HJ, Dolci SM, Ghenne C, Metzger-Filho O, Skrzypski M, et al. Role of the multidisciplinary team in breast cancer management: Results from a large international survey involving 39 countries. Ann Oncol. 2012;23:853–859. doi: 10.1093/annonc/mdr352. [DOI] [PubMed] [Google Scholar]
- 7.Krohe M, Hao Y, Lamoureux RE, Galipeau N, Globe D, Foley C, Mazar I, Solomon J, Shields AL. Patient-reported outcomes in metastatic breast cancer: A review of industry-sponsored clinical trials. Breast Cancer (Auckl) 2016;10:93–102. doi: 10.4137/BCBCR.S39385. [DOI] [PMC free article] [PubMed] [Google Scholar]
- 8.Yang Y, Im SA, Keam B, Lee KH, Kim TY, Suh KJ, Ryu HS, Moon HG, Han SW, Oh DY, et al. Prognostic impact of AJCC response criteria for neoadjuvant chemotherapy in stage II/III breast cancer patients: Breast cancer subtype analyses. BMC Cancer. 2016;16:515. doi: 10.1186/s12885-016-2500-1. [DOI] [PMC free article] [PubMed] [Google Scholar]
- 9.Lang JE, Wecsler JS, Press MF, Tripathy D. Molecular markers for breast cancer diagnosis, prognosis and targeted therapy. J Surg Oncol. 2015;111:81–90. doi: 10.1002/jso.23732. [DOI] [PubMed] [Google Scholar]
- 10.Boyle DP, McCourt CM, Matchett KB, Salto-Tellez M. Molecular and clinicopathological markers of prognosis in breast cancer. Expert Rev Mol Diagn. 2013;13:481–498. doi: 10.1586/erm.13.29. [DOI] [PubMed] [Google Scholar]
- 11.Smyth GK. Linear models and empirical bayes methods for assessing differential expression in microarray experiments. Stat Appl Genet Mol Biol. 2004;3 doi: 10.2202/1544-6115.1027. Article3. [DOI] [PubMed] [Google Scholar]
- 12.Dennis G, Jr, Sherman BT, Hosack DA, Yang J, Gao W, Lane HC, Lempicki RA. DAVID: Database for Annotation, Visualization, and Integrated Discovery. Genome Biol. 2003;4:P3. doi: 10.1186/gb-2003-4-5-p3. [DOI] [PubMed] [Google Scholar]
- 13.Langfelder P, Horvath S. WGCNA: An R package for weighted correlation network analysis. BMC Bioinformatics. 2008;9:559. doi: 10.1186/1471-2105-9-559. [DOI] [PMC free article] [PubMed] [Google Scholar]
- 14.Peri S, Navarro JD, Amanchy R, Kristiansen TZ, Jonnalagadda CK, Surendranath V, Niranjan V, Muthusamy B, Gandhi TK, Gronborg M, et al. Development of Human Protein Reference Database as an Initial Platform for Approaching Systems Biology in Humans. Genome Res. 2003;13:2363–2371. doi: 10.1101/gr.1680803. [DOI] [PMC free article] [PubMed] [Google Scholar]
- 15.Breitkreutz BJ, Stark C, Tyers M. The GRID: The general repository for interaction datasets. Genome Biol. 2002;3 doi: 10.1186/gb-2002-3-12-preprint0013. PREPRINT0013. [DOI] [PubMed] [Google Scholar]
- 16.Shannon P, Markiel A, Ozier O, Baliga NS, Wang JT, Ramage D, Amin N, Schwikowski B, Ideker T. Cytoscape: A software environment for integrated models of biomolecular interaction networks. Genome Res. 2003;13:2498–2504. doi: 10.1101/gr.1239303. [DOI] [PMC free article] [PubMed] [Google Scholar]
- 17.Loh SF, Cooper C, Selinger CI, Barnes EH, Chan C, Carmalt H, West R, Gluch L, Beith JM, Caldon CE, O'Toole S. Cell cycle marker expression in benign and malignant intraductal papillary lesions of the breast. J Clin Pathol. 2015;68:187–191. doi: 10.1136/jclinpath-2014-202331. [DOI] [PubMed] [Google Scholar]
- 18.Kim JH, Lee SM, Lee JH, Chun S, Kang BH, Kwak S, Roe JS, Kim TW, Kim H, Kim WH, et al. OGFOD1 is required for breast cancer cell proliferation and is associated with poor prognosis in breast cancer. Oncotarget. 2015;6:19528–19541. doi: 10.18632/oncotarget.3683. [DOI] [PMC free article] [PubMed] [Google Scholar]
- 19.Bi H, Li S, Qu X, Wang M, Bai X, Xu Z, Ao X, Jia Z, Jiang X, Yang Y, Wu H. DEC1 regulates breast cancer cell proliferation by stabilizing cyclin E protein and delays the progression of cell cycle S phase. Cell Death Dis. 2015;6:e1891. doi: 10.1038/cddis.2015.247. [DOI] [PMC free article] [PubMed] [Google Scholar]
- 20.Chiang KC, Chen HY, Hsu SY, Pang JH, Wang SY, Hsu JT, Yeh TS, Chen LW, Kuo SF, Sun CC, et al. PTEN insufficiency modulates ER+ breast cancer cell cycle progression and increases cell growth in vitro and in vivo. Drug Des Devel Ther. 2015;9:4631–4638. doi: 10.2147/DDDT.S86184. [DOI] [PMC free article] [PubMed] [Google Scholar]
- 21.Yan G, Lanza-Jacoby S, Wang C. Nexrutine inhibits survival and induces G1 cell cycle arrest, which is associated with apoptosis or autophagy depending on the breast cancer cell line. Nut Cancer. 2014;66:506–516. doi: 10.1080/01635581.2013.780627. [DOI] [PubMed] [Google Scholar]
- 22.Paul A, Mukherjee DP. Mitosis detection for invasive breast cancer grading in histopathological images. IEEE Trans Image Process. 2015;24:4041–4054. doi: 10.1109/TIP.2015.2460455. [DOI] [PubMed] [Google Scholar]
- 23.Irshad H, Gouaillard A, Roux L, Racoceanu D. Multispectral band selection and spatial characterization: Application to mitosis detection in breast cancer histopathology. Comput Med Imaging Graph. 2014;38:390–402. doi: 10.1016/j.compmedimag.2014.04.003. [DOI] [PubMed] [Google Scholar]
- 24.Kong Y, Liang X, Liu L, Zhang D, Wan C, Gan Z, Yuan L. High throughput sequencing identifies MicroRNAs mediating α-synuclein toxicity by targeting neuroactive-ligand receptor interaction pathway in early stage of Drosophila parkinson's disease model. PLoS One. 2015;10:e0137432. doi: 10.1371/journal.pone.0137432. [DOI] [PMC free article] [PubMed] [Google Scholar]
- 25.Huan J, Wang L, Xing L, Qin X, Feng L, Pan X, Zhu L. Insights into significant pathways and gene interaction networks underlying breast cancer cell line MCF-7 treated with 17β-Estradiol (E2) Gene. 2014;533:346–355. doi: 10.1016/j.gene.2013.08.027. [DOI] [PubMed] [Google Scholar]
- 26.Zhuang DY, Jiang L, He QQ, Zhou P, Yue T. Identification of hub subnetwork based on topological features of genes in breast cancer. Int J Mol Med. 2015;35:664–674. doi: 10.3892/ijmm.2014.2057. [DOI] [PMC free article] [PubMed] [Google Scholar]
- 27.Wu D, Han B, Guo L, Fan Z. Molecular mechanisms associated with breast cancer based on integrated gene expression profiling by bioinformatics analysis. J Obstet Gynaecol. 2016;36:615–621. doi: 10.3109/01443615.2015.1127902. [DOI] [PubMed] [Google Scholar]
- 28.Stephens PJ, Tarpey PS, Davies H, Van Loo P, Greenman C, Wedge DC, Nik-Zainal S, Martin S, Varela I, Bignell GR, et al. The landscape of cancer genes and mutational processes in breast cancer. Nature. 2012;486:400–404. doi: 10.1038/nature11017. [DOI] [PMC free article] [PubMed] [Google Scholar]
- 29.Alajem A, Biran A, Harikumar A, Sailaja BS, Aaronson Y, Livyatan I, Nissim-Rafinia M, Sommer AG, Mostoslavsky G, Gerbasi VR, et al. Differential association of chromatin proteins identifies BAF60a/SMARCD1 as a regulator of embryonic stem cell differentiation. Cell Rep. 2015;10:2019–2031. doi: 10.1016/j.celrep.2015.02.064. [DOI] [PubMed] [Google Scholar]
- 30.Deng L, Shang L, Bai S, Chen J, He X, Martin-Trevino R, Chen S, Li XY, Meng X, Yu B, et al. MicroRNA100 inhibits self-renewal of breast cancer stem-like cells and breast tumor development. Cancer Res. 2014;74:6648–6660. doi: 10.1158/0008-5472.CAN-13-3710. [DOI] [PMC free article] [PubMed] [Google Scholar]
- 31.Hashimoto Y, Akiyama Y, Yuasa Y. Multiple-to-multiple relationships between microRNAs and target genes in gastric cancer. PLoS One. 2013;8:e62589. doi: 10.1371/journal.pone.0062589. [DOI] [PMC free article] [PubMed] [Google Scholar]
- 32.Goulet AC, Watts G, Lord JL, Nelson MA. Profiling of selenomethionine responsive genes in colon cancer by microarray analysis. Cancer Biol Ther. 2007;6:494–503. doi: 10.4161/cbt.6.4.3813. [DOI] [PubMed] [Google Scholar]
- 33.Kobayashi N, Yang J, Ueda A, Suzuki T, Tomaru K, Takeno M, Okuda K, Ishigatsubo Y. RanBPM, Muskelin, p48EMLP, p44CTLH, and the armadillo-repeat proteins ARMC8alpha and ARMC8beta are components of the CTLH complex. Gene. 2007;396:236–247. doi: 10.1016/j.gene.2007.02.032. [DOI] [PubMed] [Google Scholar]
- 34.Kuo TC, Tan CT, Chang YW, Hong CC, Lee WJ, Chen MW, Jeng YM, Chiou J, Yu P, Chen PS, et al. Angiopoietin-like protein 1 suppresses SLUG to inhibit cancer cell motility. J Clin Invest. 2013;123:1082–1095. doi: 10.1172/JCI64044. [DOI] [PMC free article] [PubMed] [Google Scholar]


