Abstract
Bone fracture healing is a complex process, which is associated with several factors, including age and osteoporosis. Certain genes and biological processes that may contribute to fracture healing, have been identified following developments in systems biology and molecular biology technologies, which may benefit the treatment of bone fractures. The present study identified key genes, which may be important in fracture healing through bioinformatics analysis of gene microarray datasets from the Gene Expression Omnibus. Gene clusters, which were consistently up/downregulated through time following a fracture in young (6-week-old) mice and old (8-month-old retired breeders) mice were obtained via soft clustering of differentially expressed genes (DEGs) between samples at 1 and 3 days, 1 and 5 days, and 3 and 5 days post-fracture in the two age groups, based on the Mfuzz package of R. Functional enrichment analysis of gene clusters using the Database for Annotation, Visualization and Integrated Discovery indicated that biological processes and pathways, including those associated with bone development, skeletal system development, amino sugar and nucleotide sugar metabolism, were significantly enriched in these up/downregulated genes. Of note, a total of 207 overlapped consistently upregulated genes were obtained between the two age groups, whereas no overlap was identified between the two lists of consistently downregulated genes. The overlapped genes were found to be associated with the biological processes of blood vessel development, vasculature development and skeletal system development, compared with all genes in the clusters. In addition, certain genes, including epidermal growth factor-like domain multiple 6 (EGFL6), kazal-type serine peptidase inhibitor domain 1 (KAZALD1), olfactomedin 2B (OLFM2B), collagen type III α1 (COL3A1), collagen type II α1 (COL2A1), von Willebrand factor A domain-containing 1 (VWA1), elastin microfibril interfacer 1 (EMILIN1) and aggrecan (ACAN), of the extracellular matrix organization, a process performed at the cellular level and resulting in the assembly and arrangement of constituent parts, were confirmed to be associated with fracture healing via reverse transcription-quantitative polymerase chain reaction analysis. The present study identified certain genes and biological processes/pathways, which may be associated with fracture healing and may assist in fundamental investigations and treatment in the future.
Keywords: fracture healing, bioinformatics, Gene Expression Omnibus, reverse transcription-quantitative polymerase chain reaction
Introduction
Fracture healing is a complex process and the major challenges associated with fracture healing are aging and osteoporosis (1). At present, ~40% of individuals worldwide aged ≥60 years have osteoporosis, and almost 30% of these individuals are likely to suffer an osteoporotic fracture (1,2). Due to the defective ability of fracture repair, the incidence of fracture nonunion or delayed union is high in older patients, resulting in elevated morbidity rates and high costs of care for patients.
It has been reported that certain pathological factors may also affect fracture healing. For example, with developments in molecular biology, an increasing number of genes and biological processes have been found to be associated with fracture healing, and the subsequent emergence of corresponding small bioactive molecules may assist in the treatment of fracture nonunion. Previous evidence suggests that Scx may be involved in the periosteal response during fracture healing (3). Fischerauer et al (4) demonstrated that bone morphogenetic protein receptor, type IA (BMPR1A) was upregulated in the growth plate of the fractured tibia, and Morgan et al (5) found that a BMPR1Aantagonist affected cartilage and bone formation during fracture healing. These findings indicate the importance of examining the mechanisms of fracture healing for its adjuvant treatment.
Soft clustering, also termed fuzzy clustering, was first described by Dunn in 1973 (6). Compared with a hard clustering method, including K-means clustering, the data points (in this case genes) can potentially belong to multiple clusters. In 2007, Kumar and Futschik developed Mfuzz (7), which is an R package specific for the soft clustering of gene microarray data, and Chen et al (8) identified certain target molecules for colorectal cancer through the analysis of time-series gene expression profiles based on Mfuzz.
In the present study, bioinformatics analyses, including differential expression analysis, soft clustering and functional enrichment analysis, were performed on microarray datasets from the Gene Expression Omnibus (GEO; https://www.ncbi.nlm.nih.gov/geo/) and this was followed by further confirmation of genes potentially contributing to fracture healing through reverse transcription-quantitative polymerase chain reaction (RT-qPCR) analysis. Certain genes, which have received less attention but are also important in fracture healing, were also included in the present study for evaluation. The majority of the enriched Gene Ontology (GO) terms and Kyoto Encyclopedia of Genes and Genomes (KEGG) pathways of these genes are associated with fracture healing. The findings of the present study may improve current understanding of fracture healing and provide potential therapeutic targets for further investigation.
Materials and methods
Microarray datasets
The microarray dataset (GSE17825) investigated in the present study was downloaded from the GEO (https://www.ncbi.nlm.nih.gov/geo/), which contained 18 femur samples from catagmatic female c57BI6 mice. Fracture calluses were dissected from old (8-month-old retired breeders) and young (6-week-old) mice at 1, 3 and 5 days post-fracture, and total RNA was isolated in triplicate for every group. The relative mRNA level was quantified using a GPL1261 [Mouse430_2] Affymetrix Mouse Genome 430 2.0 array and raw data were deposited by Khan et al (9).
Microarray data analysis
The raw microarray data were imported into R 3.22 and normalized using the Affy package version 1.54.0 (https://bioconductor.org/packages/release/bioc/html/affy.html) (10). The probe ID was transformed into gene symbols and the expression values for genes corresponding to multiple probes were summarized. Using the Limma package version 3.32.2 (https://bioconductor.org/packages/release/bioc/html/limma.html) (11), differentially expressed genes (DEGs) were identified between samples at 1 and 3 days, 1 and 5 days, and 3 and 5 days post-fracture in the old and young groups, according to the criteria of an adjusted P<0.05 and fold change >2.
To identify genes consistently up/downregulated with time following fracture, a soft clustering method, which allows multi-assignment in different clusters for a specific gene according to how well the gene is represented by those clusters, was applied to the DEGs in the old and young groups, respectively, based on the Mfuzz package version 2.36.0 (https://www.bioconductor.org/packages/release/bioc/html/Mfuzz.html). For this, the cluster number was set to 10 and a score of 0.9 was used for the determination of which clusters each DEG belonged to.
Functional enrichment analysis
Complex biological processes may be involved in fracture healing. For the consistently up/downregulated DEGs in the old and young groups obtained through clustering, significantly enriched (P<0.05) Gene Ontology (GO) terms and Kyoto Encyclopedia of Genes and Genomes (KEGG) pathways were obtained using the Database for Annotation, Visualization and Integrated Discovery (http://david.abcc.ncifcrf.gov/) (12). In addition, the DEGs consistently up/downregulated with time following fracture in the old and young groups may indicate key genes in fracture healing, therefore, the enriched GO terms and KEGG pathways of these genes were also obtained.
Animals
Female C57BL/6 mice were purchased from Joint Ventures Sipper BK Experimental Animal Company (Shanghai, China), and mice weighing 30.0±5.0 g were used in the present study. All animals were between 6 and 8 weeks of age at the initiation of the investigation. The animals were housed in specific pathogen-free conditions (18–29°C; 40–70%; free access to food and water) and experiments were approved by the Institutional Animal Use and Care Committee of Jinan Military General Hospital (Jinan, China).
RNA isolation
Mice were housed and maintained in the aforementioned conditions until they reached 8–12 weeks old, and then fractures were induced. Fractures were carefully opened through the same muscular interval as previously described (9). With careful anatomization, the same interval was distinguished and enrolled, and early hematoma and soft callous was maintained. The central third of the femur, including all callous or hematoma, was removed and flash frozen in liquid nitrogen. Tissues were prepared for RNA isolation as previously described (9). Total RNA from the cells were isolated with TRIzol reagent (Invitrogen; Thermo Fisher Scientific, Inc., Waltham, MA, USA) and treated with DNase I, followed by reverse transcription with random primers and AMV reverse transcription (Thermo Fisher Scientific, Inc.). The total RNA isolated was combined from three animals for each separate array time point.
qPCR analysis
A 1 µg sample of the total RNA was used for cDNA synthesis. The mRNA levels of bone morphogenetic protein 1 (BMP1), collagen type XIII α1 (COL13A1), SP3, kazal-type serine peptidase-inhibitor domain 1 (KAZALD1), insulin-induced gene 1 (INSIG1), collagen type II α1 (COL2A1), matrix metalloproteinase-14 (MMP14) and 3′-phosphoadenosine 5′-phosphosulfate synthetase 2 (PAPSS2) were determined using RT-qPCR analysis with SYBR® Green Real-time PCR Master Mix (Thermo Fisher Scientific, Inc.). The following primers were used: BMP1, forward 5′-ACCCTCCAAGACAGCACTG′-3 and reverse 5′-GGCTACGGTACAGGTCCAT-3′; COL13A1, forward 5′-CGGACCTAAAGGGGAGATGG-3′ and reverse 5′-CCAGCCGCACTGAATTGAGT-3′; SP3, forward 5′-TCAAGTAGTCGCTAATGTGCCT-3′ and reverse 5′-GAACTTCCCGAGAGTCCCAAA-3′; KAZALD1, forward 5′-GCTTCTGCAACCCTCACAGT-3′ and reverse 5′-TCAGGAAACAAACTCCGTGATTG-3′; INSIG1, forward 5′-TGTCGGTTTACTGTATCCCTGT-3′ and reverse 5′-GTTGATGCCAACGAACACGG-3′; COL2A1, forward 5′-GGGTCACAGAGGTTACCCAG-3′ and reverse 5′-ACCAGGGGAACCACTCTCAC-3′; MMP14, forward 5′-GCTTCCGAGAAGTGCCCTATG-3′ and reverse, 5′-TCCTTCACCATCAAAGGGTGTA-3′; PAPSS2, forward 5′-GACCAGCAAAAATCCACCAATG-3′ and reverse 5′-CACACGGTACATCCTCGGAAT-3′; GAPDH, forward 5′-AGGTCGGTGTGAACGGATTTG and reverse 5′-GGGGTCGTTGATGGCAACA-3′. The reactions were performed using an ABI 7,500 Fast Real-time PCR system. The thermocycling conditions were as follows: Initial denaturation step at 95°C for 10 min, followed by 40 cycles at 95°C for 15 sec, 60°C for 30 sec and 72°C for 30 sec. The quantity of the gene was determined relative to the GAPDH quantification cycle using the 2−ΔΔCq method (13).
Statistical analysis
The relative mRNA levels are presented as the mean ± standard deviation and were analyzed using R programming software version 3.4.0 (https://cran.r-project.org/). P<0.05 was considered to indicate a statistically significant difference, obtained using (two-tailed) Student's t-test.
Results
Microarray analysis
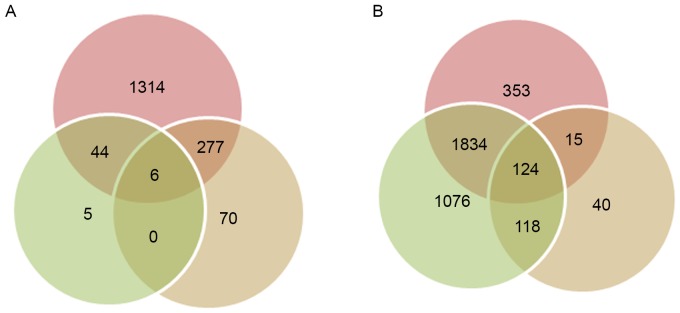
The relative mRNA levels in every sample prior to and following normalization are shown in Fig. 1. Comparable mRNA levels were obtained following normalization, compared with the raw data, and this was used for the following analysis. The distribution of DEGs between samples at 1 and 3 days, 1 and 5 days, and 3 and 5 days in the old and young groups are shown in Table I. A total of six and 124 overlaps were obtained among the three groups of DEGs for the young and old groups, respectively (Fig. 2).
Figure 1.
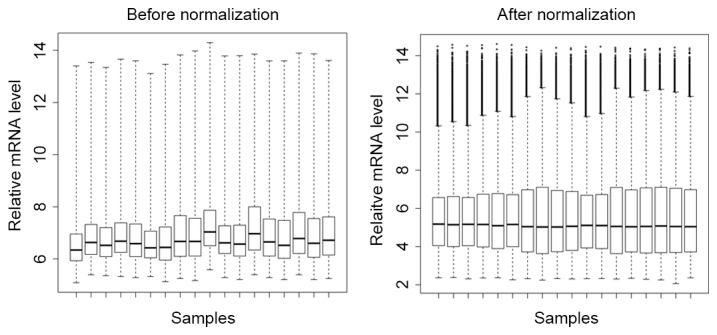
Boxplot of the relative mRNA levels in each sample prior to (left panel) and following (right panel) normalization. The X-axis represents the samples used in the present study.
Table I.
Distribution of differentially expressed genes.
| Group | Downregulated (n) | Upregulated (n) |
|---|---|---|
| Young | ||
| Day 1–3 | 130 | 223 |
| Day 1–5 | 470 | 1,171 |
| Day 3–5 | 4 | 51 |
| Old | ||
| Day 1–3 | 640 | 1,686 |
| Day 1–5 | 1,066 | 2,086 |
| Day 3–5 | 79 | 218 |
Figure 2.
Venn diagram of overlapped genes among the differentially expressed genes between 1 and 3 days, 1 and 5 days, and 3 and 5 days in mice of the (A) young and (B) old groups.
For the DEGs consistently upregulated in young and old groups, several common GO terms were identified, including extracellular region part, bone development, and skeletal system development. By contrast, biological processes associated with the inflammatory response and protein binding were found to be enriched in the consistently downregulated DEGs the in old and young groups, respectively. As with the GO terms, a number of common KEGG pathways were identified for the DEGs consistently upregulated in the young and old groups, including Lysosome, Amino sugar and nucleotide sugar metabolism, and Focal adhesion. For the DEGs consistently downregulated in young and old groups, they were found to be involved in KEGG pathways, including Lysosome, Leukocyte transendothelial migration, and Cytokine-cytokine receptor interaction, and Cardiac muscle contraction, respectively. The top 10 significantly enriched GO terms and all KEGG pathways are listed in Tables II and III.
Table II.
Top 10 significantly enriched GO terms of genes in consistently upregulated and downregulated clusters.
| Category | GO term | P-value |
|---|---|---|
| Upregulated in young | ||
| CC | Extracellular region part | 9.47×10⁻¹² |
| CC | Extracellular region | 2.24×10⁻⁹ |
| CC | Extracellular matrix | 5.78×10⁻⁹ |
| CC | Proteinaceous extracellular matrix | 1.02×10⁻⁸ |
| BP | Bone development | 1.08×10⁻⁶ |
| BP | Skeletal system development | 2.33×10⁻⁶ |
| BP | Aminoglycan metabolic process | 1.12×10⁻⁵ |
| BP | Polysaccharide metabolic process | 2.16×10⁻⁵ |
| BP | Proteoglycan metabolic process | 5.45×10⁻⁵ |
| BP | Ossification | 7.39×10⁻⁵ |
| Downregulated in young | ||
| CC | Endoplasmic reticulum | 9.60×10⁻⁷ |
| MF | ER retention sequence binding | 3.47×10⁻⁴ |
| MF | Inorganic cation transmembrane transporter activity | 4.59×10⁻⁴ |
| BP | Vesicle-mediated transport | 7.40×10⁻⁴ |
| MF | Protein domain specific binding | 1.16×10⁻³ |
| BP | Protein retention in ER lumen | 1.22×10⁻³ |
| MF | Transition metal ion transmembrane transporter activity | 2.14×10⁻³ |
| MF | PDZ domain binding | 2.41×10⁻³ |
| MF | Signal sequence binding | 3.13×10⁻³ |
| MF | Enzyme binding | 3.48×10⁻³ |
| Upregulated in old | ||
| CC | Extracellular matrix | 2.24×10⁻²⁶ |
| CC | Proteinaceous extracellular matrix | 2.24×10⁻²⁵ |
| CC | Extracellular region part | 1.37×10⁻¹⁸ |
| BP | Cell adhesion | 1.75×10⁻¹⁴ |
| BP | Biological adhesion | 1.93×10⁻¹⁴ |
| BP | Extracellular matrix organization | 1.87×10⁻¹³ |
| BP | Skeletal system development | 2.23×10⁻¹³ |
| BP | Extracellular structure organization | 4.32×10⁻¹³ |
| BP | Bone development | 2.34×10⁻¹² |
| CC | Extracellular region | 3.82×10⁻¹¹ |
| Downregulated in old | ||
| CC | Myofibril | 2.23×10⁻⁸ |
| CC | Contractile fiber | 3.52×10⁻⁸ |
| MF | Chemokine activity | 6.11×10⁻⁷ |
| MF | Chemokine receptor binding | 7.37×10⁻⁷ |
| CC | Sarcomere | 8.26×10⁻⁷ |
| CC | Contractile fiber part | 1.53×10⁻⁶ |
| CC | I band | 4.83×10⁻⁶ |
| BP | Cellular ion homeostasis | 1.69×10⁻⁴ |
| BP | Cellular cation homeostasis | 1.75×10⁻⁴ |
| BP | Inflammatory response | 1.85×10⁻⁴ |
GO, Gene Ontology; CC, cellular component; MF, molecular function; BP, biological process.
Table III.
Top 10 significantly enriched KEGG pathways of genes in consistently upregulated and downregulated clusters.
| KEGG pathway | Genes (n) | P-value |
|---|---|---|
| Genes upregulated in young samples | ||
| Lysosome | 12 | 2.04×10⁻⁵ |
| Chondroitin sulfate biosynthesis | 4 | 8.93×10⁻³ |
| Amino sugar and nucleotide | 5 | 1.09×10⁻² |
| sugar metabolism | ||
| Thyroid cancer | 4 | 1.92×10⁻² |
| Chemokine signaling pathway | 9 | 2.78×10⁻² |
| Glycosphingolipid biosynthesis | 3 | 3.05×10⁻² |
| Other glycan degradation | 3 | 3.92×10⁻² |
| Focal adhesion | 9 | 4.26×10⁻² |
| Downregulated in young samples | ||
| Lysosome | 6 | 1.22×10⁻² |
| Cell adhesion molecules | 6 | 3.32×10⁻² |
| Leukocyte transendothelial migration | 5 | 4.96×10⁻² |
| Upregulated in old samples | ||
| Focal adhesion | 30 | 1.75×10⁻⁷ |
| ECM-receptor interaction | 17 | 3.13×10⁻⁶ |
| Colorectal cancer | 12 | 3.95×10⁻³ |
| Gap junction | 12 | 3.95×10⁻³ |
| Lysosome | 14 | 7.11×10⁻³ |
| N-Glycan biosynthesis | 8 | 7.96×10⁻³ |
| TGF-β signaling pathway | 11 | 1.23×10⁻² |
| Adherens junction | 10 | 1.43×10⁻² |
| Amino sugar and nucleotide sugar metabolism | 7 | 2.28×10⁻² |
| Pathways in cancer | 25 | 3.81×10⁻² |
| Prostate cancer | 10 | 3.85×10⁻² |
| Leukocyte transendothelial migration | 12 | 3.89×10⁻² |
| Tight junction | 13 | 4.13×10⁻² |
| SNARE interactions in vesicular transport | 6 | 4.18×10⁻² |
| Biosynthesis of unsaturated fatty acids | 5 | 4.58×10⁻² |
| Downregulated in old samples | ||
| Cytokine-cytokine receptor interaction | 12 | 9.49×10⁻⁴ |
| Cardiac muscle contraction | 7 | 1.03×10⁻³ |
| Nitrogen metabolism | 4 | 4.64×10⁻³ |
| Hematopoietic cell lineage | 6 | 8.22×10⁻³ |
| Adipocytokine signaling pathway | 5 | 1.76×10⁻² |
| Chemokine signaling pathway | 8 | 1.88×10⁻² |
| Parkinson's disease | 6 | 4.86×10⁻² |
KEGG, Kyoto Encyclopedia of Genes and Genomes.
Soft clustering
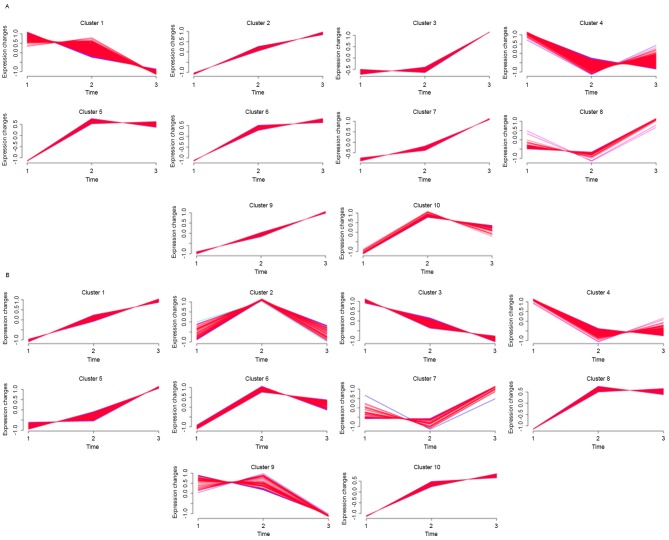
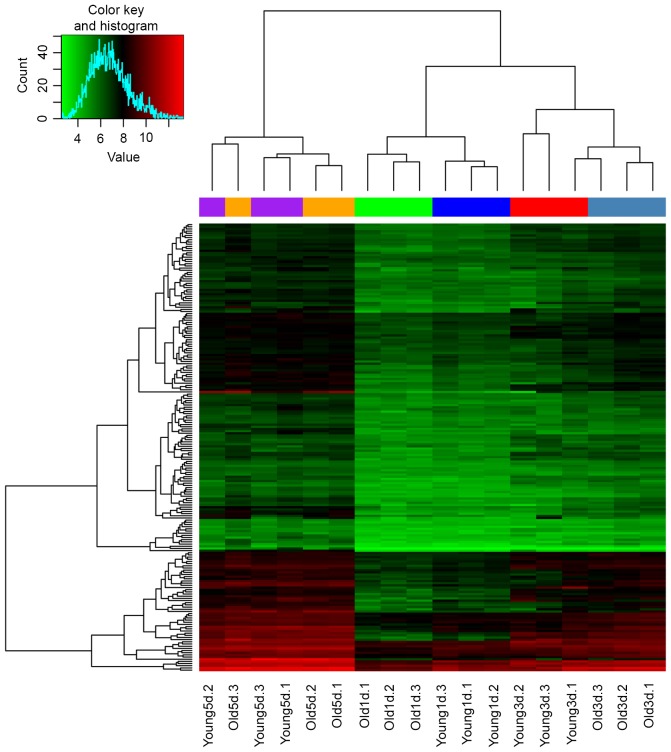
According to the results obtained from the Mfuzz program, a total of four clusters (Fig. 3A; clusters 2, 3, 6 and 9) and one cluster (Fig. 3A; cluster 1) were found to be consistently upregulated and downregulated, respectively, in the young group. In the old group, a total of three clusters (Fig. 3B; cluster 1, 5 and 10) and one cluster (Fig. 3B; cluster 3) were consistently upregulated and downregulated, respectively. The number of consistently upregulated and downregulated DEGs in the young and old groups were 596 and 1,228, and 231 and 338, respectively. Of note, a total of 207 overlaps were obtained between the consistently upregulated DEGs in the young and old groups, whereas no overlap was identified between the consistently downregulated DEGs. In addition, the supervised clustering based on these 207 overlapped consistently upregulated DEGs separated all the samples, with the exception of the old and young samples at 5 days post-fracture, into their own groups according to the age or duration following fracture (Fig. 4). The top 10 significantly enriched GO terms and KEGG pathways of these 207 overlaps are listed in Table IV.
Figure 3.
Clusters obtained via the soft clustering method for differentially expressed genes of mice in the (A) young and (B) old groups.
Figure 4.
Supervised clustering of samples. A total of 207 genes were consistently upregulated in the young and old groups overtime following fracture. The green and red colors represent low and high expression values, respectively. The trees shown at the top and on the left, indicate sample and gene clusters, respectively. 1d, 1 day post-fracture; 3d, 3 days post-fracture; 5d, 5 days post-fracture.
Table IV.
Top 10 significantly enriched GO terms and KEGG pathways of the 207 genes consistently upregulated with time following fracture in young and old groups.
| Term/pathway | Genes (n) | P-value |
|---|---|---|
| GO term | ||
| Cell adhesion | 19 | 5.11×10⁻⁶ |
| Biological adhesion | 19 | 5.24×10⁻⁶ |
| Extracellular matrix organization | 8 | 4.61×10⁻⁵ |
| Extracellular structure organization | 9 | 8.16×10⁻⁵ |
| Blood vessel development | 11 | 1.03×10⁻⁴ |
| Bone development | 8 | 1.24×10⁻⁴ |
| Vasculature development | 11 | 1.26×10⁻⁴ |
| Proteoglycan metabolic process | 5 | 2.49×10⁻⁴ |
| Angiogenesis | 8 | 2.60×10⁻⁴ |
| Skeletal system development | 11 | 3.62×10⁻⁴ |
| KEGG pathway | ||
| Focal adhesion | 7 | 5.16×10⁻³ |
| Tight junction | 5 | 2.39×10⁻² |
| ECM-receptor interaction | 4 | 3.00×10⁻² |
GO, Gene Ontology; KEGG, Kyoto Encyclopedia of Genes and Genomes.
RT-qPCR validation of involvement of extracellular matrix (ECM) organization in fracture healing
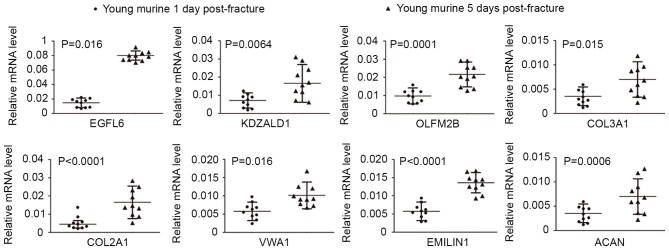
ECM organization is a process, which occurs at the cellular level, and results in the assembly and arrangement of constituent parts, or the disassembly of ECM. Previous studies have noted the importance of ECM organization in several biological processes, including tumor cell migration and immune defense. The present study performed comprehensive analysis of the 207 overlapped genes consistently upregulated overtime following fracture in young and old groups, and found that ECM organization was significantly enriched. A total of eight genes were included in this GO term in the present study, namely EGFL6, KAZALD1, OLFML2B, COL3A1, ACAN, COL2A1, VWA1 and EMILIN1. To confirm the important genes involved in the pathogenesis of fracture healing, femur tissues from 10 young mice at 1 day post-fracture and young mice 5 days post-fracture were subjected to RT-qPCR analysis (Fig. 5).
Figure 5.
Relative expression level of genes included in the GO term of extracellular matrix organization. Expression levels were determined using reverse transcription-quantitative polymerase chain reaction in young mice at 1 and 5 days post-fracture. Data are expressed as the mean ± standard deviation of three independent experiments (*P<0.05 and **P<0.01; two-tailed unpaired t-test). EGFL6, epidermal growth factor-like domain multiple 6; KAZALDI, kazal-type serine peptidase inhibitor domain 1; COL3A1, collagen type III α1; COL2A1, collagen type II α1, VWA1, von Willebrand factor A domain-containing 1, EMILIN1, elastin microfibril interfacer 1; ACAN, aggrecan.
Discussion
Despite considerable efforts to determine the mechanisms of fracture healing, current understanding of the genetic changes associated with the progression of fracture healing remains to be elucidated. In the present study, genome-wide gene expression analysis was performed using a high throughput method to identify the DEGs from samples 1, 3 and 5 days following fracture in 8-month-old retired breeding mice and 6-week-old mice. Soft clustering identified consistently up/downregulated genes in the young and old groups over time following fracture, which indicate their possible involvement in fracture healing. In addition, 207 genes were identified as being consistently upregulated in the young and old mice, providing valuable targets for future investigations.
The GO analyses revealed that the significant GO categories included cell adhesion, ECM organization, blood vessel development, and bone development. The replacement of cartilage by bone during endochondral ossification is essential in fetal skeletal development, bone growth and fracture healing. The regulation of this process by the ECM occurs through matrix remodeling, involving a variety of cell attachment molecules and growth factors, which affect cell morphology and protein expression. The present study identified eight genes, including EGFL6, KAZALD1, OLFML2B, COL3A1, ACAN, COL2A1, VWA1 and EMILIN1, which were associated with cell adhesion and ECM organization. EGFL6 is a member of the EGF repeat superfamily, which are characterized by the presence of EGF-like repeats, and are often involved in the regulation of cell cycle, proliferation and developmental processes. Chim et al (14) reported that EGLF6 mediates a paracrine mechanism of cross-talk between vascular endothelial cells and osteoblasts, and may offer an important novel target for the potential treatment of bone diseases, including osteonecrosis, osteoporosis and fracture healing. COL2A1 is essential for normal embryonic development of the skeleton, for linear growth and for the ability of cartilage to resist compressive forces. In a previous study involving Col2a1-ICAT transgenic mice, radiological, histological and histomorphometric analyses 7, 9, 12, 14, 21 and 28 days following fracture demonstrated the bone repair was inhibited due to reduced and delayed cartilage formation, chondrocyte hypertrophy and bone generation (15). However, the remaining six genes have not been examined in reference to fracture healing, and the present study hypothesized that these genes may be critical markers, mediators or participants in the pathogenesis of fracture healing.
The 207 genes were then used in KEGG pathway analysis, which screened out four pathways, including Focal adhesion, Tight junction, ECM-receptor interaction, and Lysosome. Previous studies have reported that the majority of these pathways are involved in fracture healing (16–18). However, in reviewing previous literature, there are no reports on the association between lysosome and fracture healing. Lysosomes are spherical vesicles, which contain hydrolytic enzymes that can break down almost all types of biomolecule (19). Therefore, the function of lysosomes in fracture healing warrants further investigation.
Taken together, through the identification of DEGs and performing clustering, GO enrichment, KEGG pathway analysis and RT-qPCR analysis, several key genes were screened out, which may be important in fracture healing, and a number of these genes were further confirmed. However, the results of the present study require further investigation to determine their potential utilization in the treatment of fractures.
Acknowledgements
The present study was supported by the General Financial Grant from the China Postdoctoral Science Foundation (grant no. 2013M532178).
References
- 1.Foulke BA, Kendal AR, Murray DW, Pandit H. Fracture healing in the elderly: A review. Maturitas. 2016;92:49–55. doi: 10.1016/j.maturitas.2016.07.014. [DOI] [PubMed] [Google Scholar]
- 2.Lamster IB, Asadourian L, Del Carmen T, Friedman PK. The aging mouth: Differentiating normal aging from disease. Periodontol. 2016;72:96–107. doi: 10.1111/prd.12131. [DOI] [PubMed] [Google Scholar]
- 3.McKenzie JA, Buettmann E, Abraham AC, Gardner MJ, Silva MJ, Killian ML. Loss of scleraxis in mice leads to geometric and structural changes in cortical bone, as well as asymmetry in fracture healing. FASEB J. 2017;31:882–892. doi: 10.1096/fj.201600969R. [DOI] [PMC free article] [PubMed] [Google Scholar]
- 4.Fischerauer EE, Manninger M, Seles M, Janezic G, Pichler K, Ebner B, Weinberg AM. BMP-6 and BMPR-1a are up-regulated in the growth plate of the fractured tibia. J Orthop Res. 2013;31:357–363. doi: 10.1002/jor.22238. [DOI] [PubMed] [Google Scholar]
- 5.Morgan EF, Pittman J, DeGiacomo A, Cusher D, de Bakker CM, Mroszczyk KA, Grinstaff MW, Gerstenfeld LC. BMPR1A antagonist differentially affects cartilage and bone formation during fracture healing. J Orthop Res. 2016;34:2096–2105. doi: 10.1002/jor.23233. [DOI] [PubMed] [Google Scholar]
- 6.Dunn JC. A fuzzy relative of the ISODATA process and its use in detecting compact well-separated clusters. Journal of Cybernetics. 1973;3:32–57. doi: 10.1080/01969727308546046. [DOI] [Google Scholar]
- 7.Kumar L, Futschik EM. Mfuzz: A software package for soft clustering of microarray data. Bioinformation. 2007;2:5–7. doi: 10.6026/97320630002005. [DOI] [PMC free article] [PubMed] [Google Scholar]
- 8.Chen G, Han N, Li G, Li X, Li G, Li Z, Li Q. Time course analysis based on gene expression profile and identification of target molecules for colorectal cancer. Cancer Cell Int. 2016;16:22. doi: 10.1186/s12935-016-0296-3. [DOI] [PMC free article] [PubMed] [Google Scholar]
- 9.Khan SN, Solaris J, Ramsey KE, Yang X, Bostrom MP, Stephan D, Daluiski A. Identification of novel gene expression in healing fracture callus tissue by DNA microarray. HSS J. 2008;4:149–160. doi: 10.1007/s11420-008-9087-2. [DOI] [PMC free article] [PubMed] [Google Scholar]
- 10.Gautier L, Cope L, Bolstad BM, Irizarry RA. affy-analysis of Affymetrix GeneChip data at the probe level. Bioinformatics. 2004;20:307–315. doi: 10.1093/bioinformatics/btg405. [DOI] [PubMed] [Google Scholar]
- 11.Diboun I, Wernisch L, Orengo CA, Koltzenburg M. Microarray analysis after RNA amplification can detect pronounced differences in gene expression using limma. BMC Genomics. 2006;7:252. doi: 10.1186/1471-2164-7-252. [DOI] [PMC free article] [PubMed] [Google Scholar]
- 12.Dennis G, Jr, Sherman BT, Hosack DA, Yang J, Gao W, Lane HC, Lempicki RA. DAVID: Database for annotation, visualization, and integrated discovery. Genome Biol. 2003;4:P3. doi: 10.1186/gb-2003-4-5-p3. [DOI] [PubMed] [Google Scholar]
- 13.Livak KJ, Schmittgen TD. Analysis of relative gene expression data using real-time quantitative PCR and the 2(−Delta Delta C(T)) method. Methods. 2001;25:402–408. doi: 10.1006/meth.2001.1262. [DOI] [PubMed] [Google Scholar]
- 14.Chim SM, Qin A, Tickner J, Pavlos N, Davey T, Wang H, Guo Y, Zheng MH, Xu J. EGFL6 promotes endothelial cell migration and angiogenesis through the activation of extracellular signal-regulated kinase. J Biol Chem. 2011;286:22035–22046. doi: 10.1074/jbc.M110.187633. [DOI] [PMC free article] [PubMed] [Google Scholar]
- 15.Huang Y, Zhang X, Du K, Yang F, Shi Y, Huang J, Tang T, Chen D, Dai K. Inhibition of β-catenin signaling in chondrocytes induces delayed fracture healing in mice. J Orthop Res. 2012;30:304–310. doi: 10.1002/jor.21505. [DOI] [PMC free article] [PubMed] [Google Scholar]
- 16.Horikiri Y, Shimo T, Kurio N, Okui T, Matsumoto K, Iwamoto M, Sasaki A. Sonic hedgehog regulates osteoblast function by focal adhesion kinase signaling in the process of fracture healing. PloS One. 2013;8:e76785. doi: 10.1371/journal.pone.0076785. [DOI] [PMC free article] [PubMed] [Google Scholar]
- 17.Wang W, Shen H, Xie J, Zhou Q, Chen Y, Lu H. Bioinformatics analysis of time-series genes profiling to explore key genes affected by age in fracture healing. Mol Biol Rep. 2014;41:3881–3889. doi: 10.1007/s11033-014-3255-x. [DOI] [PubMed] [Google Scholar]
- 18.Jia Z, Zhang Y, Chen YH, Dusad A, Yuan H, Ren K, Li F, Fehringer EV, Purdue PE, Goldring SR, et al. Simvastatin prodrug micelles target fracture and improve healing. J Control Release. 2015;200:23–34. doi: 10.1016/j.jconrel.2014.12.028. [DOI] [PMC free article] [PubMed] [Google Scholar]
- 19.Kuech EM, Brogden G, Naim HY. Alterations in membrane trafficking and pathophysiological implications in lysosomal storage disorders. Biochimie. 2016;130:152–162. doi: 10.1016/j.biochi.2016.09.011. [DOI] [PubMed] [Google Scholar]


