

Abstract
Metastasis is the main cause of breast cancer-related mortalities. The present study aimed to uncover the relevant molecular mechanisms of breast cancer metastasis and to explore potential biomarkers that may be used for prognosis. Expression profile microarray data GSE8977, which contained 22 stroma samples (15 were from normal breast and 7 were from invasive ductal carcinoma tumor samples), were obtained from the Gene Expression Omnibus database. Following data preprocessing, differentially expressed genes (DEGs) were selected based on analyses conducted using the linear models for microarray analysis package from R and Bioconductor software. The resulting data were used in subsequent function and pathway enrichment analyses, as well as protein-protein interaction (PPI) network and subnetwork analyses. Transcription factors (TFs) and tumor-associated genes were also identified among the DEGs. A total of 234 DEGs were identified, which were enriched in immune response, cell differentiation and cell adhesion-related functions and pathways. Downregulated DEGs included TFs, such as the proto-oncogene SPI1, pre-B-cell leukemia homeobox 3 (PBX3) and lymphoid enhancer-binding factor 1 (LEF1), as well as tumor suppressors (TSs), such as capping actin protein, gelsolin like (CAPG) and tumor protein p53-inducible nuclear protein 1 (TP53INP1). Upregulated DEGs also included TFs and tumor suppressors, consisting of transcription factor 7-like 2 (TCF7L2) and pleiomorphic adenoma gene-like 1 (PLAGL1). DEGs that were identified at the hub nodes in the PPI network and the subnetwork were epidermal growth factor receptor (EGFR) and spleen-associated tyrosine kinase (SYK), respectively. Several genes crucial in the metastasis of breast cancer were identified, which may serve as potential biomarkers, many of which were associated with cell adhesion, proliferation or immune response, and may influence breast cancer metastasis by regulating these function or pathways.
Keywords: breast cancer metastasis, protein-protein interaction, immune response, cell differentiation, cell adhesion
Introduction
Breast cancer is a malignant disease that affects women worldwide. In the United States, breast cancer was estimated to account for 29% of all new cancer cases and 15% of all cancer-related mortality among women in 2014 (1). The major cause of these mortalities was not the primary breast cancer tumor, but the metastases at distant sites; in most patients with breast cancer, the tumor was able to metastasize to different organs, such as bone, lungs and brain (2–4). In a number of patients, breast cancer has been demonstrated to be aggressive and metastasized to a distant site a short time following the detection of primary tumor, whereas in other cases the hallmark of metastases may not be evident for a longer period (5). This feature makes it difficult to identify the risk factors of breast cancer metastasis and to evaluate relevant curative therapies (5). Although mammographic screening may lower the metastasis-related mortality, the method is inappropriate for detection at early stages (6). Therefore, it is urgent to develop effective molecular techniques for the diagnosis and treatment of breast cancer metastasis.
The initial event of metastasis may be the transformation of normal breast stromal cells to cells with oncogenic mutations. The subsequent generation of cancer stromal cells may lead to poor prognosis, as a self-renewing population of stromal cells accumulates the mutations required for tumorigenesis (7). In the transforming growth factor β receptor 2 knockout mouse model, stromal fibroblasts were reported to be a major source of elevated TGFβ expression, which was used to predict early breast cancer metastasis (8). Therefore, breast cancer stromal cells may be considered as attractive therapeutic targets. At present, several molecular targeting therapies have been developed; for example, agents targeting HER2 (such as trastuzumab) have been used to treat patients with metastatic breast cancer in which HER2 is overexpressed (9). P38 mitogen-activated protein kinase has been reported to inhibit breast cancer metastasis through the regulation of stromal expansion (10). In addition, breast cancer metastasis-suppressor 1 was demonstrated to suppress metastasis in multiple organs, such as breast and ovary, by blocking several of the steps involved in the metastatic process (11); however, it was apparently insufficient to use only one gene as a targeted therapy due to the complex pathogenesis of cancer metastasis. Therefore, an improved understanding of the molecular mechanisms of metastasis is required to discover as yet unknown target genes.
The present study analyzed expression profile microarray data GSE8977 from the Gene Expression Omnibus (GEO) database, which contained stroma samples from normal and invasive ductal carcinoma (IDC) breast tissue samples, to perform bioinformatics analyses, including differential analysis, enrichment analysis and protein-protein interaction (PPI) network analysis. The present study aimed to identify potentially important gene markers and to gain better insight into the molecular mechanism of breast cancer metastasis.
Materials and methods
Microarray data
Expression profile GSE8977 was obtained from National Center of Biotechnology Information GEO database (http://www.ncbi.nlm.nih.gov/geo/query/acc.cgi?acc=GSE8977) (12). The profile comprised 22 stroma samples, of which 15 were from normal breast samples (Control group) and 7 were from IDC tumor samples (Tumor group), and was based on the GPL570 platform data (Affymetrix Human Genome U133 Plus 2.0 Array).
Data preprocessing
Raw data underwent preprocessing, such as background correction, quantile normalization and probe summarization, using the robust multi-array average algorithm (13) and the ‘affy’ package version 1.54.0 (http://www.bioconductor.org/packages/release/bioc/html/affy.html) in Bioconductor, as previously described (14), and a gene expression matrix was obtained.
Differently expressed gene (DEG) selection
Empirical Bayes test was used to identify DEGs between the two groups, based on the Linear Models for Microarray Analysis (‘limma’) package version 3.32.2 of R (http://www.bioconductor.org/packages/release/bioc/html/limma.html) (15). The selection criteria for significant DEGs were |log2 fold-change| ≥1 and a false discovery rate (FDR)-adjusted P-value <0.05.
Enrichment analysis of DEGs
Function enrichment analysis of the identified DEGs was performed with the Gene Ontology (GO) database (http://www.geneontology.org) (16), which included functions on biological process, molecular function and cellular component. The Kyoto Encyclopedia of Genes and Genomes (KEGG) database (http://www.genome.jp/kegg/pathway.html) was used to identify significantly enriched pathways (17). The threshold for significant GO terms and KEGG pathways was P<0.01, based on hypergeometric distribution.
Functional annotation of the corresponding DEGs
The identified DEGs were combined with information from the TRANScription FACtor (TRANSFAC) database version 7.0 (http://www.gene-regulation.com/pub/databases.html) to analyze their potential transcriptional functions and to reveal which were potential transcription factors (TFs). Oncogenes and tumor suppressor (TS) genes were also screened using the TS database (http://bioinfo.mc.vanderbilt.edu/TSGene/) version 2.0 (18) and the Tumor Associated Genes (TAGs) database (http://www.binfo.ncku.edu.tw/TAG/) (19).
Construction of a PPI network and subnetwork
To explore potential interactions of the DEGs on the protein level and to establish a PPI network, DEGs were mapped with the Search Tool for the Retrieval of Interacting Genes (STRING) database version 10.5 (http://string-db.org) (20), with the criterion of a combined score ≥0.9. Only the PPIs that were validated by previous experiments or co-expression analysis, or recorded in relevant databases were screened out to construct the network. In addition, it was required that at least one gene in each PPI should be an identified DEG. Finally, the PPI network was visualized using Cytoscape version 3.5.1 (http://cytoscape.org) software (21).
The BioNet tool (http://www.bioconductor.org/packages/release/bioc/html/BioNet.html) version 1.36.0 in R was used to extract the subnetwork, based on significant P-values of DEGs (22). FDR-adjusted P<0.0001 was chosen as the cut-off value for subnetwork extraction. KEGG pathway enrichment analysis was performed to reveal potential pathways for genes in the subnetwork, using the aforementioned criterion.
Results
Analysis of DEGs
Based on the selection criteria, a total of 910 transcripts were identified to be differentially expressed between the two groups, 347 of which were upregulated and 563 were downregulated. These transcripts corresponded to 84 upregulated genes and 150 downregulated genes, giving a total of 234 identified DEGs.
KEGG pathway and GO functional enrichment analyses
KEGG pathway enrichment analysis indicated that the downregulated DEGs were enriched in immune response-related pathways, including Staphylococcus aureus infection, allograft rejection and graft-versus-host disease pathways, as well as pathways related to cell differentiation and cell adhesion, such as hematopoietic cell lineage, osteoclast differentiation and cell adhesion molecules. The upregulated DEGs were enriched in cancer-related pathways, including colorectal, endometrial and thyroid cancer pathways, as well as the adherens junction pathway (Table I).
Table I.
Enriched KEGG pathways of the identified DEGs.
| DEG expression | KEGG pathway | n | Example of identified genes | P-value |
|---|---|---|---|---|
| Downregulated | Staphylococcus aureus infection | 16 | ITGB2, FPR1, FPR3, HLA-DRB3, ITGAM | 1.13×10⁻¹⁵ |
| Phagosome | 17 | ITGB2, CORO1A, DRB1, HLA-DMB, COMP | 6.96×10⁻¹³ | |
| Allograft rejection | 10 | CD80, CD86, HLA-DMB, HLA-DQA1, HLA-DQA2 | 5.97×10⁻¹² | |
| Cell adhesion molecules | 15 | CD4, CD80, ITGB2, CD86, HLA-DMB | 1.54×10⁻¹¹ | |
| Graft-versus-host disease | 10 | CD80, CD86, HLA-DMB, HLA-DQA1, HLA-DQA2 | 1.85×10⁻¹¹ | |
| Osteoclast differentiation | 10 | LCP2, LILRB1, TYROBP, SPI1, BLNK | 1.70×10−06 | |
| Hematopoietic cell lineage | 5 | CD4, HLA-DRA, HLA-DRB1, HLA-DRB3, ITGAM | 3.35×10−03 | |
| Upregulated | Endometrial cancer | 3 | EGFR, TCF7L1, TCF7L2 | 2.25×10−03 |
| Colorectal cancer | 3 | MSH6, TCF7L1, TCF7L2 | 3.72×10−03 | |
| Complement and coagulation cascades | 3 | CFD, PROS1, TFPI | 5.03×10−03 | |
| Adherens junction | 3 | EGFR, TCF7L1, TCF7L2 | 5.89×10−03 | |
| Thyroid cancer | 2 | TCF7L1, TCF7L2 | 9.41×10−03 |
DEG, differentially expressed gene; KEGG, Kyoto Encyclopedia of Genes and Genomes.
To gain further insight into the function of the identified DEGs, GO analysis was performed (Table II). The downregulated DEGs were revealed to be highly related to immunoreactions, such as activation of immune response, leukocyte migration and positive regulation of leukocyte activation; additional functions included cell adhesion and protein secretion. The upregulated DEGs were mainly enriched in cell proliferation- and tissue development-related functions, such as muscle cell proliferation, regulation of epithelial cell proliferation and tissue development; as well as cell adhesion-related processes such as regulation of focal adhesion assembly.
Table II.
GO term functional enrichment of DEGs.
| DEG expression | GO ID | GO term | n | P-value |
|---|---|---|---|---|
| Downregulated | GO:0002253 | Activation of immune response | 38 | 1.26×10⁻²⁵ |
| GO:0050900 | Leukocyte migration | 32 | 3.43×10⁻²¹ | |
| GO:0071345 | Cellular response to cytokine stimulus | 40 | 2.31×10⁻¹⁸ | |
| GO:0002696 | Positive regulation of leukocyte activation | 29 | 3.33×10⁻¹⁶ | |
| GO:0006954 | Inflammatory response | 41 | 1.78×10⁻¹⁵ | |
| GO:0060326 | Cell chemotaxis | 20 | 1.41×10⁻¹¹ | |
| GO:0009306 | Protein secretion | 21 | 4.17×10⁻¹¹ | |
| GO:0009615 | Response to virus | 25 | 4.29×10⁻¹¹ | |
| GO:0007155 | Cell adhesion | 48 | 2.83×10⁻¹⁰ | |
| GO:0071222 | Cellular response to lipopolysaccharide | 15 | 7.00×10⁻¹⁰ | |
| Upregulated | GO:0035265 | Organ growth | 6 | 9.06×10−06 |
| GO:0031644 | Regulation of neurological system process | 8 | 1.85×10−05 | |
| GO:0033002 | Muscle cell proliferation | 6 | 2.01×10−05 | |
| GO:0006790 | Sulfur compound metabolic process | 8 | 3.65×10−05 | |
| GO:0050678 | Regulation of epithelial cell proliferation | 7 | 1.17×10−04 | |
| GO:0009888 | Tissue development | 19 | 1.49×10−04 | |
| GO:0007420 | Brain development | 10 | 4.07×10−04 | |
| GO:0051893 | Regulation of focal adhesion assembly | 3 | 4.45×10−04 | |
| GO:0032355 | Response to estradiol stimulus | 4 | 5.27×10−04 | |
| GO:0019530 | Taurine metabolic process | 2 | 5.05×10−01 |
DEG, differentially expressed gene; GO ID, gene ontology.
Functional annotation of TFs and TAGs
The identified DEGs were analyzed for potential functions as TFs and TAGs (Table III). The analysis indicated that, of the downregulated DEGs, 3 were identified as TFs and 12 as TAGs; of the upregulated DEGs, 6 were indicated to be TFs and 17 were TAGs.
Table III.
Functional annotation of the identified DEGs.
| DEG expression | TF count | TF | TAG count | TAG |
|---|---|---|---|---|
| Downregulated | 3 | SPI1, PBX3, LEF1 | 12 | ONCO: WISP1, SPI1, HCK |
| TS: WNT5A, TP53INP1, MMP11, GJB2, ENC1, CAPG | ||||
| OTHER: PBX3, EVI2B, CTSZ | ||||
| Upregulated | 6 | TCF7L2, PLAGL1, NFIA, IRF1, EGR2, CEBPD | 17 | ONCO: EGFR |
| TS: TGFBR3, TCF7L2, TCEAL7, SRPX, SPRY2, SFRP1, PLAGL1, NDRG2, IRF1, GPC3, EGR2, EEF1A1, CRABP1, CEBPD | ||||
| OTHER: MSH6, CCL2 |
ONCO, oncogene; TAG, tumor-associated gene; TF, transcription factor; TS, tumor suppressor.
PPI network of the DEGs
DEGs were integrated with interactions from the STRING database, and a PPI network was constructed (Fig. 1). The top 10 nodes with the highest degrees in the PPI network included: epidermal growth factor receptor (EGFR), degree=94; CD4, degree=43; lymphocyte cytosolic protein 2 (LCP2), degree=28; hematopoietic cell kinase (HCK), degree=22; integrin β2 (ITGB2), degree=21; interferon regulatory factor 1 (IRF1), degree=21; C-X-C motif chemokine 10 (CXCL10), degree=20; protachykinin 1 (TAC1), degree=18; TYRO protein tyrosine kinase-binding protein (TYROBP), degree=18; and C-C motif chemokine 2 (CCL2), degree=16. EGFR exhibited the highest degree, which suggested that it may serve a predominant role in breast cancer metastasis.
Figure 1.

Predicted protein-protein interaction network of DEGs in breast cancer metastasis. Red nodes represent upregulated DEGs; green nodes represent downregulated DEGs; and yellow nodes represent genes that were not identified as differentially expressed. Blue lines represent the interaction relationships between two proteins. DEG, differentially expressed genes.
Subnetwork and KEGG functional analysis of DEGs
To further explore the key nodes for breast cancer metastasis, a subnetwork was established comprising 44 nodes using the BioNet tool, among which spleen tyrosine kinase (SYK) was predominant with the highest degree (degree=10; Fig. 2). KEGG pathway enrichment analysis indicated that proteins in the subnetwork, in which SYK was central, were involved in immune response pathways, such as Staphylococcus aureus infection, natural killer cell-mediated cytotoxicity and B cell receptor signaling pathway; as well as cell differentiation and cell adhesion pathways, including osteoclast differentiation and cell adhesion molecules (Table IV).
Figure 2.
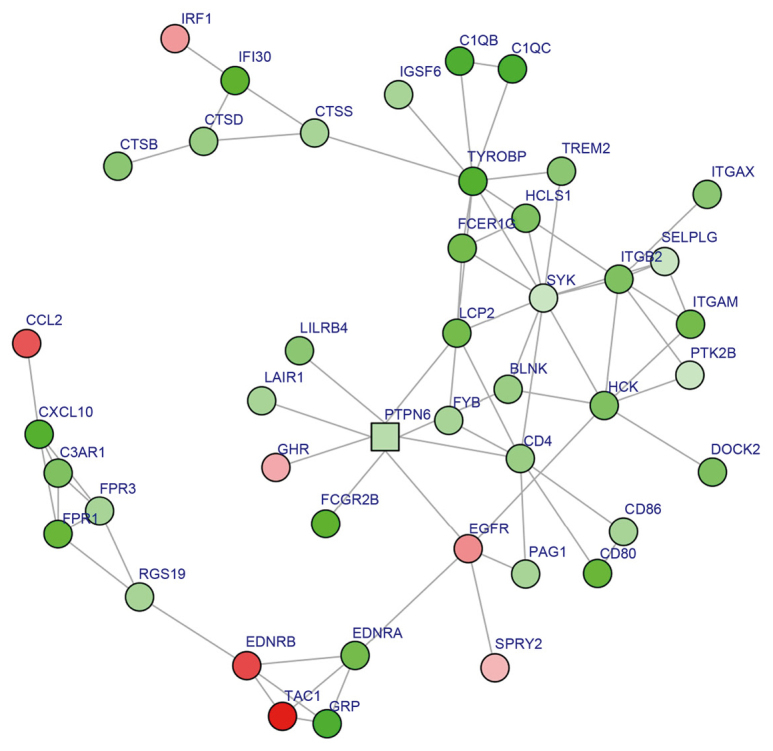
Subnetwork from the protein-protein interaction (PPI) network. Circles represent genes with high significance in the PPI network, and squares represent genes with low significance in the PPI network. Red nodes represent upregulated DEGs; green nodes represent downregulated DEGs; and pink nodes represent proteins with no significant expression change. Node color intensity was associated with the |log2 fold-change| of DEGs. DEG, differentially expressed gene.
Table IV.
KEGG enriched pathway analysis for DEGs in the subnetwork.
| KEGG pathway | n | P-value |
|---|---|---|
| Staphylococcus aureus infection | 9 | 2.86×10⁻¹¹ |
| Osteoclast differentiation | 7 | 1.19×10−05 |
| Natural killer cell-mediated cytotoxicity | 7 | 1.77×10−05 |
| Cell adhesion molecules | 6 | 1.58×1−04 |
| B cell receptor signaling pathway | 4 | 1.18×10−03 |
| Antigen processing and presentation | 4 | 1.24×10−03 |
| Systemic lupus erythematosus | 5 | 1.49×10−03 |
| Rheumatoid arthritis | 4 | 2.41×10−03 |
| Fcγ receptor-mediated phagocytosis | 4 | 2.72×10−03 |
| Chemokine signaling pathway | 5 | 6.19×10−03 |
| Neuroactive ligand-receptor interaction | 6 | 6.48×10−03 |
| Complement and coagulation cascades | 3 | 9.01×10−03 |
| Viral myocarditis | 3 | 9.44×10−03 |
DEG, differentially expressed gene; KEGG, Kyoto Encyclopedia of Genes and Genomes.
Discussion
The present study analyzed differential gene expressions, protein-protein interactions and GO term and KEGG pathway enrichment of the microarray profile GSE8977, and identified a total of 234 DEGs between normal and IDC breast tumor samples. The DEGs were revealed to be related to immune response, cell adhesion, proliferation and development-related functions and pathways. In addition, EGFR and SYK were identified as hub nodes in the PPI network or the subnetwork, respectively. Of the downregulated DEGs, three were identified as TFs, including SPI1, lymphoid enhancer-binding factor 1 (LEF1) and pre-B-cell leukemia homeobox 3 (PBX3), of which SPI1 is a known oncogene; two other downregulated genes, capping actin protein, gelsolin like (CAPG) and tumor protein p53-inducible nuclear protein 1 (TP53INP1), were identified as TS genes. The upregulated DEGs also included TFs and TS genes, such as transcription factor 7-like 2 (TCF7L2) and pleiomorphic adenoma gene-like 1 (PLAGL1).
During the process of breast cancer metastasis, it is essential for the invasion of tumor cells to cause changes of cell adhesion, which allows them to invade into the surrounding host tissues (6). Thus, it is speculated that alteration of the genes and/or proteins that participate in cell adhesion or immune-related processes may have an influence on metastasis. A previous study has demonstrated that CAPG protein expression may inhibit tumorigenesis since they were lost at the stage of tumorigenesis in certain cancer cell lines, thus it has been proposed to be a TS gene (23). It has recently been reported as a potential biomarker for bone metastasis in breast cancer (24). These results are confirmed by the present findings, which demonstrated that its expression was downregulated and was regarded as a TS gene in breast cancer metastasis. TP53INP1 is another downregulated TS gene identified by the present study, which has been reported to be associated with inflammation diseases (25). The expression level of TP53INP1 was negatively associated with parameters such as tumor size, high histological grade, lymph node metastasis and aberrant p53 expression (26). TP53INP1 may suppress breast carcinoma since it was regulated by microRNA-34a which is a known suppressor of metastasis (27).
Previous in vivo experiments have verified that the downregulation of PBX3 expression was able to suppress tumor growth and metastases (28). LEF1 has been associated with the regulation of cell proliferation, and human breast cancer cells transfected with LEF1 small interfering RNA resulted in a significant arrest at the G2/M phase of the cell cycle (29). SPI1 has been reported to be crucial for the differentiation or activation of macrophages or B cells (30). Macrophages and B cells are involved in differentiation and immune-related processes, and they are found in the tumor microenvironment (30), thus may influence tumor progression. It may be inferred that the aforementioned TFs serve significant roles in breast cancer metastasis, and these roles may be through their involvement in the immune response. However, their potential targets need to be further explored.
Cell adhesion and proliferation are important processes that are associated with metastasis of various cancers (31,32). PLAGL1 is a zinc-finger nuclear transcription factor that that has been reported to be involved in cellular proliferation in various cancer types (33). Enrichment analysis of the present study identified PLAGL1 as highly associated with the regulation of epithelial cell proliferation, which implied that it may participate in this function and, thus, may influence breast cancer metastasis. TCF7L2 has been implicated in colorectal cancer (34). The T cell factor/β-catenin protein complex is oncogenic and serves significant roles in regulating cell adhesion, and TCF7L2 acts as an antagonist of this complex, which suggested the importance of TCF7L2 in cancer as a TS gene involved in cell adhesion. Notably, although the present study predicted TCF7L2 as a TS gene, its expression was revealed to be upregulated. On this basis, it was speculated that during breast cancer metastasis, TCF7L2 may serve a specific and different role compared with other, downregulated, TS genes. However, the inhibitory effects on metastasis by the upregulation of TCF7L2 expression may be small compared with the oncogenic roles of other genes. Nevertheless, it is likely that disturbed function of cell adhesion by TCF7L2 might be important in the metastasis of breast cancer.
EGFR is a member of the type 1 family of cell surface receptor tyrosine kinases that has been correlated with numerous cancer types, including breast cancer (35). In addition, EGFR was demonstrated to be highly expressed in breast tumor cells with lymph node metastasis (36). Ephrin type-A receptor 2 (EPHA2) is a member of the Eph-receptor family and is commonly overexpressed in many types of cancers and contributes to the metastasis (37). EphA2 was reported to be induced by cell adhesion, and this increased expression was revealed to be dependent on the activation of EGFR (37). This result suggested the potential involvement of EGFR in cell adhesion. Combining these previous findings with the enrichment analysis of the present study, which demonstrated that EGFR was an upregulated oncogene with the highest degree in the PPI network, it may be hypothesized that for breast cancer metastasis, EGFR may might exert its function by affecting cell adhesion, and high levels of EGFR expression may be used as a strong prognosis gene.
SYK is a protein tyrosine kinase that is widely expressed in hematopoietic cells, and has been reported to have a close association with leukemia (38) and lymphoma (39). SYK expression was previously demonstrated to be common in normal human breast tissue; however its expression is low or undetectable in invasive breast carcinoma. In addition, SYK was revealed to function as a TS gene in breast cancer by reducing cell motility and invasion (40). Conversely, loss of SYK expression was reported to be associated with increased cellular invasiveness (41). Expression and signaling activity of SYK represents a favorable prognostic factor in breast cancer (42). SYK-regulated genes are important for breast cancer metastasis, as they may regulate immune responses, cell differentiation and cell adhesion pathways, which suggested that SYK may be used as an effective inhibitor for breast cancer metastasis.
In conclusion, the present study used a series of bioinformatics analyses to provide potential biomarkers such as CAPG, TP53INP1, SPI1, LEF1, PBX3, TCF7L2, PLAGL1, EGFR and SYK for breast cancer metastasis. Many of these DEGs such as LEF1, SPI1, PLAGL1 and TCF7L2 were associated with cell adhesion, cellular proliferation or the immune response and may influence the metastasis of breast cancer through the regulation of these function or pathways. However, these predictions require validation by in vitro and in vivo experiments. This study provides novel insights for breast cancer metastasis and suggests promising targets for inhibiting breast cancer metastasis.
References
- 1.Siegel R, Ma J, Zou Z, Jemal A. Cancer statistics, 2014. CA Cancer J Clin. 2014;64:9–29. doi: 10.3322/caac.21208. [DOI] [PubMed] [Google Scholar]
- 2.Lockman PR, Mittapalli RK, Taskar KS, Rudraraju V, Gril B, Bohn KA, Adkins CE, Roberts A, Thorsheim HR, Gaasch JA, et al. Heterogeneous blood-tumor barrier permeability determines drug efficacy in experimental brain metastases of breast cancer. Clin Cancer Res. 2010;16:5664–5678. doi: 10.1158/1078-0432.CCR-10-1564. [DOI] [PMC free article] [PubMed] [Google Scholar]
- 3.Kozlow W, Guise TA. Breast cancer metastasis to bone: Mechanisms of osteolysis and implications for therapy. J Mammary Gland Biol Neoplasia. 2005;10:169–180. doi: 10.1007/s10911-005-5399-8. [DOI] [PubMed] [Google Scholar]
- 4.Minn AJ, Gupta GP, Siegel PM, Bos PD, Shu W, Giri DD, Viale A, Olshen AB, Gerald WL, Massagué J. Genes that mediate breast cancer metastasis to lung. Nature. 2005;436:518–524. doi: 10.1038/nature03799. [DOI] [PMC free article] [PubMed] [Google Scholar]
- 5.Weigelt B, Peterse JL, van't Veer LJ. Breast cancer metastasis: Markers and models. Nat Rev Cancer. 2005;5:591–602. doi: 10.1038/nrc1670. [DOI] [PubMed] [Google Scholar]
- 6.Scully OJ, Bay BH, Yip G, Yu Y. Breast cancer metastasis. Cancer Genomics-Proteomics. 2012;9:311–320. [PubMed] [Google Scholar]
- 7.Dontu G, El-Ashry D, Wicha MS. Breast cancer, stem/progenitor cells and the estrogen receptor. Trends Endocrinol Metab. 2004;15:193–197. doi: 10.1016/j.tem.2004.05.011. [DOI] [PubMed] [Google Scholar]
- 8.Bhowmick NA, Neilson EG, Moses HL. Stromal fibroblasts in cancer initiation and progression. Nature. 2004;432:332–337. doi: 10.1038/nature03096. [DOI] [PMC free article] [PubMed] [Google Scholar]
- 9.Slamon DJ, Leyland-Jones B, Shak S, Fuchs H, Paton V, Bajamonde A, Fleming T, Eiermann W, Wolter J, Pegram M, et al. Use of chemotherapy plus a monoclonal antibody against HER2 for metastatic breast cancer that overexpresses HER2. N Engl J Med. 2001;344:783–792. doi: 10.1056/NEJM200103153441101. [DOI] [PubMed] [Google Scholar]
- 10.Hong B, Li H, Zhang M, Xu J, Lu Y, Zheng Y, Qian J, Chang JT, Yang J, Yi Q. p38 MAPK inhibits breast cancer metastasis through regulation of stromal expansion. Int J Cancer. 2015;136:34–43. doi: 10.1002/ijc.28958. [DOI] [PMC free article] [PubMed] [Google Scholar]
- 11.Phadke PA, Vaidya KS, Nash KT, Hurst DR, Welch DR. BRMS1 suppresses breast cancer experimental metastasis to multiple organs by inhibiting several steps of the metastatic process. Am J Pathol. 2008;172:809–817. doi: 10.2353/ajpath.2008.070772. [DOI] [PMC free article] [PubMed] [Google Scholar]
- 12.Karnoub AE, Dash AB, Vo AP, Sullivan A, Brooks MW, Bell GW, Richardson AL, Polyak K, Tubo R, Weinberg RA. Mesenchymal stem cells within tumour stroma promote breast cancer metastasis. Nature. 2007;449:557–563. doi: 10.1038/nature06188. [DOI] [PubMed] [Google Scholar]
- 13.Irizarry RA, Hobbs B, Collin F, Beazer-Barclay YD, Antonellis KJ, Scherf U, Speed TP. Exploration, normalization, and summaries of high density oligonucleotide array probe level data. Biostatistics. 2003;4:249–264. doi: 10.1093/biostatistics/4.2.249. [DOI] [PubMed] [Google Scholar]
- 14.Gautier L, Cope L, Bolstad BM, Irizarry RA. affy-analysis of Affymetrix GeneChip data at the probe level. Bioinformatics. 2004;20:307–315. doi: 10.1093/bioinformatics/btg405. [DOI] [PubMed] [Google Scholar]
- 15.Smyth GK. Bioinformatics and computational biology solutions using R and Bioconductor. Springer; 2005. Limma: Linear models for microarray data; pp. 397–420. [DOI] [Google Scholar]
- 16.Ashburner M, Ball CA, Blake JA, Botstein D, Butler H, Cherry JM, Davis AP, Dolinski K, Dwight SS, Eppig JT, et al. Gene ontology: Tool for the unification of biology. The Gene Ontology Consortium. Nat Genet. 2000;25:25–29. doi: 10.1038/75556. [DOI] [PMC free article] [PubMed] [Google Scholar]
- 17.Kanehisa M, Goto S. KEGG: Kyoto encyclopedia of genes and genomes. Nucleic Acids Res. 2000;28:27–30. doi: 10.1093/nar/28.1.27. [DOI] [PMC free article] [PubMed] [Google Scholar]
- 18.Zhao M, Sun J, Zhao Z. TSGene: A web resource for tumor suppressor genes. Nucleic Acids Res. 2013;41:D970–D976. doi: 10.1093/nar/gks937. [DOI] [PMC free article] [PubMed] [Google Scholar]
- 19.Chen JS, Hung WS, Chan HH, Tsai SJ, Sun HS. In silico identification of oncogenic potential of fyn-related kinase in hepatocellular carcinoma. Bioinformatics. 2013;29:420–427. doi: 10.1093/bioinformatics/bts715. [DOI] [PubMed] [Google Scholar]
- 20.Franceschini A, Szklarczyk D, Frankild S, Kuhn M, Simonovic M, Roth A, Lin J, Minguez P, Bork P, von Mering C, Jensen LJ. STRING v9. 1: Protein-protein interaction networks, with increased coverage and integration. Nucleic Acids Res. 2013;41:D808–D815. doi: 10.1093/nar/gks1094. [DOI] [PMC free article] [PubMed] [Google Scholar]
- 21.Shannon P, Markiel A, Ozier O, Baliga NS, Wang JT, Ramage D, Amin N, Schwikowski B, Ideker T. Cytoscape: A software environment for integrated models of biomolecular interaction networks. Genome Res. 2003;13:2498–2504. doi: 10.1101/gr.1239303. [DOI] [PMC free article] [PubMed] [Google Scholar]
- 22.Beisser D, Klau GW, Dandekar T, Müller T, Dittrich MT. BioNet: An R-Package for the functional analysis of biological networks. Bioinformatics. 2010;26:1129–1130. doi: 10.1093/bioinformatics/btq089. [DOI] [PubMed] [Google Scholar]
- 23.Watari A, Takaki K, Higashiyama S, Li Y, Satomi Y, Takao T, Tanemura A, Yamaguchi Y, Katayama I, Shimakage M, et al. Suppression of tumorigenicity, but not anchorage independence, of human cancer cells by new candidate tumor suppressor gene CapG. Oncogene. 2006;25:7373–7380. doi: 10.1038/sj.onc.1209732. [DOI] [PubMed] [Google Scholar]
- 24.Westbrook JA, Cairns DA, Peng J, Speirs V, Hanby AM, Holen I, Wood SL, Ottewell PD, Marshall H, Banks RE, et al. CAPG and GIPC1: Breast cancer biomarkers for bone metastasis development and treatment. J Natl Cancer Inst. 2016;108 doi: 10.1093/jnci/djv360. [DOI] [PMC free article] [PubMed] [Google Scholar]
- 25.Jiang PH, Motoo Y, Iovanna JL, Pébusque MJ, Xie MJ, Okada G, Sawabu N. Tumor protein p53-induced nuclear protein 1 (TP53INP1) in spontaneous chronic pancreatitis in the WBN/Kob rat: Drug effects on its expression in the pancreas. JOP. 2004;5:205–216. [PubMed] [Google Scholar]
- 26.Ito Y, Motoo Y, Yoshida H, Iovanna JL, Takamura Y, Miya A, Kuma K, Miyauchi A. Decreased expression of tumor protein p53-induced nuclear protein 1 (TP53INP1) in breast carcinoma. Anticancer Res. 2006;26:4391–4395. [PubMed] [Google Scholar]
- 27.Peurala H, Greco D, Heikkinen T, Kaur S, Bartkova J, Jamshidi M, Aittomäki K, Heikkilä P, Bartek J, Blomqvist C, et al. MiR-34a expression has an effect for lower risk of metastasis and associates with expression patterns predicting clinical outcome in breast cancer. PLoS One. 2011;6:e26122. doi: 10.1371/journal.pone.0026122. [DOI] [PMC free article] [PubMed] [Google Scholar]
- 28.Han HB, Gu J, Zuo HJ, Chen ZG, Zhao W, Li M, Ji DB, Lu YY, Zhang ZQ. Let-7c functions as a metastasis suppressor by targeting MMP11 and PBX3 in colorectal cancer. J Pathol. 2012;226:544–555. doi: 10.1002/path.3014. [DOI] [PubMed] [Google Scholar]
- 29.Bucan V, Mandel K, Bertram C, Lazaridis A, Reimers K, Park-Simon TW, Vogt PM, Hass R. LEF-1 regulates proliferation and MMP-7 transcription in breast cancer cells. Genes Cells. 2012;17:559–567. doi: 10.1111/j.1365-2443.2012.01613.x. [DOI] [PubMed] [Google Scholar]
- 30.Lloberas J, Soler C, Celada A. The key role of PU.1/SPI-1 in B cells, myeloid cells and macrophages. Immunol Today. 1999;20:184–189. doi: 10.1016/S0167-5699(99)01442-5. [DOI] [PubMed] [Google Scholar]
- 31.Kannagi R, Izawa M, Koike T, Miyazaki K, Kimura N. Carbohydrate-mediated cell adhesion in cancer metastasis and angiogenesis. Cancer Sci. 2004;95:377–384. doi: 10.1111/j.1349-7006.2004.tb03219.x. [DOI] [PMC free article] [PubMed] [Google Scholar]
- 32.Slack-Davis JK, Atkins KA, Harrer C, Hershey ED, Conaway M. Vascular cell adhesion molecule-1 is a regulator of ovarian cancer peritoneal metastasis. Cancer Res. 2009;69:1469–1476. doi: 10.1158/0008-5472.CAN-08-2678. [DOI] [PubMed] [Google Scholar]
- 33.Yu K, Lee CH, Tan PH, Tan P. Conservation of breast cancer molecular subtypes and transcriptional patterns of tumor progression across distinct ethnic populations. Clin Cancer Res. 2004;10:5508–5517. doi: 10.1158/1078-0432.CCR-04-0085. [DOI] [PubMed] [Google Scholar]
- 34.Lepourcelet M, Chen YN, France DS, Wang H, Crews P, Petersen F, Bruseo C, Wood AW, Shivdasani RA. Small-molecule antagonists of the oncogenic Tcf/beta-catenin protein complex. Cancer Cell. 2004;5:91–102. doi: 10.1016/S1535-6108(03)00334-9. [DOI] [PubMed] [Google Scholar]
- 35.Ferraro DA, Gaborit N, Maron R, Cohen-Dvashi H, Porat Z, Pareja F, Lavi S, Lindzen M, Ben-Chetrit N, Sela M, Yarden Y. Inhibition of triple-negative breast cancer models by combinations of antibodies to EGFR. Proc Natl Acad Sci USA. 2013;110:1815–1820. doi: 10.1073/pnas.1220763110. [DOI] [PMC free article] [PubMed] [Google Scholar]
- 36.Liu Y, Ji R, Li J, Gu Q, Zhao X, Sun T, Wang J, Li J, Du Q, Sun B. Correlation effect of EGFR and CXCR4 and CCR7 chemokine receptors in predicting breast cancer metastasis and prognosis. J Exp Clin Cancer Res. 2010;29:16. doi: 10.1186/1756-9966-29-16. [DOI] [PMC free article] [PubMed] [Google Scholar]
- 37.Larsen AB, Stockhausen MT, Poulsen HS. Cell adhesion and EGFR activation regulate EphA2 expression in cancer. Cell Signal. 2010;22:636–644. doi: 10.1016/j.cellsig.2009.11.018. [DOI] [PubMed] [Google Scholar]
- 38.Goodman PA, Wood CM, Vassilev A, Mao C, Uckun FM. Spleen tyrosine kinase (Syk) deficiency in childhood pro-B cell acute lymphoblastic leukemia. Oncogene. 2001;20:3969–3978. doi: 10.1038/sj.onc.1204515. [DOI] [PubMed] [Google Scholar]
- 39.Gururajan M, Dasu T, Shahidain S, Jennings CD, Robertson DA, Rangnekar VM, Bondada S. Spleen tyrosine kinase (Syk), a novel target of curcumin, is required for B lymphoma growth. J Immunol. 2007;178:111–121. doi: 10.4049/jimmunol.178.1.111. [DOI] [PubMed] [Google Scholar]
- 40.Coopman PJ, Do MT, Barth M, Bowden ET, Hayes AJ, Basyuk E, Blancato JK, Vezza PR, McLeskey SW, Mangeat PH, Mueller SC. The Syk tyrosine kinase suppresses malignant growth of human breast cancer cells. Nature. 2000;406:742–747. doi: 10.1038/35021086. [DOI] [PubMed] [Google Scholar]
- 41.Yuan Y, Liu H, Sahin A, Dai JL. Reactivation of SYK expression by inhibition of DNA methylation suppresses breast cancer cell invasiveness. Int J Cancer. 2005;113:654–659. doi: 10.1002/ijc.20628. [DOI] [PubMed] [Google Scholar]
- 42.Dejmek J, Leandersson K, Manjer J, Bjartell A, Emdin SO, Vogel WF, Landberg G, Andersson T. Expression and signaling activity of Wnt-5a/discoidin domain receptor-1 and Syk plays distinct but decisive roles in breast cancer patient survival. Clin Cancer Res. 2005;11:520–528. [PubMed] [Google Scholar]