

Abstract
It is not established whether de-methylation of the displacement loop (D-loop) region if mitochondrial DNA (mtDNA) directly influences mtDNA copy number and further alters the cell cycle, apoptosis and cell proliferation in colorectal cancer. The current study employed cell viability assays, cell cycle analysis, and mtDNA methylation analysis using 5 colorectal cancer cell lines. The present results demonstrated that 5-aza-2′-deoxycytidine (5-AZA), a DNA hypomethylating agent, significantly increased proliferation of Lovo and Colo-205 colorectal cancer cell lines. In Colo-205 cells, the proportion of G0/G1 phase cells was increased following 5-AZA treatment. Additionally, the apoptosis rate in Colo-205 cells was decreased by 5-AZA treatment. Compared with their controls, a significantly higher mtDNA copy number was observed in Colo-205 and Lovo cells following 5-AZA treatment. Notably, the Colo-205 and Lovo cells had relatively higher methylation levels at the 4 and 6th/7th CpG sites of D-loop region, respectively, compared with the levels at the corresponding sites following 5-AZA treatment. However, in HCT116, SW480, LS-174T, and HT-29 cells, 5-AZA treatment did not induce a significant change in proliferation, cell cycle, apoptosis and mtDNA copy number. Demethylation at the 4 and 6th/7th CpG sites of the D-loop region of HCT116, SW480, LS-174T and HT-29 cells was not observed following 5-AZA treatment. In conclusion, de-methylation of specific sites on CpG islands of D-loop promoter may lead to the elevation of mtDNA copy number in colorectal cancer, triggering alterations in biological behaviors, including increased cell proliferation, reduced apoptosis and a relative cell cycle arrest in G0/G1 phase.
Keywords: colorectal cancer, displacement loop region, methylation, mitochondrial DNA
Introduction
It is estimated that in 2016, 8% of all cancer-associated mortalities will be attributed to colorectal cancer (1). It has long been established that the mitochondrial genome is involved for maintenance of malignant behavior of cancer cells (2), and mitochondrial DNA (mtDNA) alterations have previously been detected in colorectal cancer (3). In our previous study, the mtDNA copy number was demonstrated to be higher in colorectal cancer tissues than in corresponding non-cancerous tissues, and the de-methylation of the D-loop region was also observed in colorectal cancer tissues (4). However, it is not clear whether de-methylated displacement loop (D-loop) region will directly influence the mtDNA copy number and further alter the cell cycle, apoptosis and cell proliferation in colorectal cancer.
Decitabine, also known as 5-aza-2′-deoxycytidine (5-AZA), is a cytidine analogue that can incorporate into DNA and inhibit DNA methyltransferases irreversibly to de-methylate DNA (5). Thus, 5-AZA was used to induce de-methylation in HCT116, Lovo, SW480, Colo-205, LS-174T and HT-29 cells in the current study to determine whether there would be a change in biological behavior and mtDNA copy number of colorectal cancer cells. Additionally, the effects of 5-AZA on the methylation rate of a fragment of the D-loop promoter region were investigated to elucidate the potential mechanism of the changes.
Materials and methods
Cell culture and treatments
HCT116, Lovo, SW480, Colo-205, LS-174T, and HT-29 cells were bought from the Type Culture Collection of the Chinese Academy of Sciences (Shanghai, China). HCT116, Lovo, SW480 and Colo-205 cells were cultured in RPMI-1640 (HyClone; GE Healthcare Life Sciences, Logan, UT, USA) containing 10% fetal bovine serum (FBS; Gibco; Thermo Fisher Scientific, Inc., Waltham, MA, USA). LS-174T and HT-29 cells were cultured in Dulbecco's modified Eagle's medium (DMEM; HyClone; GE Healthcare Life Sciences) containing 10% FBS. Cells were incubated at 37°C in a fully humidified atmosphere with 5%CO2/95% O2.
Cells were serum-starved with 2% FBS for 6 h before treatment. Various concentrations of 5-AZA (Sigma-Aldrich; Merck KGaA, Darmstadt, Germany) were diluted in dimethyl sulfoxide (DMSO) immediately before incubation and were added to the culture medium for 24 h of incubation.
Cell viability assays
A Cell Counting Kit-8 (CCK-8) kit (Dojindo Molecular Technologies, Inc., Kumamoto, Japan) was utilized to determine cell viability following 5-AZA treatment according to the manufacturer's instructions. Serial concentrations (1, 2.5, 5, and 10 µM) of 5-AZA were used to treat cells (5,000 cells/well) for 24 h, followed by the addition of 10 µl CCK-8 solution to each well for 2 h of incubation at 37°C. The optical density of each well was measured at 450 nm. Cell viability was expressed as a percentage of the control.
Cell cycle analysis
Cells were exposed to 5 µM of 5-AZA or DMSO for 24 h. DNA staining was subsequently performed using propidium iodide (6). Flow cytometry was used to calculate the proportions of cell cycle phase distribution. A total of 10,000 cells were obtained and the data were analyzed using ModFit software (Verity Software House, Inc., Topsham, ME, USA).
Detection of apoptosis
Cells (1×10⁶) were incubated in the culture medium with 5 µM 5-AZA or DMSO for 24 h. Subsequently, Annexin V-fluorescein isothiocyanate (FITC) and PI (BD Biosciences, Franklin Lakes, NJ, USA) were added for double staining. After incubation at 37°C 15 min in the dark, both Annexin V-FITC and PI fluorescence were determined by bivariate flow cytometry using the Navios software (Beckman Coulter, Inc., Brea, CA, USA).
Mito-tracker green for staining mtDNA
The mitochondria of cultured cells were detected by fluorescent probe Mito-Tracker Green (Beyotime Institute of Biotechnology, Haimen, China) according to the manufacture's protocol. Cells were cultured with 5 µM 5-AZA or DMSO on coverslips in 24-well plates for 24 h. At the end of treatment, cells were incubated with 50 nM Mito-Tracker Green in DMEM or RPMI-1640, depending on the type of cell used, for 30 min at 37°C in darkness. After final washing, mtDNA was observed under a fluorescent microscope.
Quantitative polymerase chain reaction (qPCR) for quantifying mtDNA copy number
mtDNA of cells was extracted with a QIAamp DNA Mini kit (Qiagen, GmbH, Hilden, Germany) following incubation with 5 µM 5-AZA or DMSO for 24 h. Subsequently, qPCR was performed with mtDNA specific primer (forward, 5′-TACTCACCAGACGCCTCAACCG-3′; reverse, 5′-TTATCGGAATGGGAGGTGATTC-3′). β-actin (forward, 5′-CGGGAAATCGTGCGTGACAT-3′; reverse, 5′-GAAGGAAGGCTGGAAGAGTG-3′) was used as the control. Primers were purchased from Invitrogen (Thermo Fisher Scientific, Inc.). Reactions were performed out in a 25 µl volume containing 12.5 µl 2xSYBR Premix Ex Taq (BioRad Laboratories, Inc., Hercules, CA, USA), 1.0 µl forward primer (10 mM), 1.0 µl reverse primer (10 mM), 2.0 µl DNA template (100 ng) and 8.5 µl dH2O. The cycling conditions were as follows: 95°C for 30 sec followed by 40 cycles of 95°C for 5 sec and 60°C for 30 sec. The relative mtDNA copy number (mtDNA/β-actin) was calculated. Then, results between cells treated with 5-AZA was compared with the corresponding cells treated with DMSO.
mtDNA methylation analysis
mtDNA was isolated with a QIAamp DNA Mini kit (Qiagen GmbH) from the cells after 5 µM 5-AZA treatment for 24 h. The product concentration was verified using a spectrophotometer based on the absorbance at 260 and 280 nm. Subsequently, 1.5 µg mtDNA from each sample underwent bisulfite conversion with the EZ DNA Methylation-Gold Kit (Zymo Research Corp, Irvine, CA, USA) according to the manufacture's protocol. Finally, Sequenom MassARRAY platform (CapitalBio Technology Co., Ltd., Beijing, China), composed of matrix-assisted laser desorption/ionization-time of flight (MALDI-TOF) mass spectrometry in combination with RNA base-specific cleavage, was used to perform quantitative DNA methylation analysis, determining the methylation level of CpG sites. A detailed description of procedure was described previously (7). The PCR primers were designed using Epidesigner (http://www.epidesigner.com), based on reverse complementary strands of D-loop promoter. A T7-promoter tag for in vitro transcription was added to reverse primer, and the forward primer was 10 mer-tagged to balance the PCR. The primers are listed as follows: Forward, 5′-aggaagagagTTG TGT GGA AAG TGG TTG TGT AGA TA-3′; reverse, 5′-cag taa tac gac tca cta tag gga gaa ggc tCTC AAA TAA AAA TCC CTT AAC CAC C-3′. The primers amplified base pairs 302 to 766 of the target promoter and in total, 14 CpG islands were analyzed. Spectra methylation ratios were generated by the EpiTYPER software ver. 1.0 (Sequenom, San Diego, CA, USA).
Statistical analysis
Data are presented as the mean ± standard deviation of 3 independent experiments. Quantitative data were analyzed by paired-samples Student's t-test for pair-wise comparisons or one-way analysis of variance followed with Student-Newman-Keuls multiple comparisons test using SPSS 19.0 software (IBM Corp., Armonk, NY, USA). P<0.05 was considered to indicate a statistically significant difference.
Results
Effects of 5-AZA on colorectal cancer cells proliferation
After incubation for 24 h with serial concentrations of 5-AZA (0, 1, 2.5, 5, and 10 µM), the viability of cancer cell lines was assessed by CCK-8 (Fig. 1). Proliferation of Lovo and Colo-205 cells was increased by 5-AZA in a dose dependent manner (Fig. 1A; P<0.05). More precisely, 2.5, 5 and 10 µM 5-AZA significantly increased the proliferation of Lovo and Colo-205 cells. By contrast, 5-AZA had a relatively detrimental effect on the viability of HCT116, SW480, LS-174T and HT-29 cells (Fig. 1B). However, the results were not significant, even when the concentration of 5-AZA was as high as 5 or 10 µM.
Figure 1.

Cell viability assays following treatment with serial concentrations (0, 1, 2.5, 5, and 10 µM) of 5-AZA. (A) Cell viability of Colo-205 and Lovo. (B) Cell viability of HCT116, SW480, LS-174T, and HT-29. Data are presented as the mean ± standard deviation of 3 independent experiments. *P<0.05 vs. Colo-205 0 µM control; #P<0.05 vs. Lovo 0 µM control. 5-AZA, 5-aza-2′-deoxycytidine.
Effects of 5-AZA on cell cycle
Cells were treated with 5 µM 5-AZA to further evaluate the cause of modified proliferation in the cells by using flow cytometry to evaluate cell cycle phase distribution. As is presented in Fig. 2A, the proportion of G0/G1 phase was 72.66±1.68% in Colo-205 cells incubated with DMSO, while the proportion was increased to 83.30±0.80% following 5 µM 5-AZA treatment. Furthermore, the proportion of S phase was 20.13±1.95% in Colo-205 cells incubated with DMSO, while the proportion was reduced to 9.34±2.01% following 5 µM 5-AZA treatment. The proportion of G2/M phase Colo-205 cells was relatively stable with or without 5-AZA treatment. For other cell lines analyzed, there was no significant change in cell cycle phase distribution (Fig. 2B).
Figure 2.

Cell cycle analysis determined by flow cytometry. (A) Representative cell cycle analysis of Colo-205 cells with or without 5 µM 5-AZA treatment demonstrating cell cycle phase distribution. (B) Cell cycle analysis for each cell lines with or without 5 µM 5-AZA treatment, presenting relative percentage of cell cycle phase distribution. 5-AZA, 5-aza-2′-deoxycytidine.
Effects of 5-AZA on apoptosis
Flow cytometry was performed to measure apoptosis. Compared with DMSO treatment, 5 µM 5-AZA led to markedly increased Annexin V-FITC binding in Colo-205 cells (Fig. 3A). Additionally, in Colo-205, the apoptosis rate decreased from 21.80±1.61 to 7.40±0.68% following 5 µM 5-AZA treatment, which was significantly lower than the rate of the control (Fig. 3B; P<0.05). For the other cell lines, no significant results were detected with or without 5-AZA incubation.
Figure 3.

Detection of apoptosis by flow cytometry. (A) PI and FITC-Annexin V co-staining identified cell death of Colo-205 cells with or without 5 µM 5-AZA treatment. Apoptosis rate was the sum of the upper and lower right quadrant of each plot. (B) Apoptosis rate for each cells lines with or without 5 µM 5-AZA treatment. #P<0.05 vs. DMSO. DMSO, dimethyl sulfoxide; PI, propidium iodide; FITC, fluorescein isothiocyanate; 5-AZA, 5-aza-2′-deoxycytidine.
Effects of 5-AZA on mtDNA
The changes in mtDNA following 5-AZA treatment were investigated. Visualization of mitochondria was achieved using the fluorescent probe Mito-Tracker Green and the corresponding mtDNA copy number was determined by qPCR (Fig. 4). Compared with their controls, stronger staining intensity (Fig. 4A and B) and significantly higher mtDNA copy number (Fig. 4C) was only observed in Colo-205 and Lovo cells, following 5 µM 5-AZA treatment (P<0.05). However, in HCT116, SW480, LS-174T, and HT-29 cells, 5-AZA treatment did not induce a significant change in staining intensity of mitochondria or mtDNA copy number.
Figure 4.

Mito-Tracker Green staining of mitochondria and determination of relative mtDNA copy number. (A) Mito-Tracker Green staining of mitochondria in Colo-205 cells with or without 5 µM 5-AZA treatment. (B) Mito-Tracker Green staining of mitochondria in Lovo cells with or without 5 µM 5-AZA treatment. (C) Relative mtDNA copy number of cell lines treated with or without 5 µM 5-AZA. #P<0.05 vs. DMSO. DMSO, dimethyl sulfoxide; 5-AZA, 5-aza-2′-deoxycytidine; mtDNA, mitochondrial DNA.
Effects of 5-AZA on methylation of mtDNA D-loop region
At total of 18 CpG sites (divided into 12 CpG units) were examined in base pairs 302 to 766 of the D-loop promoter of, since 2nd, 10, 16, and 18th CpG sites were not available to be examined (Fig. 5A). In addition, the methylation patterns of different cells within the D-loop promoter region are presented in Fig. 5B. The Colo-205 and Lovo cells had relatively high methylation levels at the 4 and 6th/7th CpG sites compared with the levels at the corresponding sites after 5 µM 5-AZA treatment, respectively. Then, quantitatively, the methylation levels at the 4 and 6th/7th CpG sites for cells were measured (Fig. 6). In terms of methylation level at the 4th CpG site, 5 µM 5-AZA induced significant de-methylation for Colo-205 and Lovo cells (P<0.05), while opposite results were obtained for HCT116, LS-174T, and HT-29 cells (P<0.05; Fig. 6A). No methylation at the 4th CpG site was detected for SW480 with or without 5-AZA treatment. Regarding to CpG sites 6/7, significantly reduced methylation for Colo-205, Lovo, LS-174T, and HT-29 cells was detected (P<0.05) after incubating with 5 µM 5-AZA, however for HCT116 and SW480, a significant increase in methylation was observed (P<0.05; Fig. 6B).
Figure 5.
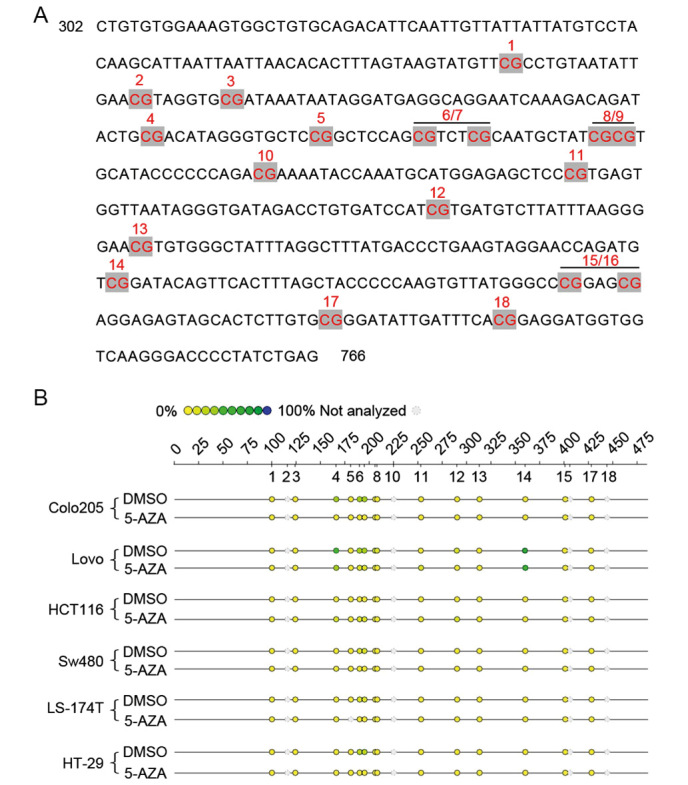
Target mtDNA D-loop promoter and mtDNA methylation analysis. (A) Target promoter with 14 CpG sites (divided into 12 CpG units) in base pairs 302 to 766 of the D-loop promoter. Note, the 2nd, 10, 16, and 18th CpG sites were not available to be examined. (B) mtDNA methylation analysis by Sequenom MassARRAY platform, showing methylation levels of CpG sites for each cell line with or without 5 µM 5-AZA treatment. D-loop, displacement loop; DMSO, dimethyl sulfoxide; 5-AZA, 5-aza-2′-deoxycytidine; mtDNA, mitochondrial DNA.
Figure 6.
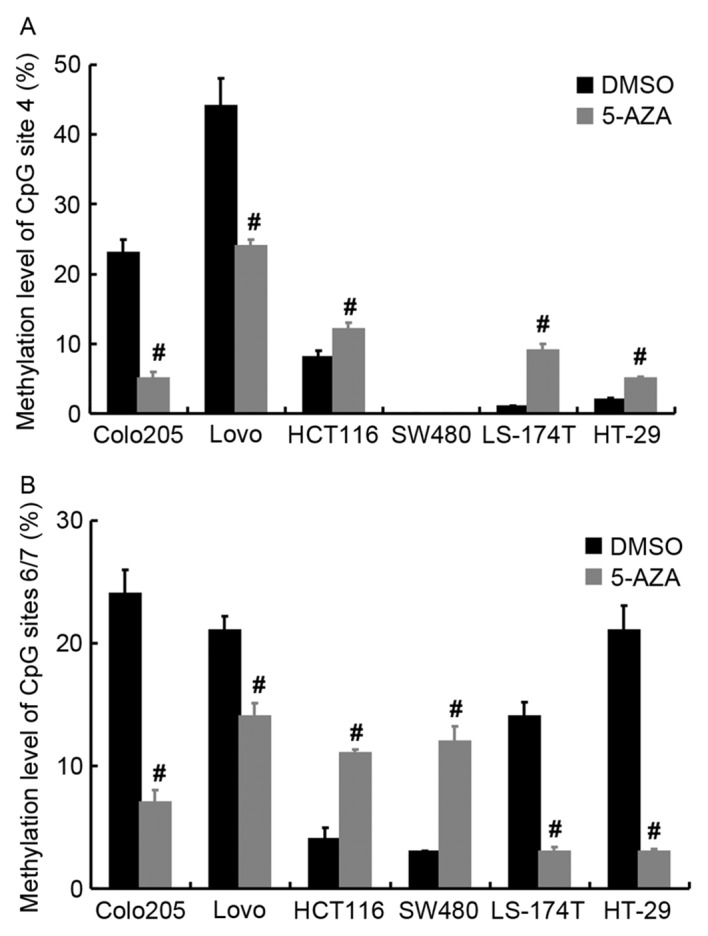
Quantitative methylation level of partial CpG sites. (A) Methylation level of CpG site 4 of cells with or without 5 µM 5-AZA treatment. (B) Methylation level of CpG site 6/7 of cells with or without 5 µM 5-AZA treatment. #P<0.05 vs. DMSO. DMSO, dimethyl sulfoxide; 5-AZA, 5-aza-2′-deoxycytidine; mtDNA, mitochondrial DNA.
Discussion
In the current study, 5-AZA, a DNA hypomethylating agent, was used to treat HCT116, Lovo, SW480, Colo-205, LS-174T and HT-29 cells to determine the effects of de-methylation on cell proliferation, cell cycle, apoptosis and mtDNA. The change of methylation levels of a fragment from the mtDNA D-loop promoter was also measured following 5-AZA treatment. It was observed that 2.5, 5 and 10 µM of 5-AZA promoted proliferation of Lovo and Colo-205 cells. Furthermore, in Colo-205 cells, 5 µM 5-AZA resulted in relative retardation of G0/G1 phase, decreasing the proportion of the cells entering S phase. Notably, 5-AZA did not have obvious effect on G2/M phase. Additionally, reduced apoptosis was observed in 5-AZA (5 µM)-treated Colo-205 cell. An elevation of mtDNA copy number was also observed in Colo-205 and Lovo, following 5 µM 5-AZA treatment. Finally, de-methylation of both 4th and 6th/7th CpG sites was induced following incubation with 5-AZA in Colo-205 and Lovo cells. Combining all the results, we hypothesize that the described alterations may have been initiated by hypomethylation caused by 5-AZA.
As a cytidine analogue, 5-AZA functions to irreversibly inhibit DNA methyltransferases following incorporation into DNA, which is commonly used to treat hematologic cancers and may be potent for the treatment of other types of cancer, including colorectal cancer (8). According to previous studies, 5-AZA causes poor viability, increased apoptosis and cell cycle arrest in various colorectal cancer cell lines (9–14), which is in contrast to the results of the current study. However, the differences in the incubation period and concentration of 5-AZA used may have resulted in discrepancies between the present study and the previous reports. For example, according to Mossman et al (13), 15 µM 5-AZA incubation for 72 h induced significant cell death in SW480 cells. In the same study, however, HCT116 was treated with 15 µM 5-AZA for 72 h, with no obvious cell death observed (13). Further, in another study, a DNA methyltransferase inhibitor similar to 5-AZA, zebularine, was applied to Colo-205 cells, which stimulated Colo-205 cell growth when the concentration was >45 µM (14). Thus, it is unsurprising that the relatively low concentration of 5-AZA (>10 µM), which was used to treat the cells for only 24 h in the present study, did not exhibit an obvious inhibitory effect on colorectal cancer cells.
By contrast, increased viability, retardation of G0/G1 phase completion, decreased apoptosis and higher mtDNA copy number were detected in following 5-AZA (5 µM_ treatment of Colo-205 cells, and similarly, stimulation of cells growth and increased mtDNA copy number were observed in Lovo following 5-AZA treatment. Therefore, it was concluded that the elevated mtDNA copy number may have led to the modified patterns of cell proliferation, cell cycle and apoptosis in Colo-205 and Lovo. Increased mtDNA content increases energy production and thus, more ATP may support increased cell proliferation. Yu et al (15) reported that mtDNA-deficient human breast cancer cell had a slower proliferation rate compared to cells without depletion of mtDNA. Additionally, Dickinson et al (16) reported that, following mtDNA depletion, the proliferation rate of HSR-GBM1 cells was significantly reduced, while the recovery of the proliferative potential of mtDNA depleted tumors was dependent on increased mtDNA copy number, suggesting that increased cell proliferation requires more copies of mtDNA. Regarding apoptosis, Mei et al (17) cultured cancer cell lines to investigate whether the quantity of mtDNA has a role in apoptosis and they observed that elevated mtDNA copy number prevented apoptosis of tumor cells. Finally, regarding the cell cycle, following 5-AZA treatment, Colo-205 cells had an unchanged proportion of cells in G2/M phase, indicating that mitosis was unaffected. Considering that more cells were in G0/G1 phase and less in S phase, it could be interpreted that more biosynthetic activities were required before the cells could replicate genomic DNA and continue through the cell cycle. Coincidentally, a study previously suggested that a so-called ‘pre-S phase’ (between late G0/G1 and early S phase) is the time point when mtDNA is replicated (18). Combining these findings, we hypothesize that the retardation of G0/G1 phase was due to the higher demand for mtDNA, so that cells were actively synthesizing mtDNA, which prolonged the time spent in G0/G1 phase, before they could complete the cell cycle.
Taken together, all these phenomena indicated that increased mtDNA copy number in Colo-205 cells led to the changes in viability, cell cycle and apoptosis. Nevertheless, regarding Lovo cells, the absence of alteration in cell cycle and apoptosis may be attributed to the intrinsic differences between Lovo and Colo-205 cells. In terms of culture properties, Colo-205 is mixed cells, both adherent and suspension, while Lovo is only adherent. In addition, Lovo cells were derived from a metastatic site of colorectal cancer, whereas Colo-205 originated from ascites. These characteristics may have caused the differences observed.
The human mitochondrial D-loop region has 1122 base pairs, and it initiates the transcription and replication of mtDNA (19). It is already established that methylation of the D-loop influences normal function of mtDNA; however, there is very limited research on the associated between the methylation profile of D-loop and mtDNA copy number. Various factors have an impact on mtDNA copy number, mitochondrial transcription factor A (TFAM), for example, which binds to mtDNA and facilitates its transcription by forming mtDNA transcription initiation complex (20). In the present study, CpG sites 4 and 6/7 were methylated in Colo-205 and Lovo cells without 5-AZA treatment. Following de-methylation of these sites, Colo-205 and Lovo had increased quantity of mtDNA. This is in line with our previous research that demonstrated that de-methylated D-loop region was associated with an increased mtDNA copy number in colorectal cancer (4). Thus, de-methylated 4th and 6th/7th CpG sites may promote mtDNA duplication, and the de-methylation may facilitate TFAM binding and initiation of mtDNA transcription (21), although further research is required to validate this hypothesis.
De-methylation of LS-174T and HT-29 was also detected at the 4th CpG site, but not the 6th/7th CpG site. From the view of topology, de-methylated 4th CpG site alone may not be enough to increase the interaction with TFAM compared to when both the 4th and 6th/7th CpG sites re methylated, and thus a change of cell behavior was not induced. Notably, methylation of CpG site 4 of HCT116, LS-174T and HT-29, and CpG site 6/7 of HCT116 and SW480 was increased following 5-AZA treatment, and it this may be due to other unknown mechanisms of 5-AZA or feedback regulation in the cells. The observed discrepancies may be attributed to the nature of the cells, as HCT116, SW480, LS-174T and HT-29 are colorectal carcinoma cells, whereas Colo-205 and Lovo cells are derived from metastatic sites, thus indicating that they are more aggressive in nature. Further studies are required to elucidate the molecular mechanisms that may be involved.
In conclusion, de-methylation of specific sites on CpG islands of D-loop promoter could lead to the elevation of mtDNA copy number in colorectal cancer, triggering alterations in biological behaviors, including increased cell proliferation, reduced apoptosis and a relative retardation of G0/G1 phase. The results of the current study provide a new view regarding to the correlation of methylation rate of D-loop region and the cell biology of colorectal cancer, and this may be a novel route to suppress colorectal cancer.
Acknowledgements
The present study was supported by Natural Science Fund of China (grant nos. 81301770 and 81400637).
References
- 1.Siegel RL, Miller KD, Jemal A. Cancer statistics, 2016. CA Cancer J Clin. 2016;66:7–30. doi: 10.3322/caac.21332. [DOI] [PubMed] [Google Scholar]
- 2.Verschoor ML, Ungard R, Harbottle A, Jakupciak JP, Parr RL, Singh G. Mitochondria and cancer: Past, present, and future. Biomed Res Int. 2013;2013:612369. doi: 10.1155/2013/612369. [DOI] [PMC free article] [PubMed] [Google Scholar]
- 3.Hibi K, Nakayama H, Yamazaki T, Takase T, Taguchi M, Kasai Y, Ito K, Akiyama S, Nakao A. Detection of mitochondrial DNA alterations in primary tumors and corresponding serum of colorectal cancer patients. Int J Cancer. 2001;94:429–431. doi: 10.1002/ijc.1480. [DOI] [PubMed] [Google Scholar]
- 4.Gao J, Wen S, Zhou H, Feng S. De-methylation of displacement loop of mitochondrial DNA is associated with increased mitochondrial copy number and nicotinamide adenine dinucleotide subunit 2 expression in colorectal cancer. Mol Med Rep. 2015;12:7033–7038. doi: 10.3892/mmr.2015.4256. [DOI] [PubMed] [Google Scholar]
- 5.Momparler RL. Pharmacology of 5-Aza-2′-deoxycytidine (decitabine) Semin Hematol. 2005;42(3 Suppl 2):S9–S16. doi: 10.1053/j.seminhematol.2005.05.002. [DOI] [PubMed] [Google Scholar]
- 6.Picca A, Lezza AM. Regulation of mitochondrial biogenesis through TFAM-mitochondrial DNA interactions: Useful insights from aging and calorie restriction studies. Mitochondrion. 2015;25:67–75. doi: 10.1016/j.mito.2015.10.001. [DOI] [PubMed] [Google Scholar]
- 7.Yamada N, Nishida Y, Tsutsumida H, Goto M, Higashi M, Nomoto M, Yonezawa S. Promoter CpG methylation in cancer cells contributes to the regulation of MUC4. Br J Cancer. 2009;100:344–351. doi: 10.1038/sj.bjc.6604845. [DOI] [PMC free article] [PubMed] [Google Scholar]
- 8.Diesch J, Zwick A, Garz AK, Palau A, Buschbeck M, Götze KS. A clinical-molecular update on azanucleoside-based therapy for the treatment of hematologic cancers. Clin Epigenetics. 2016;8:71. doi: 10.1186/s13148-016-0237-y. [DOI] [PMC free article] [PubMed] [Google Scholar]
- 9.Schneider-Stock R, Diab-Assef M, Rohrbeck A, Foltzer-Jourdainne C, Boltze C, Hartig R, Schönfeld P, Roessner A, Gali-Muhtasib H. 5-Aza-cytidine is a potent inhibitor of DNA methyltransferase 3a and induces apoptosis in HCT-116 colon cancer cells via Gadd45- and p53-dependent mechanisms. J Pharmacol Exp Ther. 2005;312:525–536. doi: 10.1124/jpet.104.074195. [DOI] [PubMed] [Google Scholar]
- 10.Hsi LC, Xi X, Wu Y, Lippman SM. The methyltransferase inhibitor 5-aza-2-deoxycytidine induces apoptosis via induction of 15-lipoxygenase-1 in colorectal cancer cells. Mol Cancer Ther. 2005;4:1740–1746. doi: 10.1158/1535-7163.MCT-05-0218. [DOI] [PubMed] [Google Scholar]
- 11.Deng T, Zhang Y. 5-Aza-2′-deoxycytidine reactivates expression of RUNX3 by deletion of DNA methyltransferases leading to caspase independent apoptosis in colorectal cancer Lovo cells. Biomed Pharmacother. 2009;63:492–500. doi: 10.1016/j.biopha.2008.08.013. [DOI] [PubMed] [Google Scholar]
- 12.Xiong H, Chen ZF, Liang QC, Du W, Chen HM, Su WY, Chen GQ, Han ZG, Fang JY. Inhibition of DNA methyltransferase induces G2 cell cycle arrest and apoptosis in human colorectal cancer cells via inhibition of JAK2/STAT3/STAT5 signalling. J Cell Mol Med. 2009;13:3668–3679. doi: 10.1111/j.1582-4934.2009.00661.x. [DOI] [PMC free article] [PubMed] [Google Scholar]
- 13.Mossman D, Kim KT, Scott RJ. Demethylation by 5-aza-2′-deoxycytidine in colorectal cancer cells targets genomic DNA whilst promoter CpG island methylation persists. BMC Cancer. 2010;10:366. doi: 10.1186/1471-2407-10-366. [DOI] [PMC free article] [PubMed] [Google Scholar]
- 14.Flis S, Gnyszka A, Misiewicz-Krzeminska I, Splawinski J. Decytabine enhances cytotoxicit y induced by oxaliplatin and 5-fluorouracil in the colorectal cancer cell line Colo-205. Cancer Cell Int. 2009;9:10. doi: 10.1186/1475-2867-9-10. [DOI] [PMC free article] [PubMed] [Google Scholar]
- 15.Yu M, Shi Y, Wei X, Yang Y, Zhou Y, Hao X, Zhang N, Niu R. Depletion of mitochondrial DNA by ethidium bromide treatment inhibits the proliferation and tumorigenesis of T47D human breast cancer cells. Toxicol Lett. 2007;170:83–93. doi: 10.1016/j.toxlet.2007.02.013. [DOI] [PubMed] [Google Scholar]
- 16.Dickinson A, Yeung KY, Donoghue J, Baker MJ, Kelly RD, McKenzie M, Johns TG, St John JC. The regulation of mitochondrial DNA copy number in glioblastoma cells. Cell Death Differ. 2013;20:1644–1653. doi: 10.1038/cdd.2013.115. [DOI] [PMC free article] [PubMed] [Google Scholar]
- 17.Mei H, Sun S, Bai Y, Chen Y, Chai R, Li H. Reduced mtDNA copy number increases the sensitivity of tumor cells to chemotherapeutic drugs. Cell Death Dis. 2015;6:e1710. doi: 10.1038/cddis.2015.78. [DOI] [PMC free article] [PubMed] [Google Scholar]
- 18.Trinei M, Berniakovich I, Pelicci PG, Giorgio M. Mitochondrial DNA copy number is regulated by cellular proliferation: A role for Ras and p66(Shc) Biochim Biophys Acta. 2006;1757:624–630. doi: 10.1016/j.bbabio.2006.05.029. [DOI] [PubMed] [Google Scholar]
- 19.Ferreira A, Serafim TL, Sardão VA, Cunha-Oliveira T. Role of mtDNA-related mitoepigenetic phenomena in cancer. Eur J Clin Invest. 2015;45(Suppl 1):S44–S49. doi: 10.1111/eci.12359. [DOI] [PubMed] [Google Scholar]
- 20.Kukat C, Davies KM, Wurm CA, Spåhr H, Bonekamp NA, Kühl I, Joos F, Polosa PL, Park CB, Posse V, et al. Cross-strand binding of TFAM to a single mtDNA molecule forms the mitochondrial nucleoid. Proc Natl Acad Sci USA. 2015;112:11288–11293. doi: 10.1073/pnas.1512131112. [DOI] [PMC free article] [PubMed] [Google Scholar]
- 21.Rebelo AP, Williams SL, Moraes CT. In vivo methylation of mtDNA reveals the dynamics of protein-mtDNA interactions. Nucleic Acids Res. 2009;37:6701–6715. doi: 10.1093/nar/gkp727. [DOI] [PMC free article] [PubMed] [Google Scholar]