Abstract
The clinical significance of microRNA (miR)-136-5p in hepatocellular carcinoma (HCC) has not been verified. Therefore, in the current study, the authors aimed to explore miR-136-5p expression and its clinical significance in HCC, as well as to investigate its potential target genes function. The authors detected the levels of miR-136-5p in 101 pairs of HCC and para-cancer tissues via reverse transcription-quantitative polymerase chain reaction. Gene Expression Omnibus database and the Cancer Genome Atlas (TCGA) database were used to further verify the clinical significance of miR-136-5p expression in HCC. The target genes prediction analysis of miR-136-5p, natural language processing (NLP) analysis of HCC in PubMed and gene functional enrichment analysis were conducted. The miR-136-5p level was markedly downregulated in HCC tissue, compared to para-non-tumor tissue. MiR-136-5p expression decreased in HCC patients with metastasis (P=0.004), advance TNM stage (P<0.001), portal vein tumor embolus (P=0.007) and vaso-invasion (P=0.003), compared with those HCC patients with non-metastasis, early TNM stage, non-portal vein tumor embolus and non-vaso-invasion, respectively. In the TCGA database, downregulated miR-136-5p was also observed in HCC tissue compared to normal liver tissue (P<0.001). There were 178 genes obtained from the overlap between predicted targets and NLP analysis. GO and KEGG pathway analyses revealed some significant pathways related to cancers. Downregulation of miR-136-5p may be responsible for the carcinogenesis and aggressiveness of HCC. miR-136-5p may act as an anti-carcinoma miRNA, which is essential for HCC progression through the regulation of various signaling pathways. Thus, miR-136-5p interaction may provide a novel strategy for HCC treatment.
Keywords: miR-136-5p, hepatocellular carcinoma, reverse transcription-quantitative polymerase chain reaction, target genes, gene functional enrichment analysis
Introduction
Hepatocellular carcinoma (HCC), as a common malignancy in China, has a high incidence and poor prognosis (1). Although great progress has been achieved in the treatment of HCC, including surgery, interventional therapy, radiotherapy, chemotherapy and molecular target treatment, the prognosis of HCC is still poor due to the metastasis and recurrence (2). Therefore, it is necessary to explore highly stable and specific molecular targets and provide the basis for early diagnosis of HCC and targeted therapy, in order to improve the prognosis of HCC.
Micro (mi)RNAs, ~22 nucleotides, belong to a large family of non-coding, single stranded RNAs. miRNAs participate in cell growth, hematopoiesis, apoptosis and cell proliferation (3–5). It has been reported that miRNAs contribute to carcinogenesis and progression in cancers by positive or negative regulation of tumor related genes (6,7). Previous studies demonstrated downregulated miR-136-5p expression in epithelial ovarian cancer and glioma cell lines (8,9). However, regarding to non-small cell lung cancer, miR-136-5p was upregulated (10). In addition, miR-136-5p can promote apoptosis of glioma cells induced by chemotherapy (8). As for the role of miR-136-5p in HCC, the only article available was based on an in vitro study (11), which presented that miR-136-5p could attenuate cell migration. However, no publication of the investigation of miR-136-5p expression in HCC tissue is accessible, and the clinical significance of miR-136-5p in HCC remains unknown.
In the present research, the authors explored the expression of miR-136-5p in HCC and its clinical significance for the diagnosis and prediction of prognosis in HCC. Moreover, the potential targets of miR-136-5p and gene functional enrichment analysis were involved to explore the prospective mechanisms in the pathogenesis of HCC.
Materials and methods
Patients and samples
There were 101 HCC and matched adjacent non-tumor tissues selected from 76 men and 19 women at a mean age of 50. The patients, who had no chemotherapy or radiotherapy before the surgery from March 2010 to March 2012, were selected in the First Affiliated Hospital of Guangxi Medical University (Nanning, China). Two pathologists independently confirmed all pathological diagnosis. The clinicopathological factors are summarized in Table I. Written informed consent was gained for the usage of patients' tissue samples.
Table I.
Expression of miR-136-5p and clinicopathological parameters in hepatocellular carcinoma in the 101 pairs detected by real time reverse transcription-quantitative polymerase chain reaction.
| miR-136-5p relevant expression (2−ΔΔCq) | ||||
|---|---|---|---|---|
| Clinicopathological features | n | Mean ± standard deviation | t | P-value |
| Tissue | ||||
| Adjacent non-cancerous liver | 101 | 4.8507±3.0644 | 6.516 | <0.001 |
| Hepatocellular carcinoma | 101 | 2.8460±1.7090 | ||
| Age | ||||
| ≥50 | 51 | 2.9133±1.7885 | 0.398 | 0.692 |
| <50 | 50 | 2.7774±1.6393 | ||
| Gender | ||||
| Male | 80 | 2.8011±1.6987 | 0.813 | 0.609 |
| Female | 21 | 3.0171±1.7797 | ||
| Differentiation | ||||
| High | 7 | 2.1857±1.3570 | F=0.666a | 0.516 |
| Moderate | 64 | 2.8387±1.6319 | ||
| Low | 30 | 3.0157±1.9416 | ||
| Size (cm) | ||||
| <5 | 21 | 3.1014±1.9355 | 0.773 | 0.444 |
| ≥5 | 80 | 2.7790±1.6513 | ||
| Tumor nodes | ||||
| Single | 57 | 2.9779±1.8381 | 0.882 | 0.380 |
| Multiple | 44 | 2.6752±1.5296 | ||
| Metastasis | ||||
| Without metastasis | 49 | 3.3429±1.9272 | 2.943 | 0.004 |
| With metastasis | 52 | 2.3779±1.3307 | ||
| TNM stage | ||||
| I~II | 25 | 4.2680±2.0246 | 4.380 | <0.001 |
| III~IV | 76 | 2.3783±1.2988 | ||
| Portal vein tumor embolus | ||||
| − | 69 | 3.1146±1.8511 | 2.774 | 0.007 |
| + | 32 | 2.2669±1.1827 | ||
| Vaso-invasion | ||||
| − | 63 | 3.2059±1.8550 | 3.100 | 0.003 |
| + | 38 | 2.2495±1.2418 | ||
| Tumor capsular infiltration | ||||
| With complete capsule | 49 | 2.9510±1.8003 | 0.597 | 0.552 |
| No capsule or infiltration | 52 | 2.7471±1.6298 | ||
| AFP | ||||
| − | 46 | 2.6313±1.5243 | 1.444 | 0.152 |
| + | 39 | 3.1751±1.9453 | ||
| Cirrhosis | ||||
| − | 54 | 2.5633±1.5825 | 1.802 | 0.075 |
| + | 47 | 3.1709±1.8063 | ||
miR, microRNA; AFP, α-fetoprotein.
One-way analysis of variance analysis was performed.
Reverse transcription-quantitative polymerase chain reaction (RT-qPCR)
The processes of RT-qPCR were performed as described previously (12–15). Total RNA from HCC and non-cancerous liver tissues were extracted using the miRNeasy FFPE kit (Qiagen Benelux B.V., PL Venlo, The Netherlands). Reverse transcription was performed using the TaqMan MicroRNA Reverse Transcription kit (cat. no. 4366596; Applied Biosystems; Thermo Fisher Scientific, Inc., Waltham, MA, USA) and the LightCycler 480 (Roche Diagnostics GmbH, Mannheim, Germany) according to the manufacturer protocol. The following temperature protocol was applied: 16°C for 30 min, 42°C for 30 min and 85°C for 5 min. LightCycler 480 SYBR Green I Master (Roche Diagnostics GmbH) was used for qPCR, with the following thermocycling conditions: initial pre-denaturation for 5 min at 95°C, followed by 40 cycles of 95°C with 10 sec, 60°C for 10 sec and 72°C for 10 sec; evaluation of the solubility curve was performed at 95°C for 5 sec and 65°C for 1 min, which was followed by cooling at 40°C for 30 sec. Each experiment was repeated in triplicate. The primers used were provided by Thermo Fisher Scientific, Inc. and the detailed sequences are commercially confidential. A combined union of RUN6B and RUN48, which was demonstrated to be a stable internal control in our previous studies, served as the reference to the detect miR-136-5p level (16–18). The primers of RNU6B, RNU48 and miR-136-5p were contained in TaqMan MicroRNA Assays (cat. no. 4427975; Applied Biosystems; Thermo Fisher Scientific, Inc.), the sequences of each marker are as follows: miR-136-5p: ACUCCAUUUGUUUUGAUGAUGGA; RNU6B: CGCAAGGAUGACACGCAAAUUCGUGAAGCGUUCCAUAUUUUU; RNU48: GAUGACCCCAGGUAACUCUGAGUGUGUCGCUGAUGCCAUCACCGCAGCGCUCUGACC. The expression level of miR-136-5p was calculated by using formula 2−Δ∆Cq (19).
The miR-136-5p expression in HCC in The Cancer Genome Atlas (TCGA)
The TCGA database was used to further explore miR-136-5p expression in HCC tissues. In addition, miR-136-5p expression in HCC patients with various clinicopathological characteristics was analyzed. In TCGA database, the data of level three of the miRNA profile of HCC were extracted. The HCC patients, who had no neoadjuvant treatment, radiation therapy and pharmaceutical TX adjuvant treatment, were included. Meanwhile, the corresponding clinical data of HCC were obtained. Afterwards, the expression of miR-136-5p was extracted from the miRNA profile and the statistical analyses were conducted to estimate the expression of miR-136-5p in HCC tissues and non-cancerous tissues, as well as the relationships between miR-136-5p expression and various clinicopathological factors.
The miR-136-5p expression in HCC in Gene Expression Omnibus (GEO)
In GEO database, including GEO dataset and GEO profile, the authors searched miR-136-5p expression in HCC using the following key words: 1) (hepatocellular OR liver OR hepatic OR HCC), 2) malignan* OR cancer OR tumor OR tumour OR neoplas* OR carcinoma, 3) microRNA OR miRNA OR miR. The microarrays, which investigated miR-136-5p expression in HCC tissues and non-cancerous tissues, or explored miR-136-5p expression in different clinicopathological features in HCC, were included.
The meta-analysis, to combine the data of miR-136-5p expression in RT-qPCR, microarray in GEO database and RNA sequencing in TCGA database in different tissues, was performed by Stata 12.0 (StataCorp LP, College Station, TX, USA). The pooled standard mean difference (SMD) with its 95% confidence interval (95% CI) was used to assess miR-136-5p expression in different tissues. Moreover, Q test (chi-squared test) and I2 statistic were performed to estimate heterogeneity among the eligible studies. A Mantel-Haenszel fixed-effect model was performed if there was no obvious heterogeneity among the pooled studies (I2<50% and P>0.1). However, when obvious heterogeneity was identified among the include studies (I2>50% or P<0.1), random-effect model was conducted (20).
MiRNA target prediction
A total of twelve databases were involved for the target prediction of miR-136-5p, including miRWalk, Microt4, miRanda, mirbridge, miRDB, miRMap, miRNAMap, Pictar2, PITA, RNAhybrid, Targetscan and miRWalk2.0 (21). Then, the union of target genes of miR-136-5p of human reported in more than five databases and the validated genes of miR-136-5p with strong evidence were gathered for further gene functional enrichment analysis.
Natural language processing (NLP) analysis for HCC-related studies
The authors searched the PubMed database by using the keywords: 1) Hepatocellular OR liver OR hepatic OR HCC, 2) malignan* OR cancer OR tumor OR tumour OR neoplas* OR carcinoma. All related genes were extracted in the studies by biomedical named entity recognizer (ABNER, http://pages.cs.wisc.edu/~bsettles/abner/). In NLP analysis, the frequency of each gene that merged in the eligible studies in PubMed was counted. The greater the frequency indicates the higher likelihood of the correlation between a certain gene and HCC. In PubMed, the number of the relevant studies in total was marked as ‘N’. The frequency of related genes and HCC in PubMed was marked as ‘m’ and ‘n’. Moreover, the simultaneous occurrence of the disease and a certain gene was marked as ‘k’. The probability of frequency greater than ‘k’ co-citation was calculated with random conditions completely through hypergeometric distribution. It was considered the statistically significance with P<0.01. The formula of the NLP analysis was as following:
Gene functional enrichment analysis
The database of DAVID was used for GO annotation, including biological process, molecular function and cellular component (22,23). Cytoscape 3.0 software (http://www.cytoscape.org/) with BINGO plugins were responsible for graphical display of the network of GO (24). In the networks, each node represents a biological process. The bigger node means more genes participating in the biological process and the deeper color indicates the smaller P-value of the biological process. All colored nodes indicate statistical significance (P<0.05). White nodes were only used to connect the biological processes and there is no statistical significance. The protein-to-protein network analysis was conducted by STRING (25). The database of Kyoto Encyclopedia of Genes and Genomes (KEGG) was also applied to reflect the prospective biological pathways involved in the targets of miR-136-5p in HCC.
Statistical analysis
The authors performed the statistical analyses by using SPSS software (version, 22; IBM SPSS, Armonk, NY, USA). Quantitative data of miR-136-5p expression were presented as mean ± standard deviation. Student's t tests were performed for the analysis of miR-136-5p expression between two groups and when it exceeded two groups, one-way analysis of variance was employed. Additionally, the authors drew receiver operating characteristic (ROC) curve with purpose for evaluating the power of miR-136-5p in HCC diagnosis. In addition, Spearman analysis was conducted to estimate the associations between miR-136-5p and clinical factors. P<0.05 was considered to indicate a statistically significant difference.
Results
miR-136-5p expression in HCC and its clinicopathological significance detected by RT-qPCR
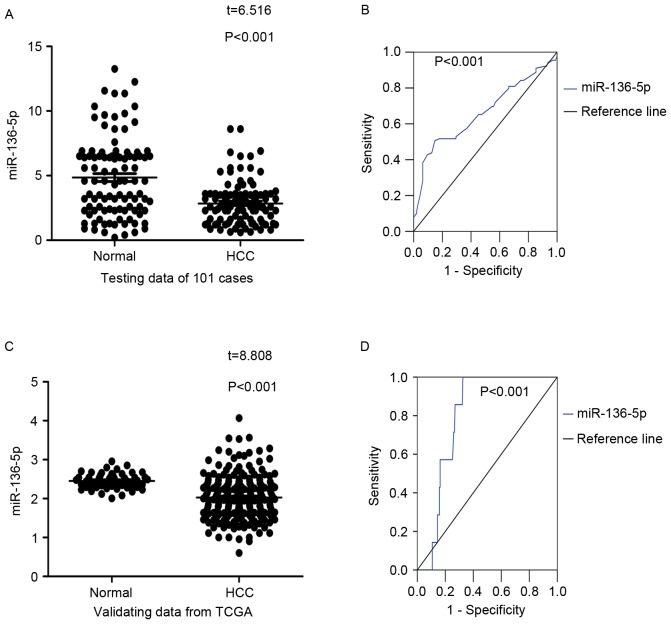
In contrast with the adjacent normal liver tissue (2.8460±1.7090), miR-136-5p was significantly underexpressed in HCC tissue (4.8507±3.0644; P<0.001; Table I; Fig. 1A). Meanwhile, in the ROC curve, an area under the curve (AUC) of 0.696 was observed (P<0.001; Fig. 1B).
Figure 1.
miR-136-5p expression in HCC tissues and adjacent non-tumor liver tissues. (A) 101 HCC tissues v. 101 adjacent non-tumor liver tissues. (B) The ROC curve of miR-136-5p to assess its diagnostic value in the 101 pairs; AUC=0.696. (C) The comparison of miR-136-5p levels in 215 HCC tissues and 50 adjacent non-tumor tissues in TCGA database. (D) The ROC curve of miR-136-5p expression in HCC performed by TCGA data; AUC=0.771. miR, microRNA; HCC, hepatocellular carcinoma; ROC, receiver operating characteristic; AUC, area under curve; TCGA, the Cancer Genome Atlas.
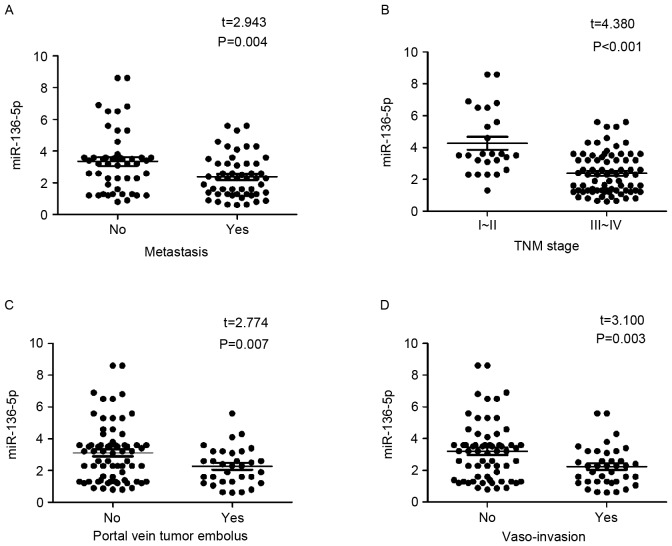
All clinicopathological factors are presented in Table I. When concerning the relationships between miR-136-5p and clinicopathological parameters in HCC, miR-136-5p expression was lower in tissues with metastasis (3.3429±1.9272) than that of HCC tissues without metastasis (2.3779±1.3307; P=0.004; Fig. 2A). Moreover, in the group of III~IV clinical TMN stage, miR-136-5p was also downregulated significantly (2.3783±1.2988), compared with the group of stage I~II (4.2680±2.0246; P<0.001; Fig. 2B). Furthermore, the HCC tissues with portal vein tumor embolus had a lower expression of miR-136-5p (2.2669±1.1827), while the ones without portal vein tumor embolus held an oppositely higher expression of miR-136-5p (3.1146±1.8511; P=0.007; Fig. 2C). Meanwhile, it witnessed a lower expression in the vaso-invasion positive group (2.2495±1.2418) compared with the negative ones (3.2059±1.8550; P=0.003; Fig. 2D). The rest of clinicopathological characteristics in HCC have no significant connections with miR-136-5p expression (Table I). In addition, Spearman analysis was used to assess the relationships between miR-136-5p and clinicopathological parameters, and it reported that negative correlations were discovered between miR-136-5p and metastasis (r=−0.284; P=0.004), TNM (r=−0.480; P<0.001), portal vein tumor embolus (r=−0.232; P=0.02), vaso-invasion (r=−0.272; P=0.006), however, the correlations were relatively low. No significant association between the rest clinicopathological factors and miR-136-5p was noted. Besides, HCC patients with lower expression of miR-136-5p (lower than the mean value) shared a trend of longer recurrence time (37.507±13.074) than the ones with higher miR-136-5p expression (30.478±14.768). However, the difference had no statistical significance, as the P-value was 0.568 (data not shown).
Figure 2.
Expression of miR-136-5p in various clinicopathological factors of hepatocellular carcinoma using the reverse transcription-quantitative polymerase chain reaction. (A) Metastasis; (B) TNM stage; (C) portal vein tumor embolus and; (D) vaso-invasion. miR, microRNA.
Validation of miR-136-5p expression in HCC in TCGA
In consistent with the results from RT-qPCR, TCGA data indicated that significantly lower miR-136-5p levels were detected in 215 HCC tissues compared to 50 cases of normal liver tissue (P<0.001; Fig. 1C) with a AUC of 0.771 (P<0.001; Fig. 1D). There was no significantly differential expression of miR-136-5p in the rest clinicopathological factors. The results regarding the associations between miR-136-5p and the clinicopathological characteristics from TCGA are presented in Table II.
Table II.
Expression of miR-136-5p and clinicopathological parameters in HCC in the Cancer Genome Atlas.
| lg(miR-136-5p) expression | ||||
|---|---|---|---|---|
| Clinicopathological features | n | Mean ± standard deviation | t | P-value |
| Tissue | ||||
| Adjacent non-cancerous liver | 50 | 2.4517±0.2036 | 8.808 | <0.0011 |
| HCC | 215 | 2.0279±0.5652 | ||
| Age | ||||
| <60 | 103 | 2.1058±0.5637 | 2.000 | 0.047 |
| ≥60 | 111 | 1.9520±0.5602 | ||
| Gender | ||||
| Male | 156 | 1.9845±0.5384 | 1.842 | 0.067 |
| Female | 59 | 2.1427±0.6209 | ||
| AJCC pathologic T | ||||
| T0 TX | 1 | 2.3263 | F=0.231a | 0.749 |
| T1 | 130 | 2.0382±0.5771 | ||
| T2-T4 | 82 | 2.0040±0.5532 | ||
| AJCC pathologic N | ||||
| N0 | 151 | 2.0358±0.5933 | 0.314 | 0.745 |
| NX | 64 | 2.0093±0.4966 | ||
| AJCC pathologic M | ||||
| M0 | 156 | 2.0428±0.6010 | F=0.355a | 0.702 |
| M1 | 1 | 1.6721 | ||
| MX | 58 | 1.9939±0.4617 | ||
| Grade | ||||
| I~II | 20 | 2.1286±0.5371 | 0.871 | 0.631 |
| III~IV | 4 | 2.2691±0.4566 | ||
| Cirrhosis | ||||
| − | 203 | 2.0335±0.5514 | 1.132 | 0.259 |
| + | 3 | 1.6682±0.8406 | ||
| Pathologic stage | ||||
| I~II | 175 | 2.0404±0.5639 | 1.576 | 0.117 |
| III~IV | 27 | 1.8546±0.6092 | ||
| Vaso-invasion | ||||
| − | 129 | 2.0159±0.5331 | 0.076 | 0.939 |
| + | 72 | 2.0223±0.6249 | ||
One-way analysis of variance analysis was performed. HCC, hepatocellular carcinoma.
Meta-analysis of miR-136-5p expression in HCC
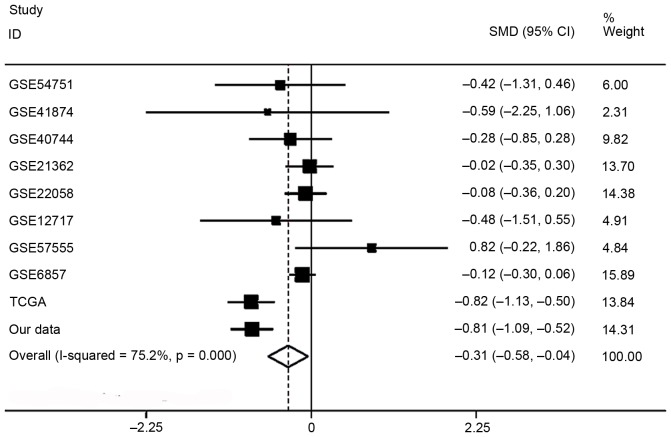
Regarding miR-136-5p expression between HCC and non-tumor liver tissue, the data of RT-qPCR of this current study, eight studies of microarrays in the GEO database (GSE54751, GSE41874, GSE40744, GSE21362, GSE22058, GSE12717, GSE57555, GSE6857) and the RNA sequencing data from TCGA, which involved 793 HCC and 614 non-tumor liver tissues, were included for this meta-analysis. The pooled SMD of miR-136-5p was −0.313 (95% CI, −0.583- (−0.044); P=0.023; Fig. 3) by the random effects model and the P value of the heterogeneity test was <0.001 (I2=75.2%).
Figure 3.
Forest of the meta-analysis for microRNA-136-5p expression in hepatocellular carcinoma in GEO database. Nine studies were included in GEO database and pooled SMD was −0.092 (95% CI: 0.221–0.036, P=0.159) with a fixed effects model. GEO, Gene Expression Omnibus; SMD, standard mean difference; CI, confidence interval.
Prediction of the target genes of miR-136-5p and GO analysis
A total of 12 databases were searched for the prediction of the potential targets of miR-136-5p. A total of 13,857 genes were identified in these databases and three genes (MTDH, BCL2 and PPP2R2A) were involved with strong evidence, as they have been confirmed by reporter assay, western blotting or qPCR. Following that, the genes reported in more than five databases combined with the gene with strong evidence were selected, and finally 1,766 genes were applied to functional enrichment, including 1,765 genes reported in more than five predicted databases and one gene reported with strong evidence (two genes in strong evidence were included in 1,765 predicted target genes). The flow chart of this prediction analysis is reported in Fig. 4.
Figure 4.
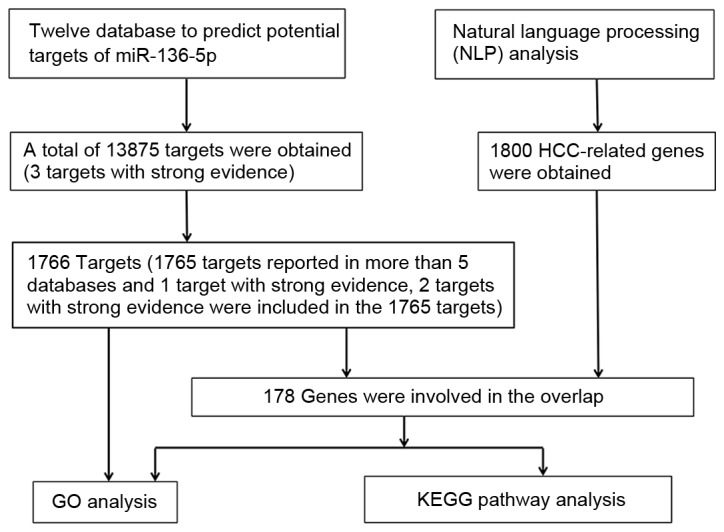
Flow chart of the prediction analysis of microR-136-5p and further enrichment analysis. Each node represents a biological process. White colored nodes were used to connect the biological processes without statistical significance.
In GO analysis in DAVID, there were 175 significant annotation information of biological process (P<0.05) and some of them were involved in transcription, positive regulation of transcription, positive regulation of RNA metabolic process, positive regulation of macromolecule biosynthetic process and so on (Table III). With regard to the cellular component of GO analysis, 63 significant terms were observed (P<0.05) and some of them correlated with insoluble fraction, membrane fraction, endomembrane system, synapse and vesicular fraction (Table III). In the molecular function of GO analysis, 66 significant terms were obtained (P<0.05) and some of them were contributed to transcription regulator activity, transcription factor activity, transcription repressor activity, protein tyrosine phosphatase activity and phosphoprotein phosphatase activity (Table III).
Table III.
The GO analysis of predicted target genes of miR-136-5p.
| GO ID | Term | Count | P-value |
|---|---|---|---|
| Biological process | |||
| 0006350 | Transcription | 269 | 1.90×10⁻⁸ |
| 0045449 | Regulation of transcription | 314 | 3.54×10⁻⁷ |
| 0045893 | Positive regulation of transcription, DNA-dependent | 79 | 7.34×10⁻⁷ |
| 0051254 | Positive regulation of RNA metabolic process | 79 | 1.03×10⁻⁶ |
| 0010557 | Positive regulation of macromolecule biosynthetic process | 98 | 3.13×10⁻⁶ |
| Cellular component | |||
| 0005626 | Insoluble fraction | 118 | 1.59×10⁻⁷ |
| 0005624 | Membrane fraction | 113 | 4.40×10⁻⁷ |
| 0012505 | Endomembrane system | 107 | 2.49×10⁻⁶ |
| 0045202 | Synapse | 58 | 4.69×10⁻⁶ |
| 0042598 | Vesicular fraction | 44 | 6.59×10⁻⁶ |
| Molecular function | |||
| 0030528 | Transcription regulator activity | 187 | 5.24×10⁻⁵ |
| 0003700 | Transcription factor activity | 129 | 5.32×10⁻⁵ |
| 0016564 | Transcription repressor activity | 51 | 1.81×10⁻⁴ |
| 0004725 | Protein tyrosine phosphatase activity | 23 | 2.33×10⁻⁴ |
| 0004721 | Phosphoprotein phosphatase activity | 30 | 7.40×10⁻⁴ |
In the GO analysis of predicted target genes of miR-136-5p in 12 databases, there were 20 available biological processes, 63 cellular components, 66 molecular functions (P<0.05). In this table, the top five terms of the GO analysis are presented. GO, Gene Ontology; miR, microRNA.
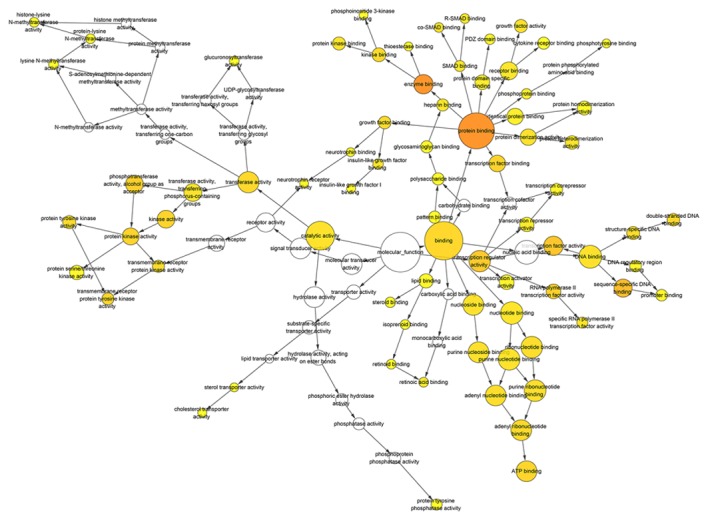
After gene functional enrichment by GO analysis in DAVID, the authors performed BINGO analysis in order to display the network of the results in GO analysis. The networks of BINGO analysis, including three parts (biological process, cellular component and molecular function), are presented in Figs. 5–7, respectively.
Figure 5.
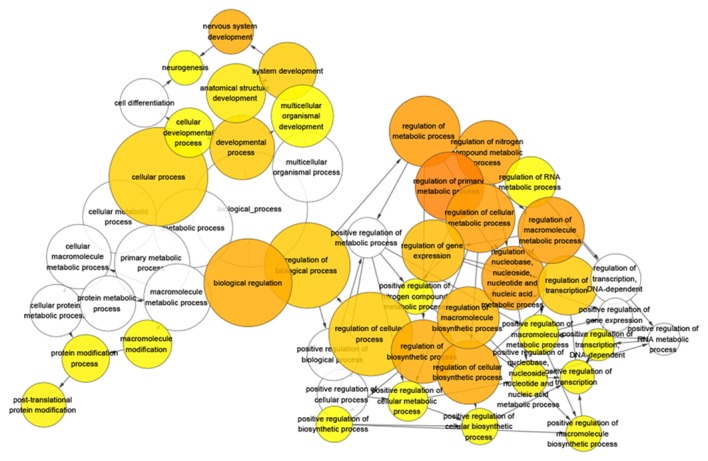
Network of predicted target genes of microRNA-136-5p of biological process. Each node represents a biological process. The bigger node means more genes participating in the process. All colored nodes indicate statistical significance (P<0.05). The deeper color indicates the smaller P-value of the biological process. White colored nodes were used to connect the biological processes without statistical significance.
Figure 7.
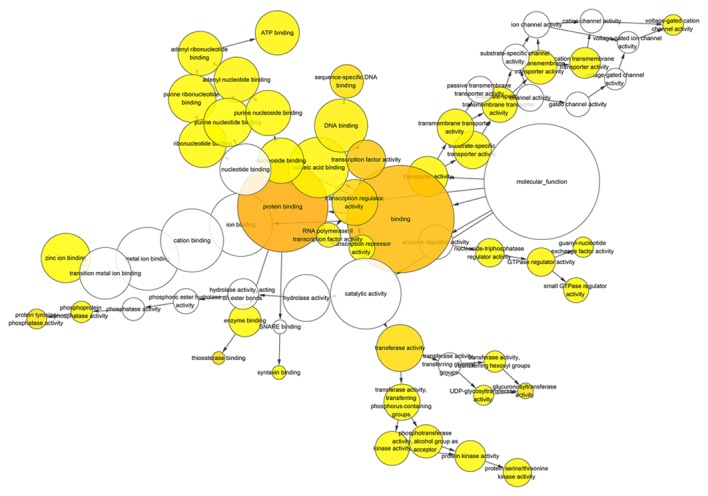
Hierarchical Network in BINGO analysis of predicted target genes of miR-136-5p of molecular function. Each node represents a biological process. The bigger node means more genes participating in the process. All colored nodes indicate statistical significance (P<0.05). The deeper color indicates the smaller P-value of the biological process. White colored nodes were used to connect the biological processes without statistical significance.
The overlap of predicted target genes of miR-136-5p and NLP analysis and its GO analysis
There were 1,800 significant HCC-related genes in NLP analysis. Following uniting the genes of the predicted targets of miR-136-5p and NLP, 178 overlapping genes were identified, which were further used for GO analysis. There were 407 significant terms in biological processes (P<0.05). Among them, response to organic substance, positive regulation of macromolecule metabolic process, enzyme linked receptor protein signaling pathway, positive regulation of cellular biosynthetic process and positive regulation of biosynthetic process were observed (Table IV). Moreover, there were 37 terms of cellular components (P<0.05) and some of them were associated with, for example, nuclear lumen, membrane-enclosed lumen, organelle lumen, membrane raft and integral to plasma membrane (Table IV). Meanwhile, there were 47 significant terms of molecular function (P<0.05) and some of them were contributed to transcription regulator activity, double-stranded DNA binding, transcription factor activity, RNA polymerase II transcription factor activity and structure-specific DNA binding (Table IV).
Table IV.
GO analysis of the overlap between predicted target genes of miR-136-5p and NLP.
| GO ID | Term | Count | P-value |
|---|---|---|---|
| Biological process | |||
| 0010033 | Response to organic substance | 34 | 3.83×10⁻¹¹ |
| 0010604 | Positive regulation of macromolecule metabolic process | 37 | 4.82Ex10−11 |
| 0007167 | Enzyme linked receptor protein signaling pathway | 23 | 1.96×10⁻¹⁰ |
| 0031328 | Positive regulation of cellular biosynthetic process | 32 | 2.20×10⁻¹⁰ |
| 0009891 | Positive regulation of biosynthetic process | 32 | 3.14×10⁻¹⁰ |
| Cellular component | |||
| 0031981 | Nuclear lumen | 35 | 1.38×10⁻⁵ |
| 0031974 | Membrane-enclosed lumen | 41 | 1.47×10⁻⁵ |
| 0043233 | Organelle lumen | 40 | 2.23×10⁻⁵ |
| 0045121 | Membrane raft | 10 | 2.86×10⁻⁵ |
| 0005887 | Integral to plasma membrane | 30 | 3.33×10⁻⁵ |
| Molecular function | |||
| 0030528 | Transcription regulator activity | 39 | 6.38×10⁻⁶ |
| 0003690 | Double-stranded DNA binding | 9 | 2.12×10⁻⁵ |
| 0003700 | Transcription factor activity | 28 | 3.55×10⁻⁵ |
| 0003702 | RNA polymerase II transcription factor activity | 13 | 3.82×10⁻⁵ |
| 0043566 | Structure-specific DNA binding | 10 | 6.26×10⁻⁵ |
In the GO analysis of the overlap between NLP and predicted target genes of miR-136-5p, there were 407 available biological processes, 37 cellular components, 49 molecular functions (P<0.05). In this table, the first five terms of the GO analysis are presented. GO, Gene Ontology; NLP, natural language processing; miR, microRNA.
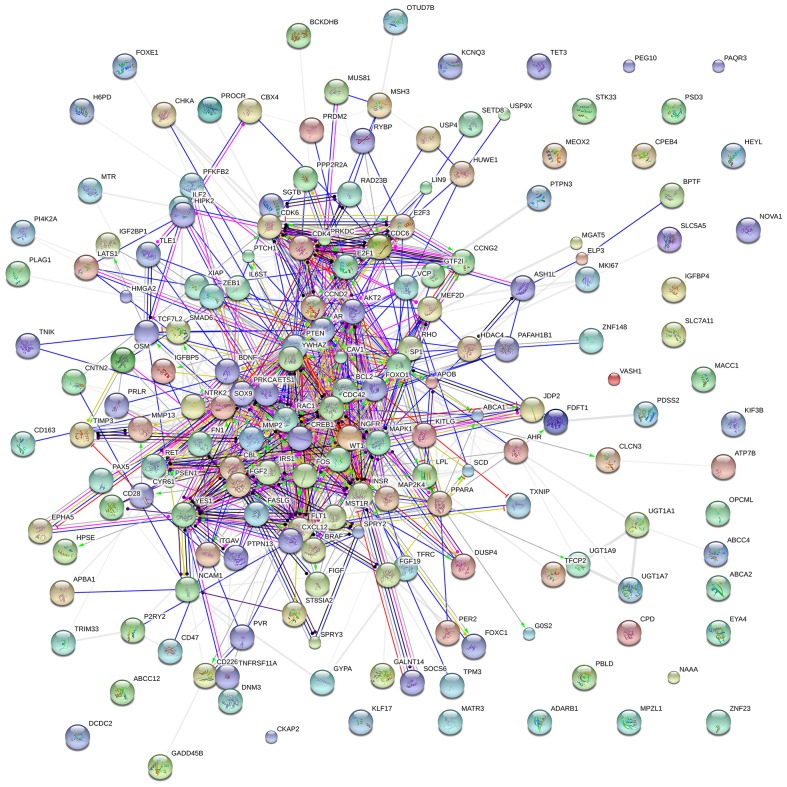
BINGO analysis of the overlapping 178 genes from predicted gene of miR-136-5p and NLP was conducted. The results of GO analysis are reported in Figs. 8–10. Furthermore, hub genes analysis was conducted by the protein-protein interaction and the results are presented in Fig. 11. In the network of the overlap, several genes demonstrated higher connectivity, including BCL2, PTEN, MMP2 and FOXO1.
Figure 8.
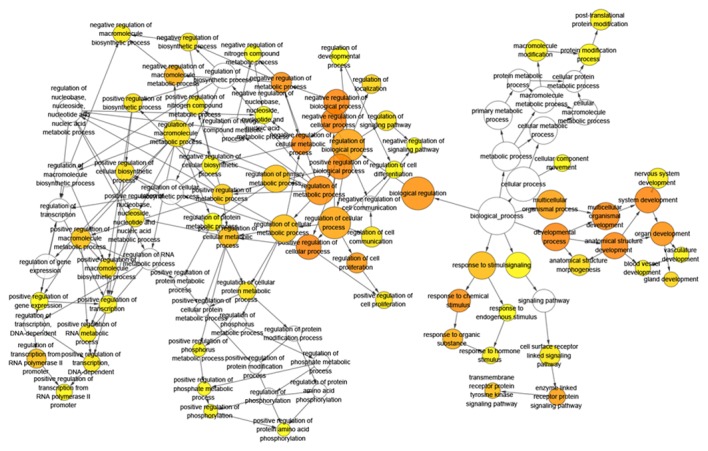
Hierarchical Network in BINGO analysis of the overlap between the predicted target genes of miR-136-5p and natural language processing analysis of biological process (GO). Each node represents a biological process. The bigger node means more genes participating in the process. All colored nodes indicate statistical significance (P<0.05). The deeper color indicates the smaller P-value of the biological process. White colored nodes were used to connect the biological processes without statistical significance.
Figure 10.
Hierarchical Network in BINGO analysis of the overlap between the predicted target genes of miR-136-5p and natural language processing analysis molecular function. Each node represents a biological process. The bigger node means more genes participating in the process. All colored nodes indicate statistical significance (P<0.05). The deeper color indicates the smaller P-value of the biological process. White colored nodes were used to connect the biological processes without statistical significance.
Figure 11.
Protein-protein interactions of the overlapping genes between the predicted target genes of miR-136-5p and NLP analysis. The protein-to-protein network analysis of the 178 overlapping genes of predicted targets of miR-136-5p and NLP analysis was performed by the STRING website. The nodes represent for proteins, and each color corresponds to a cluster. The edges indicate the predicted functional associations, which are colored by the types of predicted associations using different evidences. The red lines, green lines, blue lines, purple lines, yellow lines, light blue lines and black lines indicate fusion evidence, neighborhood evidence, co-occurrence evidence, experimental evidence, text mining evidence, database evidence and co-expression evidence, respectively. The line thickness is an indicator for the strength of the evidence. miR, microRNA; NLP, natural language processing.
Pathway analysis of the overlapping genes between predicted genes of miR-136-5p and NLP in KEGG
The overlapping 178 genes between the predicted genes and NLP were also used to pathway analysis in KEGG. There were 33 available pathways and 17 signaling pathways that were statistically significant (P<0.01, Table IV), including pathways in cancer (FGF19, E2F1, E2F3, XIAP, KITLG, FOXO1, FASLG, TCF7L2, PTEN, MMP2, TPM3, CDC42, FOS, BCL2, ITGAV, RAC1, FIGF, FGF2, AKT2, FN1, PRKCA, RET, AR, MSH3, BRAF, CBL, CDK6, CDK4, MAPK1, ETS1, PTCH1, P=1.03×10⁻¹³), the neurotrophin signaling pathway (YWHAZ, BRAF, FASLG, IRS1, MAPK1, CDC42, BDNF, PSEN1, BCL2, RAC1, NTRK2, NGFR, AKT2, P=3.19×10⁻⁶), focal adhesion (PRKCA, CDC42, MAPK1, CAV1, FLT1, BRAF, XIAP, CCND2, BCL2, ITGAV, RAC1, FIGF, PTEN, FN1, AKT2, P=2.22×10⁻⁵), the MAPK signaling pathway (PRKCA, FGF19, BRAF, MAP2K4, FASLG, CDC42, MAPK1, FOS, DUSP4, BDNF, RAC1, NTRK2, GADD45B, FGF2, AKT2, P=4.72×10⁻⁴), the cell cycle (E2F1, CDC6, E2F3, YWHAZ, CCND2, PRKDC, CDK6, CDK4, GADD45B, P=0.00246723) and the p53 signaling pathway (CCND2, CDK6, CDK4, GADD45B, CCNG2, PTEN, P=0.009198449) (Table V).
Table V.
Pathway analysis of the overlap of natural language processing analysis and predicted target genes of microRNA-136-5p.
| Title | Count | P-value | Genes |
|---|---|---|---|
| Pathways in cancer | 31 | 1.03×10⁻¹³ | FGF19, E2F1, E2F3, XIAP, KITLG, FOXO1, FASLG, TCF7L2, PTEN, MMP2, TPM3, CDC42, FOS, BCL2, ITGAV, RAC1, FIGF, FGF2, AKT2, FN1, PRKCA, RET, AR, MSH3, BRAF, CBL, CDK6, CDK4, MAPK1, ETS1, PTCH1 |
| Neurotrophin signaling pathway | 13 | 3.19×10⁻⁶ | YWHAZ, BRAF, FASLG, IRS1, MAPK1, CDC42, BDNF, PSEN1, BCL2, RAC1, NTRK2, NGFR, AKT2 |
| Prostate cancer | 11 | 5.85×10⁻⁶ | E2F1, MAPK1, E2F3, AR, BRAF, BCL2, CREB1, FOXO1, PTEN, TCF7L2, AKT2 |
| Melanoma | 10 | 6.45×10⁻⁶ | E2F1, FGF19, MAPK1, E2F3, BRAF, CDK6, CDK4, FGF2, PTEN, AKT2 |
| Pancreatic cancer | 10 | 7.26×10⁻⁶ | E2F1, CDC42, MAPK1, E2F3, BRAF, RAC1, CDK6, CDK4, FIGF, AKT2 |
| Glioma | 9 | 2.14×10⁻⁵ | PRKCA, E2F1, MAPK1, E2F3, BRAF, CDK6, CDK4, PTEN, AKT2 |
| Focal adhesion | 15 | 2.22×10⁻⁵ | PRKCA, CDC42, MAPK1, CAV1, FLT1, BRAF, XIAP, CCND2, BCL2, ITGAV, RAC1, FIGF, PTEN, FN1, AKT2 |
| Small cell lung cancer | 10 | 2.60×10⁻⁵ | E2F1, E2F3, XIAP, BCL2, ITGAV, CDK6, CDK4, PTEN, FN1, AKT2 |
| Non-small cell lung cancer | 8 | 6.29×10⁻⁵ | PRKCA, E2F1, MAPK1, E2F3, BRAF, CDK6, CDK4, AKT2 |
| Bladder cancer | 7 | 1.24×10⁻⁴ | E2F1, MAPK1, E2F3, BRAF, CDK4, FIGF, MMP2 |
| MAPK signaling pathway | 15 | 4.72×10⁻⁴ | PRKCA, FGF19, BRAF, MAP2K4, FASLG, CDC42, MAPK1, FOS, DUSP4, BDNF, RAC1, NTRK2, GADD45B, FGF2, AKT2 |
| Chronic myeloid leukemia | 5.09×10⁻⁴ | E2F1, MAPK1, E2F3, BRAF, CBL, CDK6, CDK4, AKT2 | |
| Colorectal cancer | 8 | 1.01×10⁻³ | MAPK1, FOS, MSH3, BRAF, BCL2, RAC1, TCF7L2, AKT2 |
| Renal cell carcinoma | 7 | 2.021×10⁻³ | CDC42, MAPK1, BRAF, ETS1, RAC1, FIGF, AKT2 |
| Thyroid cancer | 5 | 2.04×10⁻³ | MAPK1, RET, BRAF, TCF7L2, TPM3 |
| Cell cycle | 9 | 2.47×10⁻³ | E2F1, CDC6, E2F3, YWHAZ, CCND2, PRKDC, CDK6, CDK4, GADD45B |
| p53 signaling pathway | 6 | 9.20×10⁻³ | CCND2, CDK6, CDK4, GADD45B, CCNG2, PTEN |
The pathway analysis was performed in Kyoto Encyclopedia of Genes and Genomes database and there were 33 available pathways. Among them, 17 signaling pathways were significant (P<0.01).
Discussion
As a common cancer, HCC attracts more attention by the clinicians and researchers worldwide because of the increasing incidence and poor survival despite all the advances in diagnosis and therapeutic techniques (26). miR-136-5p is a member of the miRNAs, a family of noncoding RNA, which can regulate the target genes through blinding to 3′-untranslated regions of target mRNA, thereby inhibiting or promoting oncogenesis and progression (27). Thus, it is essential to explore and clarify the function of miR-136-5p in HCC in order to identify novel potential targets for HCC diagnosis, prognosis and treatment.
There were a few previous studies, which investigated the expression of miR-136-5p in cancers. Shen et al (10) demonstrated that miR-136 (miR-136-5p) was overexpressed in lung cancer. However, Yang et al (8) discovered that miR-136 (miR-136-5p) was downregulated in glioma. Momen-Heravi et al (28) confirmed miR-136 (miR-136-5p) was underexpressed in the patients with oral squamous cell carcinoma through the genome wide high-throughput miRNA microarray. In addition, Zhao et al (9) discovered that decreased miR-136 (miR-136-5p) expression were determined in chemo-resistant epithelial ovarian cancer. According to the aforementioned studies, miR-136-5p may be heterogeneously expressed in different cancers. By far, only one study explored miR-136-5p expression in liver biopsy samples infected with HCV but the patients did not develop into HCC (29). To the best of the authors' knowledge, there is no study investigating the miR-136-5p expression in the tissues of HCC. Therefore, it is of great significance to explore miR-136-5p expression in neoplastic tissue of HCC and analyze its clinical value.
In this present study, the authors were the first group to focus on the expression of miR-136-5p in HCC with clinical parameters. They observed strikingly reduced levels of miR-136-5p in HCC tissues compared with the normal ones by using RT-qPCR (P<0.001) and consistent results were reported in TCGA database (P<0.001), which was in accordance with the results in glioma and giant cell tumor of bone (8,30). Moreover, miR-136-5p may be a potential biomarker for HCC diagnosis, due to two AUC values of 0.696 in RT-qPCR and 0.771 in TCGA data validation (both P<0.001). Furthermore, the meta-analysis based on the microarray data from GEO, RT-qPCR and TCGA indicated a positive SMD (P=0.023). Taken together, the above results confirmed the role of miR-136-5p in the carcinogenesis of HCC and the clinical value for HCC diagnosis. However, further investigations in vivo and in vitro are needed to clarify the underlying mechanism of miR-136-5p in occurrence of HCC.
Regarding the associations between miR-136-5p expression and clinicopathological factors in HCC and the potential regulatory mechanisms of miR-136-5p in HCC, several studies have demonstrated the relative results in cancers. Mosakhani et al (30) confirmed that miR-136 (miR-136-5p) expression was decreased in metastatic giant cell tumor of bone (GCTB) compared to non-metastatic GCTB. In the glioma, decreased miR-136 (miR-136-5p) expression was associated with high malignancy (Grade III–IV) and miR-136 (miR-136-5p) can target the oncogene (E2F transcription factor 1) to enhance chemo-sensitivity to cisplatin treatment (31). As a similar trend, in epithelial ovarian cancer, insufficiency of miR-136 (miR-136-5p) can induce chemo-resistance by attenuating apoptosis and promoting rehabilitation of DNA damage induced by cisplatin (9). In lung cancer cells, there were evidences to demonstrated that increased miR-136 (miR-136-5p) contributed to mobility and invasiveness through inhibiting epithelial-mesenchymal transition via by targeting Smad2 and Smad3 (32). In vitro, Zhao et al (11) demonstrated that miR-136 (miR-136-5p) was down-regulated by hepatitis B viral X protein in HCC and decreased miR-136-5p expression can upregulate astrocyte elevated gene-1 to promote cell migration (11). Taken together, miR-136-5p may act as an anti-oncogene role in various cancers. In this current study, concerning the clinicopathological characteristics of HCC development, such as TNM stage, portal vein tumor embolus, vaso-invasion and metastasis, the authors noticed that these factors were negatively relevant to the expression of miR-136-5p. According to the consistent expression of miR-136-5p, the similar regulative mechanisms of miR-136-5p might exist in HCC and further molecular experiments in vitro and in vivo are demanded for the confirmation.
To further clarify the potential mechanisms of miR-136-5p in the carcinogenesis and progression in HCC, gene functional enrichment analysis was performed. In gene functional enrichment analysis, NLP analysis was responsible for HCC-related genes and the prediction databases embodied miR-136-5p target genes. Following the combination of the two parts, the overlapping genes may be involved in the regulative mechanisms of miR-136-5p in HCC. The results of protein-protein network of the overlap showed several hub genes of the network, including BCL2, PTEN, MMP2, FOXO1. Further experiments in vivo and in vitro are needed to confirm the relationships between miR-136-5p and the hub genes in the pathogenesis of HCC. In the GO analysis of the genes in the overlap, some target genes were correlated with positive regulation of macromolecule metabolic process, enzyme linked receptor protein signaling pathway, positive regulation of cellular biosynthetic process, transcription regulator activity, double-stranded DNA binding, transcription factor activity and structure-specific DNA binding. The relative function of the genes in the overlap mentioned above may be essential to the pathogenesis and progression of HCC (33–35). Further experiments are also necessary in order to demonstrate the function of these target genes.
In the pathway analysis, 17 significant signaling pathways of the gene in the overlap were obtained, including the MAPK and p53 signaling pathways. Among them, several dysfunctional signaling pathways have been demonstrated to contribute to the oncogenesis and progression of HCC (36–40). Further in vitro and in vivo investigation of miR-136-5p's function in those signaling pathways in HCC is necessary to confirm and illuminate the regulative mechanisms of miR-136-5p in HCC.
In conclusion, the current study is a primary research to focus on the relationships between miR-136-5p expression and HCC tissues. miR-136-5p may serve a crucial function of the pathogenesis and development in HCC as a tumor suppressor miRNA via the regulation of transcription, macromolecule metabolic process, enzyme linked receptor protein signaling pathway, and several important pathways for carcinogenesis and progression, including the MAPK and p53 signaling pathways. Further investigations are necessary to confirm the relationships between miR-136-5p and some key hub genes (BCL2, MMP2, PTEN and FOXO1) in the pathogenesis of HCC. Thus, miR-136-5p interaction may provide a novel strategy for HCC treatment.
Figure 6.
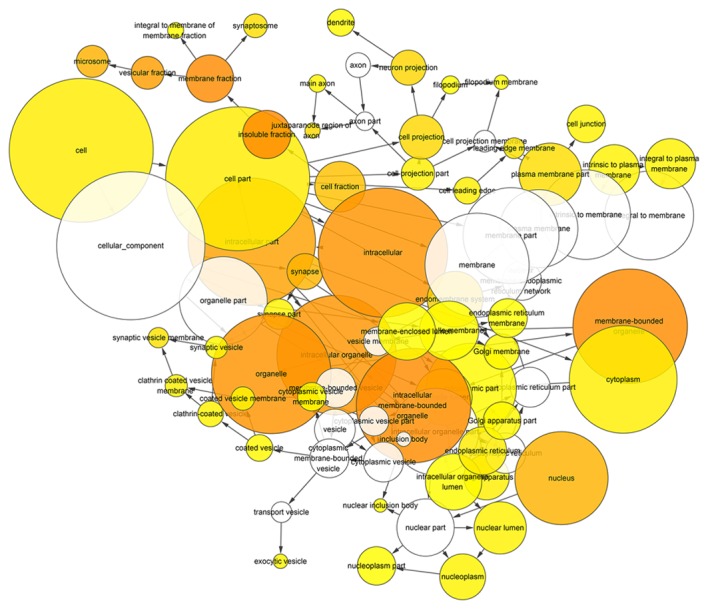
Hierarchical Network in BINGO analysis of predicted target genes of miR-136-5p of cellular component. Each node represents a biological process. The bigger node means more genes participating in the process. All colored nodes indicate statistical significance (P<0.05). The deeper color indicates the smaller P-value of the biological process. White colored nodes were used to connect the biological processes without statistical significance.
Figure 9.
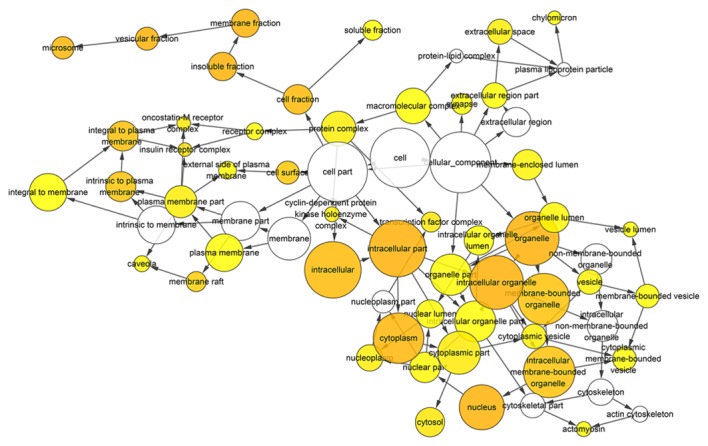
Hierarchical Network in BINGO analysis of the overlap between the predicted target genes of miR-136-5p and natural language processing analysis cellular component (GO). Each node represents a biological process. The bigger node means more genes participating in the process. All colored nodes indicate statistical significance (P<0.05). The deeper color indicates the smaller P-value of the biological process. White colored nodes were used to connect the biological processes without statistical significance.
Acknowledgements
The study was supported by the Fund of Guangxi Zhuang Autonomous Region University Student Innovative Plan (grant no. 201510958082), National Natural Science Foundation of China (grant no. 81360327) and Science Foundation of Guangxi, China (grant no. 2010GXNSFB013065). The funders had no role in study design, data collection and analysis, decision to publish, or preparation of the manuscript.
References
- 1.Yim HJ, Suh SJ, Um SH. Current management of hepatocellular carcinoma: An Eastern perspective. World J Gastroenterol. 2015;21:3826–3842. doi: 10.3748/wjg.v21.i13.3826. [DOI] [PMC free article] [PubMed] [Google Scholar]
- 2.Mlynarsky L, Menachem Y, Shibolet O. Treatment of hepatocellular carcinoma: Steps forward but still a long way to go. World J Hepatol. 2015;7:566–574. doi: 10.4254/wjh.v7.i3.566. [DOI] [PMC free article] [PubMed] [Google Scholar]
- 3.Arner P, Kulyté A. MicroRNA regulatory networks in human adipose tissue and obesity. Nat Rev Endocrinol. 2015;11:276–288. doi: 10.1038/nrendo.2015.25. [DOI] [PubMed] [Google Scholar]
- 4.Fang S, Deng Y, Gu P, Fan X. MicroRNAs regulate bone development and regeneration. Int J Mol Sci. 2015;16:8227–8253. doi: 10.3390/ijms16048227. [DOI] [PMC free article] [PubMed] [Google Scholar]
- 5.Kohlhapp FJ, Mitra AK, Lengyel E, Peter ME. MicroRNAs as mediators and communicators between cancer cells and the tumor microenvironment. Oncogene. 2015;34:5857–5868. doi: 10.1038/onc.2015.89. [DOI] [PMC free article] [PubMed] [Google Scholar]
- 6.Zhang B, Pan X, Cobb GP, Anderson TA. microRNAs as oncogenes and tumor suppressors. Dev Biol. 2007;302:1–12. doi: 10.1016/j.ydbio.2006.08.028. [DOI] [PubMed] [Google Scholar]
- 7.Mizuguchi Y, Takizawa T, Yoshida H, Uchida E. Dysregulated microRNAs in progression of hepatocellular carcinoma: A systematic review. Hepatol Res. 2016;46:391–406. doi: 10.1111/hepr.12606. [DOI] [PubMed] [Google Scholar]
- 8.Yang Y, Wu J, Guan H, Cai J, Fang L, Li J, Li M. MiR-136 promotes apoptosis of glioma cells by targeting AEG-1 and Bcl-2. FEBS Lett. 2012;586:3608–3612. doi: 10.1016/j.febslet.2012.08.003. [DOI] [PubMed] [Google Scholar]
- 9.Zhao H, Liu S, Wang G, Wu X, Ding Y, Guo G, Jiang J, Cui S. Expression of miR-136 is associated with the primary cisplatin resistance of human epithelial ovarian cancer. Oncol Rep. 2015;33:591–598. doi: 10.3892/or.2014.3640. [DOI] [PubMed] [Google Scholar]
- 10.Shen S, Yue H, Li Y, Qin J, Li K, Liu Y, Wang J. Upregulation of miR-136 in human non-small cell lung cancer cells promotes Erk1/2 activation by targeting PPP2R2A. Tumour Biol. 2014;35:631–640. doi: 10.1007/s13277-013-1087-2. [DOI] [PubMed] [Google Scholar]
- 11.Zhao J, Wang W, Huang Y, Wu J, Chen M, Cui P, Zhang W, Zhang Y. HBx elevates oncoprotein AEG-1 expression to promote cell migration by downregulating miR-375 and miR-136 in malignant hepatocytes. DNA Cell Biol. 2014;33:715–722. doi: 10.1089/dna.2014.2376. [DOI] [PubMed] [Google Scholar]
- 12.Fu Y, Qin W, Cao H, Xu R, Tan Y, Lu T, Wang H, Tong W, Rong X, Li G, et al. HCV 6a prevalence in Guangdong province had the origin from Vietnam and recent dissemination to other regions of China: Phylogeographic analyses. PLoS One. 2012;7:e28006. doi: 10.1371/journal.pone.0028006. [DOI] [PMC free article] [PubMed] [Google Scholar]
- 13.Dang Y, Luo D, Rong M, Chen G. Underexpression of miR-34a in hepatocellular carcinoma and its contribution towards enhancement of proliferating inhibitory effects of agents targeting c-MET. PLoS One. 2013;8:e61054. doi: 10.1371/journal.pone.0061054. [DOI] [PMC free article] [PubMed] [Google Scholar]
- 14.Rong M, He R, Dang Y, Chen G. Expression and clinicopathological significance of miR-146a in hepatocellular carcinoma tissues. Ups J Med Sci. 2014;119:19–24. doi: 10.3109/03009734.2013.856970. [DOI] [PMC free article] [PubMed] [Google Scholar]
- 15.Albertini MC, Olivieri F, Lazzarini R, Pilolli F, Galli F, Spada G, Accorsi A, Rippo MR, Procopio AD. Predicting microRNA modulation in human prostate cancer using a simple String IDentifier (SID1.0) J Biomed Inform. 2011;44:615–620. doi: 10.1016/j.jbi.2011.02.006. [DOI] [PubMed] [Google Scholar]
- 16.Rong M, Chen G, Dang Y. Increased miR-221 expression in hepatocellular carcinoma tissues and its role in enhancing cell growth and inhibiting apoptosis in vitro. BMC Cancer. 2013;13:21. doi: 10.1186/1471-2407-13-21. [DOI] [PMC free article] [PubMed] [Google Scholar]
- 17.Gan TQ, Tang RX, He RQ, Dang YW, Xie Y, Chen G. Upregulated MiR-1269 in hepatocellular carcinoma and its clinical significance. Int J Clin Exp Med. 2015;8:714–721. [PMC free article] [PubMed] [Google Scholar]
- 18.Liu Y, Ren F, Luo Y, Rong M, Chen G, Dang Y. Down-regulation of MiR-193a-3p dictates deterioration of HCC: A clinical real-time qRT-PCR study. Med Sci Monit. 2015;21:2352–2360. doi: 10.12659/MSM.894077. [DOI] [PMC free article] [PubMed] [Google Scholar]
- 19.Livak KJ, Schmittgen TD. Analysis of relative gene expression data using real-time quantitative PCR and the 2(−Delta Delta C(T)) method. Methods. 2001;25:402–408. doi: 10.1006/meth.2001.1262. [DOI] [PubMed] [Google Scholar]
- 20.Lau J, Ioannidis JP, Schmid CH. Quantitative synthesis in systematic reviews. Ann Intern Med. 1997;127:820–826. doi: 10.7326/0003-4819-127-9-199711010-00008. [DOI] [PubMed] [Google Scholar]
- 21.Dweep H, Gretz N. miRWalk2.0: A comprehensive atlas of microRNA-target interactions. Nat Methods. 2015;12:697. doi: 10.1038/nmeth.3485. [DOI] [PubMed] [Google Scholar]
- 22.da Huang W, Sherman BT, Lempicki RA. Systematic and integrative analysis of large gene lists using DAVID bioinformatics resources. Nat Protoc. 2009;4:44–57. doi: 10.1038/nprot.2008.211. [DOI] [PubMed] [Google Scholar]
- 23.Maere S, Heymans K, Kuiper M. BiNGO: A Cytoscape plugin to assess overrepresentation of gene ontology categories in biological networks. Bioinformatics. 2005;21:3448–3449. doi: 10.1093/bioinformatics/bti551. [DOI] [PubMed] [Google Scholar]
- 24.Shannon P, Markiel A, Ozier O, Baliga NS, Wang JT, Ramage D, Amin N, Schwikowski B, Ideker T. Cytoscape: A software environment for integrated models of biomolecular interaction networks. Genome Res. 2003;13:2498–2504. doi: 10.1101/gr.1239303. [DOI] [PMC free article] [PubMed] [Google Scholar]
- 25.Szklarczyk D, Franceschini A, Wyder S, Forslund K, Heller D, Huerta-Cepas J, Simonovic M, Roth A, Santos A, Tsafou KP, et al. STRING v10: Protein-protein interaction networks, integrated over the tree of life. Nucleic Acids Res. 2015;43:D447–D452. doi: 10.1093/nar/gku1003. (Database issue) [DOI] [PMC free article] [PubMed] [Google Scholar]
- 26.Jemal A, Bray F, Center MM, Ferlay J, Ward E, Forman D. Global cancer statistics. CA Cancer J Clin. 2011;61:69–90. doi: 10.3322/caac.20107. [DOI] [PubMed] [Google Scholar]
- 27.Mishra S, Yadav T, Rani V. Exploring miRNA based approaches in cancer diagnostics and therapeutics. Crit Rev Oncol Hematol. 2016;98:12–23. doi: 10.1016/j.critrevonc.2015.10.003. [DOI] [PubMed] [Google Scholar]
- 28.Momen-Heravi F, Trachtenberg AJ, Kuo WP, Cheng YS. Genomewide study of salivary MicroRNAs for detection of oral cancer. J Dent Res. 2014;93(7 Suppl):86S–93S. doi: 10.1177/0022034514531018. [DOI] [PMC free article] [PubMed] [Google Scholar]
- 29.Bostjancic E, Bandelj E, Luzar B, Poljak M, Glavač D. Hepatic expression of miR-122, miR-126, miR-136 and miR-181a and their correlation to histopathological and clinical characteristics of patients with hepatitis C. J Viral Hepat. 2015;22:146–157. doi: 10.1111/jvh.12266. [DOI] [PubMed] [Google Scholar]
- 30.Mosakhani N, Pazzaglia L, Benassi MS, Borze I, Quattrini I, Picci P, Knuutila S. MicroRNA expression profiles in metastatic and non-metastatic giant cell tumor of bone. Histol Histopathol. 2013;28:671–678. doi: 10.14670/HH-28.671. [DOI] [PubMed] [Google Scholar]
- 31.Chen W, Yang Y, Chen B, Lu P, Zhan L, Yu Q, Cao K, Li Q. MiR-136 targets E2F1 to reverse cisplatin chemosensitivity in glioma cells. J Neurooncol. 2014;120:43–53. doi: 10.1007/s11060-014-1535-x. [DOI] [PubMed] [Google Scholar]
- 32.Yang Y, Liu L, Cai J, Wu J, Guan H, Zhu X, Yuan J, Chen S, Li M. Targeting Smad2 and Smad3 by miR-136 suppresses metastasis-associated traits of lung adenocarcinoma cells. Oncol Res. 2013;21:345–352. doi: 10.3727/096504014X14024160459285. [DOI] [PubMed] [Google Scholar]
- 33.Waller LP, Deshpande V, Pyrsopoulos N. Hepatocellular carcinoma: A comprehensive review. World J Hepatol. 2015;7:2648–2663. doi: 10.4254/wjh.v7.i26.2648. [DOI] [PMC free article] [PubMed] [Google Scholar]
- 34.Bronte F, Bronte G, Fanale D, Caruso S, Bronte E, Bavetta MG, Fiorentino E, Rolfo C, Bazan V, Di Marco V, Russo A. HepatomiRNoma: The proposal of a new network of targets for diagnosis, prognosis and therapy in hepatocellular carcinoma. Crit Rev Oncol Hematol. 2016;97:312–321. doi: 10.1016/j.critrevonc.2015.09.007. [DOI] [PubMed] [Google Scholar]
- 35.Stotz M, Gerger A, Haybaeck J, Kiesslich T, Bullock MD, Pichler M. Molecular targeted therapies in hepatocellular carcinoma: Past, present and future. Anticancer Res. 2015;35:5737–5744. [PubMed] [Google Scholar]
- 36.You J, Yang H, Lai Y, Simon L, Au J, Burkart AL. AT-rich interactive domain 2, p110α, p53, and β-catenin protein expression in hepatocellular carcinoma and clinicopathologic implications. Hum Pathol. 2015;46:583–592. doi: 10.1016/j.humpath.2015.01.001. [DOI] [PubMed] [Google Scholar]
- 37.Huang JL, Ren TY, Cao SW, Zheng SH, Hu XM, Hu YW, Lin L, Chen J, Zheng L, Wang Q. HBx-related long non-coding RNA DBH-AS1 promotes cell proliferation and survival by activating MAPK signaling in hepatocellular carcinoma. Oncotarget. 2015;6:33791–33804. doi: 10.18632/oncotarget.5667. [DOI] [PMC free article] [PubMed] [Google Scholar]
- 38.Wu R, Duan L, Cui F, Cao J, Xiang Y, Tang Y, Zhou L. S100A9 promotes human hepatocellular carcinoma cell growth and invasion through RAGE-mediated ERK1/2 and p38 MAPK pathways. Exp Cell Res. 2015;334:228–238. doi: 10.1016/j.yexcr.2015.04.008. [DOI] [PubMed] [Google Scholar]
- 39.Delire B, Stärkel P. The Ras/MAPK pathway and hepatocarcinoma: Pathogenesis and therapeutic implications. Eur J Clin Invest. 2015;45:609–623. doi: 10.1111/eci.12441. [DOI] [PubMed] [Google Scholar]
- 40.Park NH, Chung YH, Youn KH, Song BC, Yang SH, Kim JA, Lee HC, Yu E, Lee YS, Lee SG, et al. Close correlation of p53 mutation to microvascular invasion in hepatocellular carcinoma. J Clin Gastroenterol. 2001;33:397–401. doi: 10.1097/00004836-200111000-00011. [DOI] [PubMed] [Google Scholar]


