

ABSTRACT
Purpose
Cardiorespiratory fitness (CRF) is regarded a clinical vital sign, and accurate reference values for all age groups are essential. Little data exist on CRF and cardiorespiratory function in older adults. The aim of this study was to provide normative values for CRF and cardiorespiratory function in older adults, including people with history of cardiovascular diseases (CVD).
Methods
In total, 1537 (769 women) participants age 70 to 77 yr underwent clinical examinations and cardiopulmonary exercise tests. Peak oxygen uptake (V˙O2peak), ventilation (V˙Epeak), expiration of carbon dioxide (VV˙CO2peak), breathing frequency (BFpeak), tidal volume (VTpeak), oxygen pulse (O2 pulsepeak), ventilatory efficiency (EqV˙O2peak and EqV˙CO2peak), and 1-min HR recovery were assessed.
Results
Men compared with women had higher V˙O2peak (31.3 ± 6.7 vs 26.2 ± 5.0 mL·min−1·kg−1), BFpeak (41.8 ± 8.0 vs 39.7 ± 7.1 breaths per minute), VTpeak (2.3 ± 0.5 vs 1.6 ± 0.3), O2 pulsepeak (16.4 ± 3.2 vs 11.3 ± 2.0), V˙CO2peak (2.9 ± 0.2 and 1.9 ± 0.1 L·min−1), V˙Epeak (96.2 ± 21.7 vs 61.1 ± 21.6 L·min−1), EqV˙O2peak (38.0 ± 6.9 vs 35.1 ± 5.6), and EqV˙CO2peak (33.5 ± 5.7 vs 31.9 ± 4.5). Women and men with CVD had lower V˙O2peak (14% and 19%), peak HR (5% and 6%), V˙Epeak (8% and 10%), VTpeak (7% and 4%), and lower EqV˙CO2peak (4% and 6%) compared with their healthy counterparts, respectively. Compared with healthy women and men, 1-min HR recovery was 12% and 16% lower for women and men with CVD.
Conclusions
This study represents the largest reference material on directly measured CRF and cardiorespiratory function in older men and women, with and without CVD. This novel information will help researchers and clinicians to interpret data form cardiopulmonary testing in older adults.
Key Words: CARDIORESPIRATORY FITNESS, CARDIORESPIRATORY FUNCTION, CARDIOPULMONARY EXERCISE TESTING, AGEING
Although cardiorespiratory fitness (CRF), measured as peak oxygen uptake (V˙O2peak) during cardiopulmonary exercise testing (CPET), has been shown to be the single best predictor for future cardiovascular disease (CVD) and mortality (21,24,31,42), it is often ignored in health risk assessment (20). In 2013, The American Heart Association (AHA) called for a national databank for establishing valid normative values for CRF (19), and a fitness registry (FRIEND) has now been established in the United States (20). AHA also suggests in a 2017 statement that CRF should be regarded as a clinical vital sign (35). Both the FRIEND registry committee and the AHA 2017 statement (35) highlights that being able to compare an individual’s CRF to their peers is critical for optimal risk assessment, and will provide important information for physical activity guidelines (19,20). In addition to CRF, the physiological responses during CPET can be used as a prognostic and diagnostic tool because it may identify underlying pathophysiological mechanisms for several diseases (9,15,33). For instance, it has been shown that CPET improves the diagnostic accuracy of standard ECG stress testing in identifying patients with coronary artery disease (6).
Because aging often is characterized by profound physiological changes (4,39), it is a major limitation that the existing reference values for CRF and cardiorespiratory function are based on studies that include few older adults (2,22,36,41). Further, individuals with CVD are typically excluded in studies aiming to present normative values for CRF (2,11), despite CVD being highly prevalent in older adults (30). Thus, available data on CRF and cardiorespiratory function in older adults are based on a very selected population, and valid reference data in the general elderly population is lacking. The aim of this study was to provide reference values for CRF and cardiorespiratory function in a large diverse group of elderly people.
METHODS
Participants
All men and women born between January 1, 1936, and December 31, 1942, with a permanent address in the municipality of Trondheim, Norway (n = 6966), were invited to participate in the Generation 100 Study, a randomized controlled trial with primary aim to determine the effect of 5 yr of exercise training on mortality and morbidity in elderly people (37). The exclusion criteria were: illness or disabilities that preclude exercise, uncontrolled hypertension (untreated systolic blood pressure [SBP] >220 and diastolic blood pressure [DBP] >110), symptomatic valvular disease, hypertrophic cardiomyopathy, unstable angina pectoris (chest pain at rest), primary pulmonary hypertension, heart failure, severe arrhythmia, diagnosed dementia, cancer that made participation impossible or exercise contraindicated (considered individually, in consultation with physician), chronic communicable infectious diseases, or participation in other exercise training studies. In addition, persons with CVD who fulfilled any of the following criteria during the CPET were excluded: chest pain, intermittent claudication, extreme fatigue, dizziness, blood pressure drop >10 mm Hg despite an increase in workload, SBP >250 mm Hg (>200 mm Hg for those with aortic aneurism), or DBP >110 mm Hg. In addition, the following ECG abnormalities were used as exclusion criteria: ST depression >2 mm, ST elevation >1 mm, supraventricular tachycardia (including atrial fibrillation not present in the beginning of the test), ventricular tachycardia, and increasing ventricular extra systoles. In total, 1537 (769 women) participants completed baseline examinations and provided complete data on directly measured CRF and cardiorespiratory function. The study was approved by the Regional Committee for Medical Research Ethics (REK 2012/381 B), and was registered in the ClinicalTrials.gov registry (NCT01666340). The participants gave informed, written consent to participate in the study. The baseline-data from Generation 100 are used as basis for the present study (37).
Examinations
Height
The participants stood with their feet placed against the wall, shoulder-width apart, and height (Seca 222, Hamburg, Germany) was measured to the nearest millimeter.
Waist circumference
All clothing and accessories were removed from the abdominal region. The participants stood with feet shoulder-width apart and with their arms crossed over their chest. A measuring tape was placed in a horizontal line from the uppermost border of the iliac crest around the abdomen. The participants were asked to relax and breathe normally. After the third expiration, waist circumference was measured to the nearest millimeter.
Blood
The participants arrived at the laboratory after 12-h fast, and a blood sample was obtained from an arm vein. Serum and EDTA-treated plasma were centrifuged at 3000 rpm for 10 min at 20°C. Serum triglycerides (TG), glucose, high-density lipoprotein (HDL), total cholesterol, C-reactive protein (CRP), glycosylated hemoglobin (HbA1c), and high sensitive CRP (hs-CRP) were measured immediately using standard procedures at St. Olavs University Hospital, Trondheim. The laboratory at the hospital is under Lab quality’s quality system program and quality assurances were thereby performed frequently.
Blood pressure and resting HR
After resting in a chair for 5 min, blood pressure and resting HR (HRrest) were measured automatically with a Philips IntelliVue MP50 (Philips Medizin Systeme, Boeblingen, Germany). Blood pressure was measured twice with 1-min break between in the right arm. A third measurement was taken if SBP differed ≥10 mm Hg and/or DBP differed ≥ 6 mm Hg. The mean of the last two measurements was used to report the SBP and DBP. The device was under the quality control system at St. Olavs University Hospital, Trondheim, and controls were thereby performed frequently.
Pulmonary function
Resting spirometry and single-breath determination of carbon monoxide uptake in the lung were performed with the Sensormedics Vmax22 Encore (CareFusion, San Diego, CA) in accordance with the American Thoracic Society/European Respiratory Society criteria (27,29), as previously described by Hassel et al. (17).
Steps per day
The ActiGraph GT3X+ accelerometer (ActiGraph LLC, Pensacola, FL) was used to obtain steps per day. The monitor was placed on the participants the day they came in for clinical testing, and the participants were told to wear it for 7 consecutive days (including both day and night). Data were considered valid if the subject had at least 4 d of at least 600 min·d−1 recorded.
CPET
Due to logistical reasons, two systems for ergospirometry testing were used in this study, Oxycon Pro (Erich Jaeger, Hoechberg, Germany; n = 72), and Cortex MetaMax II (Leipzig, Germany, n = 1483). Before testing, the ergospirometry systems were calibrated against a standardized motorized mechanical lung (Motorized Syringe with Metabolic Calibration Kit; VacuMed, Canada). At the start of every test, day volume and gas calibration were undertaken according to manufacturer’s instruction. Thereafter, volume calibration was performed before every test, while gas calibration was performed before every fourth test, or if ambient air measurements were rejected by the analyzer before any test. A HR monitor was used to test HR during the test (RS100, Polar Electro Oy, Kempele, Finland). Participants with heart diseases (205 men and 93 women) were tested under 12-led ECG monitoring, and the American College of Cardiology/American Heart Association-guidelines for exercise testing of patients with known CVD were followed (14). Forty-five participants performed the CPET on a bicycle because they were unable to walk on the treadmill due to reduced functionality or leg pain. After a brief customization to the treadmill, a 10-min warm-up period was performed at an individually adjusted submaximal level (moderate intensity). Workload was selected on the basis of: 1) self-reported physical activity level, 2) monitoring of the HR, and 3) feedback from the participant regarding the perceived intensity. A facemask (Hans Rudholph, Germany) connected to the gas-analyzer was then attached to the participants. Step 1 was initiated from the treadmill inclination and speed derived from the last part of the warm-up period, and was a steady state measurement that lasted for 3 min. After Step 1, the treadmill inclination was increased by 2%. Pilot tests showed that the measured parameters stabilize more quickly at Step 2, thus this steady state measurement lasted for 2 min. After submaximal work, load was increased gradually by 1 km·h−1 or 2% inclination, (or 10 W every 30 s if cycling) approximately every one and a half minute, or when oxygen uptake became stable. This procedure was maintained until exhaustion (V˙O2peak), or until maximal oxygen uptake (V˙O2max) was reached. Combined with a RER of 1.05 or higher, a maximal test was considered achieved when the participant continued until exhaustion and oxygen uptake did not increase more than 2 mL·kg−1·min−1 between two 30-s epochs (i.e., a leveling-off of V˙O2 despite increased workload). Blood pressure was obtained with an automated monitor specifically designed for stress and exercise testing (Tango+; SunTech Medical Instruments, Morrisville, NC), and measured at the two submaximal levels (step 1 and step 2), and at peak when the participants reached a RER value of 1.05. V˙O2peak was the average of the three highest consecutive values, and peak expiration of carbon dioxide (V˙CO2peak) and peak RERpeak were the highest value among the corresponding three highest values. Peak ventilation (V˙Epeak) and peak breathing frequency (BFpeak) were calculated from the average of the three ventilation values corresponding to the three highest V˙O2 values, and these two values were used to calculate peak tidal volume (VTpeak). Breathing reserve was calculated as the difference between maximum voluntary ventilation (FEV1×40) and peak ventilation, and presented as percentage of maximum voluntary ventilation (3). Peak HR (HRpeak) was recorded as the highest observed HR during the test. HR recovery (HR-recovery) was recorded 1 min after the completion of the CPET. HR reserve (HRR) was calculated as the difference between HRpeak- and HRrest. The participants reported their subjective RPE on a Borg scale ranging from 6 to 20 (7) at the two submaximal levels, and immediately after the test. Peak O2 pulse (O2 pulsepeak) was calculated by dividing V˙O2peak (mL·min−1) by HRpeak, and expressed in milliliters per beat. Peak ventilatory efficiency was calculated as EqV˙O2 (V˙Epeak/V˙O2peak) and EqV˙CO2 (V˙Epeak/V˙CO2peak).
Ventilatory anaerobic threshold and respiratory compensation point
The V-slope method (5) was used to establish ventilatory anaerobic threshold (VAT) and respiratory compensation point (RCP), and V˙O2, EqV˙O2, V˙CO2, EqV˙CO2, V˙E, BF, and RER were reported at VAT and RCP.
History of CVD and medications
A questionnaire containing 21 health-related topics was presented to the participants (37). The questionnaire addressed the participants’ education (college or university vs primary school/trade school/high school), smoking habits (current smoker vs previous), usage of antihypertensive medication (yes/no), and use of prescribed medication (number). People with a self-reported history of heart disease (myocardial infarction, angina pectoris, atrial fibrillation and/or stroke/brain hemorrhage) were classified as having CVD. Apparently healthy participants who reported not to take any prescribed medication were categorized as healthy.
Statistics
The results are presented as mean ± SD. In addition, lower (5th percentile) and upper (95th percentiles) limit of normal were reported for the CPET-data. For normally distributed variables (assessed with the Q-Q plot), independent-sample t tests were used to evaluate if there was a differences between the sexes, and between the healthy participants and those with CVD within the same sex. All included variables presented were normally distributed, except for hs-CRP, where a nonparametric test (two independent samples test) was used to evaluate the difference between sexes at baseline. Linear regression analyses were used to examine the correlation between %HRpeak, %HRR, and %V˙O2peak. The statistical analyses were performed using SPSS 22 (Predictive Analytics Software, version 20, Statistical Package for Social Science, Chicago, IL), and P <0.05 was used as the cutoff for statistical significance.
RESULTS
Descriptive data
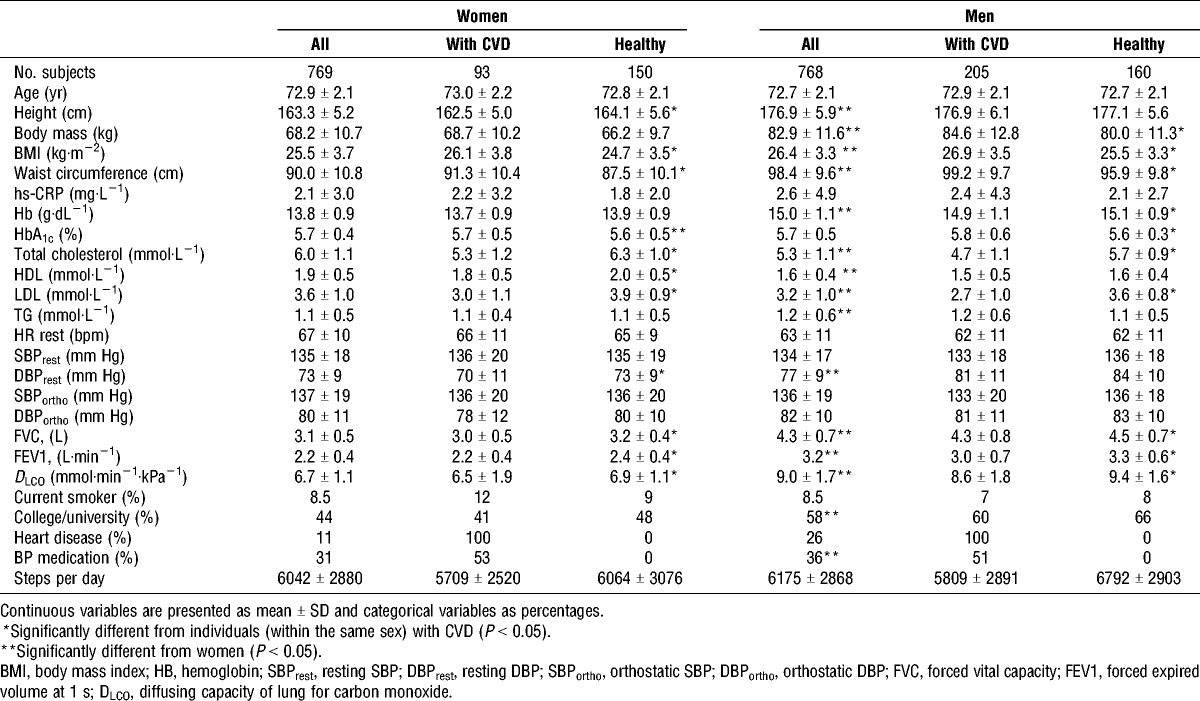
Descriptive characteristics of study participants are presented in Table 1. Men had significantly higher BMI (4%), waist circumference (9%), Hb (9%), TG (9%), DBP (5%), FVC (39%), FEV1 (45%), and DLCO (34%) compared to women, while women had higher total cholesterol (12%), HDL (16%), low-density lipoprotein (LDL) (11%), and HRrest (6%) compared to men. Men with CVD had higher BMI (5%), waist circumference (3%), and HbA1c (3%) compared the healthy men, but lower HB (1%), total cholesterol (21%), LDL (33%), FVC (5%), FEV1 (10%), and DLCO (9%). Women with CVD also had higher BMI (5%), waist circumference (4%), and HbA1c (2%), compared with the healthy women, but lower total cholesterol (19%), HDL (11%), LDL (30%), DBP (4%), FVC (7%), FEV1 (9%), and DLCO (6%). The prevalence of myocardial infarction, angina pectoris, atrial fibrillation and stroke in men were 8.5%, 4.7%, 9.0%, and 5.9%, respectively. In women, the corresponding prevalence values were 2.0%, 0.9%, 2.7%, and 3.9%. Additionally, 3.4% of the men and 1.8% of the women, reported to have other kind of heart disease.
TABLE 1.
Descriptive table of the participants.
CPET
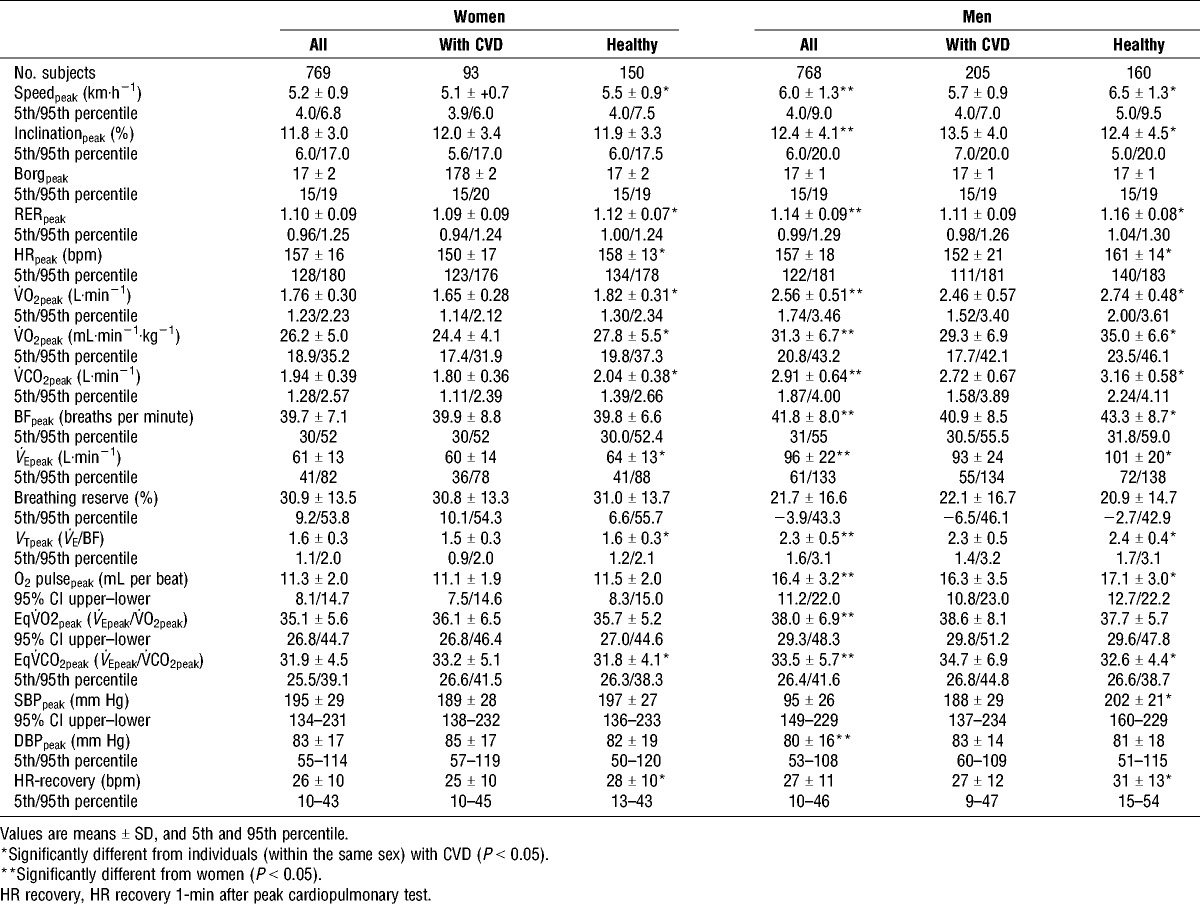
CRF values during cardiopulmonary testing (CPET) for women and men are presented in Table 2. In total, 65% of the men and 56% of the women reached V˙O2max. In women, 60% of the CVD participants and 63% of the healthy participants reached V˙O2max. Corresponding numbers for men were 65% and 72%. Men had higher V˙O2peak (20%), O2 pulsepeak (45%), V˙CO2peak (50%), BFpeak (5.3%), V˙Epeak (57%), VT (44%), and EqCO2peak (5%) compared to women. Women had 4% higher peak DBP compared with men, no sex differences were found in peak SBP. The healthy men had higher V˙O2peak (19%), V˙CO2peak (19%), BFpeak (6%), V˙Epeak (10%), VTpeak (4%), and peak O2 pulse (5%) compared with men with CVD. The healthy women had higher V˙O2peak (14%), V˙CO2peak (13%), V˙Epeak (8%), and VTpeak (7%) compared to those with CVD. There were no differences in peak DBP between the healthy and the CVD participants. However, men with CVD had significantly lower peak SBP (7%) compared to the healthy men. Men and women with CVD had a 6% and 4% higher EqV˙CO2peak, and 6% and 5% lower HRpeak compared with the healthy men and women, respectively. In addition, HR recovery was 12% lower in women and 19% lower in men with CVD compared to the healthy women and men. No clear relationship was found between the CPET variables and age in this population (data not presented).
TABLE 2.
Cardiorespiratory responses during CPET in older men and women.
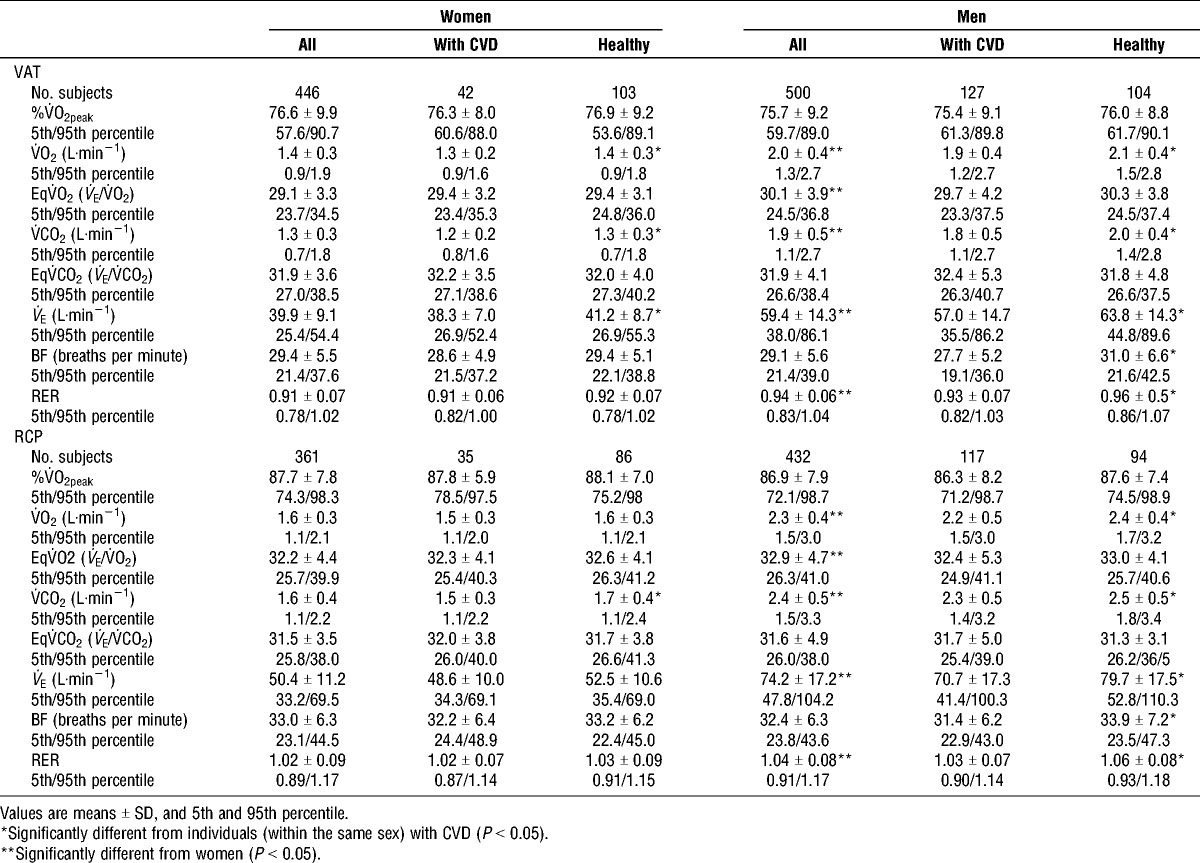
VAT and RCP
VAT was observed at approximately the same %V˙O2peak for men (75.7% ± 9.2%) and women (76.6% ± 9.9%) (Table 3). No difference was observed in the RCP between the sexes (86.9% ± 7.9% and 87.7% ± 7.8% V˙O2peak for men and women, respectively (Table 3). Both VAT and RCP were observed at a higher RER in men compared with women (P < 0.01). Men had significantly higher EqV˙O2 at VAT and RCP compared to women. VAT was observed at approximately the same %V˙O2peak for men (75.4 ± 9.1) and women (76.3 ± 8.0) with CVD compared to the healthy men (76.0 ± 8.8) and women (76.9 ± 9.2) (Table 3). Also, RCP was observed at approximately the same %V˙O2peak for men and women with CVD (86.3 ± 8.2 and 87.8 ± 5.9, respectively) and healthy men and women (87.6 ± 7.4 and 88.1 ± 7.0, respectively) (Table 3). The healthy men reached VAT and RCP at a higher RER compared to men with CVD (P < 0.01).
TABLE 3.
Respiratory variables at ventilatory anaerobic threshold (VAT) and at respiratory compensation point (RCP).
Correlation between HR and oxygen uptake
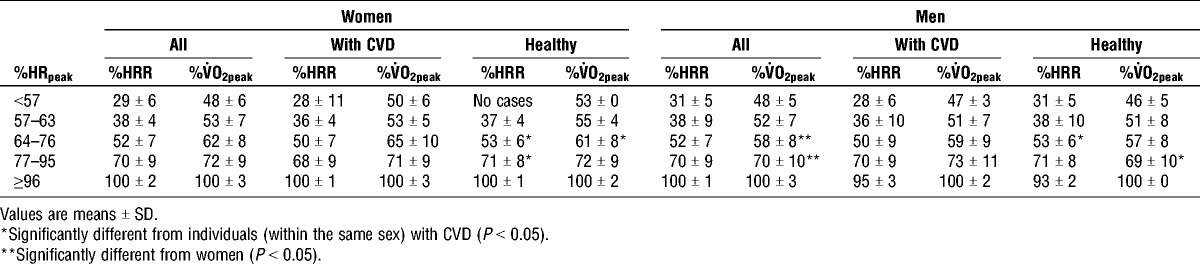
Figure 1 shows the correlation between %V˙O2peak and %HRpeak, measured during CPET in women and men. The healthy women and men had the highest correlations between %HRpeak and %V˙O2peak (R2 = 0.860 and R2 = 0.878, for women and men, respectively). The relation between %HRR and %V˙O2peak at different %HRpeak are presented in Table 4.
FIGURE 1.
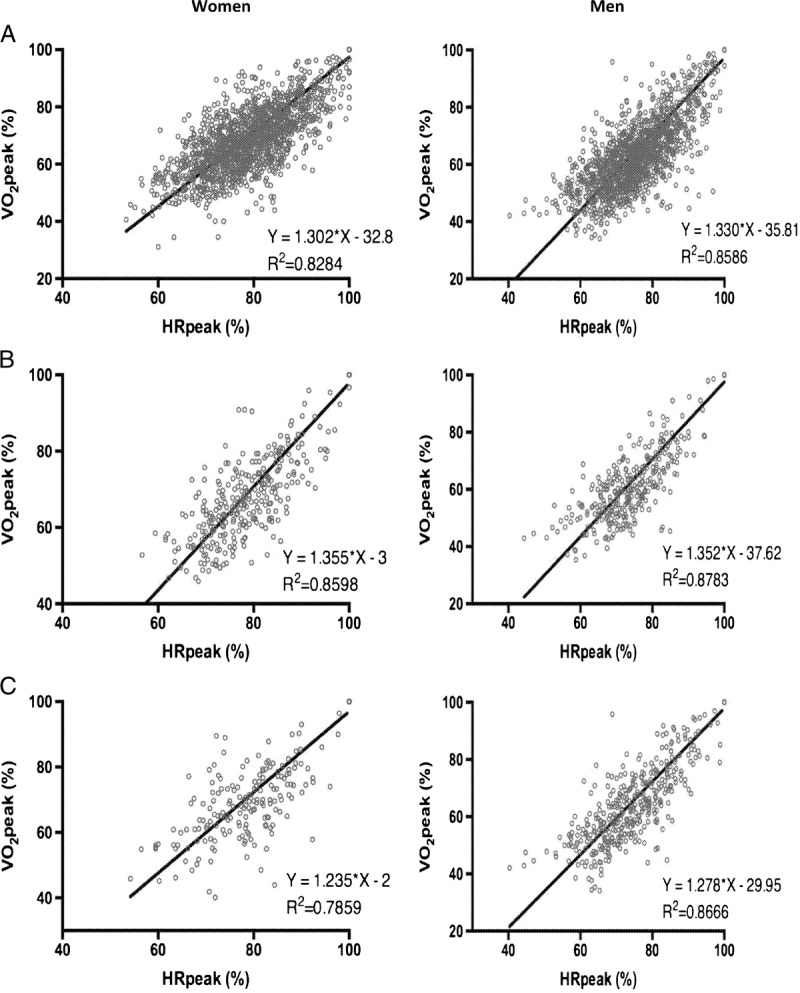
Correlation between percentage of HRpeak and percentage of peak oxygen uptake (%V˙O2peak) in women and men. A, all; B, healthy; C, with CVD.
TABLE 4.
The relationship between %HRpeak, %HRR, and %V˙O2peak for older women and men.
Rated perceived exertion using the Borg scale
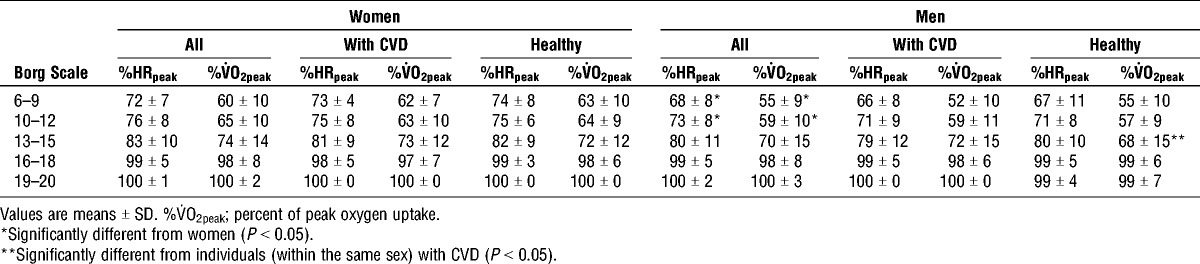
Men exercised at a lower relative intensity (both expressed as %HRpeak and %V˙O2peak) when they reported a subjective effort between 6 to 9 (P < 0.05) and 10 to 12 (P < 0.01) on the Borg scale compared with women (Table 5). No significant sex differences were observed at the higher intensities of the Borg scale (13–20). Men with CVD worked at a higher %V˙O2peak at Borg scale 13 to 15 compared with the healthy men (P < 0.05). No other differences were observed within the different Borg scale categories between the healthy men and women compared to those with CVD.
TABLE 5.
Relationship between perceived exhaustion, oxygen uptake and HR in older women and men.
DISCUSSION
CRF
The Generation 100 study currently provides the largest material for directly measured CRF and cardiorespiratory function in a general population of older adults worldwide. The CRF values reported in the present study are higher compared those previously reported in older adults in the United States by Kaminsky et al. (20). Interestingly, the registry data from the United States show that for each age group, Norwegian men and women have higher CRF than those in the United States (20). Although the number of older adults is low in the US population (137 men, and 98 women), our data reinforce the statement that region- and country-specific reference values for CRF are warranted (20). Previously, Edvardsen et al. (11) has presented reference values of CRF in Norwegian adults age 20 to 85 yr. However, people older than 50 yr were excluded if they had more than one traditional cardiovascular risk factor, and the study only included 41 women and 24 men in the oldest age group (70–85 yr). The procedure for peak oxygen uptake testing in our study is the same as that used in HUNT3 study (2). Men ≥70 yr old in HUNT3 had higher V˙O2peak (34 mL·kg−1·min−1) compared with the men in our study (31.1 mL·kg−1·min−1). The difference are likely due to a smaller (n = 269) and more selected sample size (excluded people with CVD) in HUNT3 compared with our study. The healthy men and women in our study (free from CVD) had a somewhat higher V˙O2peak compared with the HUNT3 participants. However, the healthy men and women in our study were those reporting to take no perceived medications, and are therefore most likely healthier than the participants in the HUNT3. In total, our study gives a more precise picture of CRF and cardiorespiratory function in the general population of older adults. Our study is unique, because it gives a comprehensive picture of the responses during CPET in a large number of older adults, including individuals with CVD.
Cardiorespiratory function
The results from the present study confirm that women and men with CVD respond differently physiologically during CPET compared with their healthy counterparts. In line with studies on people with heart failure (34), we observed that elderly people with CVD had lower HRpeak and HR-recovery compared to the healthy participants. In contrast with studies demonstrating that people with CVD have an impaired ability to increase their HR (chronotropic incompetence) with increased activity or physical demand (8), we observed that both men and women with CVD showed a relatively normal response, with a gradual increase in HR until peak effort during CPET. The reasons for these discrepancies are not known but may be due to different test protocols used, and reflect that the individualized test protocol (based upon the individual physiological response) used in our study may be preferable over more standard protocols (increasing workload at standardized time points) when testing CVD patients. In addition, different types of medications, age, and variety of CVD may have influenced the results, and further similar studies are warranted in older adults with CVD. The mean HR recovery in both healthy and CVD individuals were larger than the critical 12 bpm previously reported to be associated with increased risk of premature death (10). This indicates that the individuals with CVD in our population in general do not have a delayed decrease in HR after graded exercise, as often seen in people with heart failure (10,18). Clinical recommendation for CPET states that normal SBPpeak for men is approximately 210 mm Hg and for women approximately 190 mm Hg (16). The healthy women in this study had an average SBPpeak of 197 mm Hg, indicating that the normal value for SPBpeak during CPET for older women should be increased. As 37% of the healthy women had SPBpeak ≥210, we recommend that normal SBPpeak for women should be set to 210 mm Hg as for men. In our population, people with CVD had a normal rise in SBP, but men with CVD had lower SBPpeak than their healthy counterparts (SBPpeak were 188 mm Hg vs 202 mm Hg, respectively). The reason for slightly lower peak SBP in men with CVD is not known, but may have been influence by the medication use in the CVD participants, or reflect that a lower percentage reached the true V˙O2max compared with the healthy men. Previously, O2 pulse has been listed as an important variable in exercise testing because it reflects stroke volume response to exercise (16). Although it has been shown that the O2 pulse flattening duration during CPET improves the diagnostic accuracy to identify exercise-induced myocardial ischemia (6), the prognostic value of O2 pulsepeak has been questioned (23). The healthy men in our study had higher O2 pulsepeak compared with men with CVD. Interestingly, O2 pulse in men with CVD in our study was relatively high compared to previously reported in people with heart failure (43) and coronary heart disease (23), again indicating that our CVD patients were somewhat healthier than in previous studies. On the other side, previous studies are small, and it may be that our data are more representative. Several large studies are warranted to elucidate this. In line with the previous literature, our study shows that there are sex differences in pulmonary function, both at rest and during exercise (26,28). Men and women with CVD had lower pulmonary parameters at rest, but higher ventilatory cost (EqV˙CO2), compared with the healthy participants. Importantly, many of the risk factors associated with CVD (such as smoking and dyslipidemia) also affect the pulmonary system (40). Contrary to previous findings, ventilatory equivalents (EqV˙O2peak and EqV˙CO2peak) were higher in men compared with women in our study (26), indicating that there was a higher ventilatory cost for oxygen uptake and expired carbon dioxide for men. The reason for this is not known and should be examined further in future studies. It has previously been suggested that the normative value for EqV˙O2peak should be ≤40 (16). Interestingly, the EqV˙O2peak for both men and women with CVD was below this threshold in our study, indicating that the normal values for EqV˙O2peak might be lower in older adults. Traditionally, V˙E/V˙CO2 slope is calculated using all exercising data (16), and the prognostic value of EqCO2 at peak (V˙Epeak/V˙CO2peak) is not clear. However, the equation previously presented by Sun et al. (38) indicates that the V˙E/V˙CO2 at submaximal level (EqV˙CO2 at VAT) should be <30 in our population. In line with Loe et al. (26), EqV˙CO2 at VAT in our study was >30 for all groups, indicating that for older adults, the normal value for submaximal EqV˙CO2 should be higher than previously suggested (38).
VAT and RCP
As shown previously, men and women reached VAT and RCP at the same %V˙O2peak (26), and no differences were seen between the healthy people and people with CVD. However, the healthy men reached VAT and RCP at a higher RER compared with men with CVD, indicating a more effective ventilation for the healthy men.
Correlation between HR and oxygen uptake
The correlation between %HRpeak, %HRR, and %V˙O2peak in our study differs from the classification given by the American College of Sports Medicine (13). The differences are pronounced at lower intensities, where an exercise intensity at 57 to 64 of %HRpeak in our study corresponds to a higher %V˙O2peak compared with American College of Sports Medicine guidelines (13). As previously shown, men worked at a slightly lower %V˙Opeak compared with women at moderate to vigorous intensities (%HRpeak 64–95) (25). Both men and women with CVD worked at lower %V˙O2peak and higher %HRR at %HRpeak compared with their healthy counterparts, indicating that it is a greater physiological cost to work at higher intensities for people with CVD.
Rated perceived exertion using the Borg scale
Our findings support previous studies in showing that there is a sex difference related to subjectively rated effort using Borg scale and relative V˙O2peak/HRpeak at lower intensities (25,32). Both men and women in our study worked at a significantly higher %V˙O2peak and %HRpeak compared with what has been reported previously (1,7). However, our data are close to what Loe et al. found in the general Norwegian population (46.7 ± 13.1 yr).
Strength and Limitations
The main strength of our study is that it includes a large, well-described sample of men and women 70 to 77 yr of age. A major strength of this study is that all tests were performed at the same laboratory and by the same eight trained technicians, who could discuss the unexpected challenges on a daily basis. Selection bias may limit generalizability in the present study. A previously published article showed that the included participants reported somewhat better health and higher education compared with the nonparticipant group (37). However, our sample of older adults appears to be fairly representative with regard to prevalence of CVD compared with registry data of the general older adult population in Norway (12). Our sample had a wide range of health and disease status, and although potentially selection bias may have occurred, this allows for a larger degree of generalizability to older adults, at least in Norway. The existing data on key cardiorespiratory variables in people with CVD are derived from specific patient groups (myocardial infarction, heart failure, and angina) with few women included. Overall, our study provides the largest data material on cardiorespiratory responses in an older population worldwide and is the first to present normative values for a general CVD-population, including women. Maximal voluntary ventilation was estimated, and not directly measured. The negative lower limit of normal for breathing reserve in men is likely a result of maximal voluntary ventilation being estimated and that some individuals measured to low FEV1 and/or too high V˙Epeak.
CONCLUSIONS
The study represents the largest data material on directly measured CRF and cardiorespiratory function in the general population of older men and women, including people with CVD. Data from the present study will provide important information for researchers and clinicians and help them to interpret data from CPET in older adults in the future.
Acknowledgments
The authors thank the participants for taking part in the study, and the engineers at the Cardiac Exercise Research Group for excellent technical assistance. The cardiopulmonary tests were provided by NeXt Move Core Facility, Norwegian University of Science and Technology (NTNU). NeXt Move is funded by the Faculty of Medicine at NTNU and Central Norway Regional Health Authority. The authors thank the Clinical Research Facility at St. Olav Hospital for excellent assistance during the testing periods; all master and bachelor students who contributed to the collection of data.
This work was supported by the Norwegian University of Science and Technology (NTNU), Central Norway Regional Health Authority, St. Olav hospital, Trondheim, Norway, Research Council of Norway, and The K.G. Jebsen foundation for medical research, Norway.
There are no conflicts of interest. The results of the present study do not constitute endorsement by ACSM. The results of the study are presented clearly, honestly, and without fabrication, falsification, or inappropriate data manipulation.
Clinical trial: ClinicalTrial.gov NCT01666340 clinicaltrials.gov/ct2/show/NCT01666340.
REFERENCES
- 1.American College of Sports Medicine Position Stand. The recommended quantity and quality of exercise for developing and maintaining cardiorespiratory and muscular fitness, and flexibility in healthy adults. Med Sci Sports Exerc. 1998;30(6):975–91. [DOI] [PubMed] [Google Scholar]
- 2.Aspenes ST, Nilsen TI, Skaug EA, et al. Peak oxygen uptake and cardiovascular risk factors in 4631 healthy women and men. Med Sci Sports Exerc. 2011;43(8):1465–73. [DOI] [PubMed] [Google Scholar]
- 3.Balady GJ, Arena R, Sietsema K, et al. Clinician’s Guide to cardiopulmonary exercise testing in adults: a scientific statement from the American Heart Association. Circulation. 2010;122(2):191–225. [DOI] [PubMed] [Google Scholar]
- 4.Baumgartner RN, Waters DL, Gallagher D, Morley JE, Garry PJ. Predictors of skeletal muscle mass in elderly men and women. Mech Ageing Dev. 1999;107(2):123–36. [DOI] [PubMed] [Google Scholar]
- 5.Beaver WL, Wasserman K, Whipp BJ. A new method for detecting anaerobic threshold by gas exchange. J Appl Physiol (1985). 1986;60(6):2020–7. [DOI] [PubMed] [Google Scholar]
- 6.Belardinelli R, Lacalaprice F, Carle F, et al. Exercise-induced myocardial ischaemia detected by cardiopulmonary exercise testing. Eur Heart J. 2003;24(14):1304–13. [DOI] [PubMed] [Google Scholar]
- 7.Borg GA. Psychophysical bases of perceived exertion. Med Sci Sports Exerc. 1982;14(5):377–81. [PubMed] [Google Scholar]
- 8.Brubaker PH, Kitzman DW. Chronotropic incompetence: causes, consequences, and management. Circulation. 2011;123(9):1010–20. [DOI] [PMC free article] [PubMed] [Google Scholar]
- 9.Brunelli A, Belardinelli R, Refai M, et al. Peak oxygen consumption during cardiopulmonary exercise test improves risk stratification in candidates to major lung resection. Chest. 2009;135(5):1260–7. [DOI] [PubMed] [Google Scholar]
- 10.Cole CR, Blackstone EH, Pashkow FJ, Snader CE, Lauer MS. Heart-rate recovery immediately after exercise as a predictor of mortality. N Engl J Med. 1999;341(18):1351–7. [DOI] [PubMed] [Google Scholar]
- 11.Edvardsen E, Scient C, Hansen BH, Holme IM, Dyrstad SM, Anderssen SA. Reference values for cardiorespiratory response and fitness on the treadmill in a 20- to 85-year-old population. Chest. 2013;144(1):241–8. [DOI] [PubMed] [Google Scholar]
- 12.Folkehelseinstituttet. Helse hos eldre i Norge (Health in the elderly in Norway) - Folkehelserapporten 2014. Available from: https://www.fhi.no/nettpub/hin/helse-i-ulike-befolkningsgrupper/helse-hos-eldre-i-norge---folkehels/.
- 13.Garber CE, Blissmer B, Deschenes MR, et al. American College of Sports Medicine position stand. Quantity and quality of exercise for developing and maintaining cardiorespiratory, musculoskeletal, and neuromotor fitness in apparently healthy adults: guidance for prescribing exercise. Med Sci Sports Exerc. 2011;43(7):1334–59. [DOI] [PubMed] [Google Scholar]
- 14.Gibbons RJ, Balady GJ, Beasley JW, et al. ACC/AHA Guidelines for Exercise Testing. A report of the American College of Cardiology/American Heart Association Task Force on Practice Guidelines (Committee on Exercise Testing). J Am Coll Cardiol. 1997;30(1):260–311. [DOI] [PubMed] [Google Scholar]
- 15.Gitt AK, Wasserman K, Kilkowski C, et al. Exercise anaerobic threshold and ventilatory efficiency identify heart failure patients for high risk of early death. Circulation. 2002;106(24):3079–84. [DOI] [PubMed] [Google Scholar]
- 16.Guazzi M, Adams V, Conraads V, et al. EACPR/AHA Scientific Statement. Clinical recommendations for cardiopulmonary exercise testing data assessment in specific patient populations. Circulation. 2012;126(18):2261–74. [DOI] [PMC free article] [PubMed] [Google Scholar]
- 17.Hassel E, Stensvold D, Halvorsen T, Wisløff U, Langhammer A, Steinshamn S. Association between pulmonary function and peak oxygen uptake in elderly: the Generation 100 study. Respir Res. 2015;16:156. [DOI] [PMC free article] [PubMed] [Google Scholar]
- 18.Imai K, Sato H, Hori M, et al. Vagally mediated heart rate recovery after exercise is accelerated in athletes but blunted in patients with chronic heart failure. J Am Coll Cardiol. 1994;24(6):1529–35. [DOI] [PubMed] [Google Scholar]
- 19.Kaminsky LA, Arena R, Beckie TM, et al. The importance of cardiorespiratory fitness in the United States: the need for a national registry: a policy statement from the American Heart Association. Circulation. 2013;127(5):652–62. [DOI] [PubMed] [Google Scholar]
- 20.Kaminsky LA, Arena R, Myers J. Reference Standards for Cardiorespiratory Fitness Measured With Cardiopulmonary Exercise Testing: Data From the Fitness Registry and the Importance of Exercise National Database. Mayo Clin Proc. 2015;90(11):1515–23. [DOI] [PMC free article] [PubMed] [Google Scholar]
- 21.Lakka TA, Laaksonen DE, Lakka HM, et al. Sedentary lifestyle, poor cardiorespiratory fitness, and the metabolic syndrome. Med Sci Sports Exerc. 2003;35(8):1279–86. [DOI] [PubMed] [Google Scholar]
- 22.Langhammer A, Johnsen R, Gulsvik A, Holmen TL, Bjermer L. Forced spirometry reference values for Norwegian adults: the Bronchial Obstruction in Nord-Trøndelag Study. Eur Respir J. 2001;18(5):770–9. [DOI] [PubMed] [Google Scholar]
- 23.Laukkanen JA, Kurl S, Salonen JT, Lakka TA, Rauramaa R. Peak oxygen pulse during exercise as a predictor for coronary heart disease and all cause death. Heart. 2006;92(9):1219–24. [DOI] [PMC free article] [PubMed] [Google Scholar]
- 24.Lee DC, Sui X, Ortega FB, et al. Comparisons of leisure-time physical activity and cardiorespiratory fitness as predictors of all-cause mortality in men and women. Br J Sports Med. 2011;45(6):504–10. [DOI] [PubMed] [Google Scholar]
- 25.Loe H, Rognmo Ø, Saltin B, Wisløff U. Aerobic capacity reference data in 3816 healthy men and women 20–90 years. PLoS One. 2013;8(5):e64319. [DOI] [PMC free article] [PubMed] [Google Scholar]
- 26.Loe H, Steinshamn S, Wisløff U. Cardio-respiratory reference data in 4631 healthy men and women 20–90 years: the HUNT 3 fitness study. PLoS One. 2014;9(11):e113884. [DOI] [PMC free article] [PubMed] [Google Scholar]
- 27.Macintyre N, Crapo RO, Viegi G, et al. Standardisation of the single-breath determination of carbon monoxide uptake in the lung. Eur Respir J. 2005;26(4):720–35. [DOI] [PubMed] [Google Scholar]
- 28.McClaran SR, Harms CA, Pegelow DF, Dempsey JA. Smaller lungs in women affect exercise hyperpnea. J Appl Physiol (1985). 1998;84(6):1872–81. [DOI] [PubMed] [Google Scholar]
- 29.Miller MR, Hankinson J, Brusasco V, et al. Standardisation of spirometry. Eur Respir J. 2005;26(2):319–38. [DOI] [PubMed] [Google Scholar]
- 30.Mozaffarian D, Benjamin EJ, Go AS, et al. Heart disease and stroke statistics—2015 update: a report from the American Heart Association. Circulation. 2015;131(4):e29–322. [DOI] [PubMed] [Google Scholar]
- 31.Myers J, Prakash M, Froelicher V, Do D, Partington S, Atwood JE. Exercise capacity and mortality among men referred for exercise testing. N Engl J Med. 2002;346(11):793–801. [DOI] [PubMed] [Google Scholar]
- 32.Nes BM, Janszky I, Aspenes ST, Bertheussen GF, Vatten LJ, Wisloff U. Exercise patterns and peak oxygen uptake in a healthy population: the HUNT study. Med Sci Sports Exerc. 2012;44(10):1881–9. [DOI] [PubMed] [Google Scholar]
- 33.Older P, Smith R, Courtney P, Hone R. Preoperative evaluation of cardiac failure and ischemia in elderly patients by cardiopulmonary exercise testing. Chest. 1993;104(3):701–4. [DOI] [PubMed] [Google Scholar]
- 34.Phan TT, Shivu GN, Abozguia K, et al. Impaired heart rate recovery and chronotropic incompetence in patients with heart failure with preserved ejection fraction. Circ Heart Fail. 2010;3(1):29–34. [DOI] [PubMed] [Google Scholar]
- 35.Ross R, Blair SN, Arena R, et al. Importance of assessing cardiorespiratory fitness in clinical practice: a case for fitness as a clinical vital sign a scientifc statement from the American Heart Association. Cirulation. 2016. [Epub ahead of print]. doi: 10.1161/CIR.0000000000000461. [DOI] [PubMed] [Google Scholar]
- 36.Sassen B, Cornelissen VA, Kiers H, Wittink H, Kok G, Vanhees L. Physical fitness matters more than physical activity in controlling cardiovascular disease risk factors. Eur J Cardiovasc Prev Rehabil. 2009;16(6):677–83. [DOI] [PubMed] [Google Scholar]
- 37.Stensvold D, Viken H, Rognmo Ø, et al. A randomised controlled study of the long-term effects of exercise training on mortality in elderly people: study protocol for the Generation 100 study. BMJ Open. 2015;5(2):e007519. [DOI] [PMC free article] [PubMed] [Google Scholar]
- 38.Sun XG, Hansen JE, Garatachea N, Storer TW, Wasserman K. Ventilatory efficiency during exercise in healthy subjects. Am J Respir Crit Care Med. 2002;166(11):1443–8. [DOI] [PubMed] [Google Scholar]
- 39.Taylor BJ, Johnson BD. The pulmonary circulation and exercise responses in the elderly. Semin Respir Crit Care Med. 2010;31(5):528–38. [DOI] [PMC free article] [PubMed] [Google Scholar]
- 40.Van Eeden S, Leipsic J, Paul Man SF, Sin DD. The relationship between lung inflammation and cardiovascular disease. Am J Respir Crit Care Med. 2012;186(1):11–6. [DOI] [PubMed] [Google Scholar]
- 41.Vogel JA, Patton JF, Mello RP, Daniels WL. An analysis of aerobic capacity in a large United States population. J Appl Physiol (1985). 1986;60(2):494–500. [DOI] [PubMed] [Google Scholar]
- 42.Williams PT. Physical fitness and activity as separate heart disease risk factors: a meta-analysis. Med Sci Sports Exerc. 2001;33(5):754–61. [DOI] [PMC free article] [PubMed] [Google Scholar]
- 43.Wisloff U, Stoylen A, Loennechen JP, et al. Superior cardiovascular effect of aerobic interval training versus moderate continuous training in heart failure patients: a randomized study. Circulation. 2007;115(24):3086–94. [DOI] [PubMed] [Google Scholar]