

Abstract
Background and Purpose
Thyroid hormones induce several changes in whole body metabolism that are known to improve metabolic homeostasis. However, adverse side effects have prevented its use in the clinic. In view of the promising effects of thyroid hormones, we investigated the effects of levothyroxine supplementation on glucose homeostasis.
Experimental Approach
C57BL/6 mice were treated with levothyroxine from birth to 24 weeks of age, when mice were killed. The effects of levothyroxine supplementation on metabolic health were determined. C57BL/6 mice treated with levothyroxine for 2 weeks and then challenged with streptozotocin to monitor survival. Mechanistic experiments were conducted in the pancreas, liver and skeletal muscle. RIP‐B7.1 mice were treated with levothyroxine for 2 weeks and were subsequently immunized to trigger experimental autoimmune diabetes (EAD). Metabolic tests were performed. Mice were killed and metabolic tissues were extracted for immunohistological analyses.
Key Results
Long‐term levothyroxine supplementation enhanced glucose clearance and reduced circulating glucose in C57BL/6 mice. Levothyroxine increased simultaneously the proliferation and apoptosis of pancreatic beta cells, promoting the maintenance of a highly insulin‐expressing beta cell population. Levothyroxine increased circulating insulin levels, inducing sustained activation of IRS1‐AKT signalling in insulin‐target tissues. Levothyroxine‐treated C57BL/6 mice challenged with streptozotocin exhibited extended survival. Levothyroxine blunted the onset of EAD in RIP‐B7.1 mice by inducing beta cell proliferation and preservation of insulin‐expressing cells.
Conclusions and Implications
Interventions based on the use of thyroid hormones or thyromimetics could be explored to provide therapeutic benefit in patients with type 1 diabetes mellitus.
Abbreviations
- BAT
brown adipose tissue
- EAD
experimental autoimmune diabetes
- GK
glucokinase
- GSIS
glucose‐stimulated insulin secretion
- GSK3β
glycogen synthase kinase 3β
- IPPTT
intraperitoneal pyruvate tolerance test
- ITT
insulin tolerance test
- STZ
streptozotocin
- T1DM
type 1 diabetes mellitus
- T2DM
type 2 diabetes mellitus
- T3
triiodothyronine
- T4
levothyroxine
- TR
thyroid hormone receptors
- THs
thyroid hormones
- WAT
white adipose tissue
- α‐GSU
α‐glycoprotein subunit
Introduction
Glycaemic control is exquisitely orchestrated by the hormones secreted by the islets of Langerhans, which exert effects on many target tissues. In the pathogenesis of type 2 diabetes mellitus (T2DM), insulin‐target tissues gradually develop insulin resistance. As a result of compromised insulin sensitivity, there is an increased demand of insulin production to maintain circulating glucose concentration within the physiological range. Under these circumstances, pancreatic beta cells overproduce insulin, which in late stages of the disease results in overstimulation of beta cells and their apoptosis. In type 1 diabetes mellitus (T1DM), as opposed to T2DM, there is a direct and specific attack of immune cells that selectively destroys pancreatic beta cells. In both T1DM and T2DM, the lack of a functional beta cell mass produces hyperglycaemia, propelling a vicious cycle of metabolic disorders.
The use of thyroid hormones (THs) and newly generated thyromimetics is promising to improve metabolic homeostasis given their potent effect on weight loss and the reduction of cholesterol levels (de Lange et al., 2011; Lin and Sun, 2011; Moreno et al., 2011). Triiodothyronine (T3) and levothyroxine (T4), produced in the thyroid gland, are the main THs. T4 is converted into T3 within cells by deiodinases. Interestingly, T4 is less active but more stable (190 h) than T3. The average activity of T3 is about three to five times higher than T4, but the stability is 19 h in euthyroid patients. Other THs or thyromimetics, such as triac, tetrac, thyrinnamines, reverse T3, 3,5‐diiodo‐l‐thyronin and conjugated glucagon/T3, also exist and are recently attracting attention in the scientific community as promising drugs for the treatment of several pathologies (Ball et al., 1997; Shang et al., 2013; Goglia, 2014; Senese et al., 2014; Finan et al., 2016). One of the main physiological roles of THs is the regulation of basal metabolic rate, defined here as the rate of energy expenditure per time at rest, which accounts for about 60–75% of the calories burned in a healthy subject. Specifically, THs increase oxygen consumption and rates of ATP hydrolysis, while lowering coupled state of the mitochondria and the maximal capacity to produce ATP (Johannsen et al., 2012). Actually, THs are known to induce the catabolism of all types of energy sources (Weinstein et al., 1991). THs induce the reduction of circulating triglycerides and cholesterol containing lipoproteins, as well as the induction of hepatic gluconeogenesis and glycogenolysis (Bahn et al., 2011). Enhanced gluconeogenesis and glycogenolysis support tissues with sufficient fuel to maintain their energy requirements (Dimitriadis and Raptis, 2001; Klieverik et al., 2008).
The mechanistic insights of THs action in cells involve the modulation of gene expression in a process mediated by their binding to TH receptors (TR). TH‐TR complexes bound to specific DNA sequences modulate the expression of more than 80 genes (Dong et al., 2009; Shoemaker et al., 2012). In this context, essential cellular processes are orchestrated by THs, such as mitochondrial biogenesis in the nervous system and the contractile apparatus of the endoplasmic reticulum in the heart (Iwen et al., 2013; Vargas‐Uricoechea et al., 2014). Additionally, non‐genomic effects of TH have also been described (e.g. activation of Akt signalling, through the TR‐β) (Verga Falzacappa et al., 2009; Vicinanza et al., 2013). Moreover, THs play a significant role in the differentiation of the vast majority of somatic cells (Obregon, 2008; Sirakov et al., 2013). Interestingly, during the last years, extensive research has focused on the role of TH in the differentiation, maturation and functionality of metabolic tissues (Mastracci and Evans‐Molina, 2014). Thus, T3 supplementation enhanced postnatal pancreatic islet development, via the induction of the transcription factor MAFA, and attenuated hyperglycaemia in streptozotocin (STZ)‐treated and leptin‐receptor deficient mice (Lin and Sun, 2011; Verga Falzacappa et al., 2011; Aguayo‐Mazzucato et al., 2013). In addition, T3 administration increased the expression of endocrine markers in acinar and ductal cell lines as well as in pancreatic explants (Misiti et al., 2005; Aiello et al., 2014). Remarkably, newly developed in vitro protocols aiming to differentiate human embryonic stem cells towards insulin‐secreting beta cells use T3 in specific steps of the differentiation protocol (Pagliuca et al., 2014; Rezania et al., 2014). These data indicate that THs are involved in the differentiation and the maturation of pancreatic precursor cells into functional endocrine cells.
In this report, we set out to investigate whether a long‐term supplementation with T4 enhanced glucose clearance in healthy and in STZ‐challenged C57BL/6 wild‐type mice, as well as improving metabolic homeostasis in the RIP‐B7.1 mouse strain, which provides a model of experimental autoimmune diabetes (EAD). We found that T4 improved metabolic control in these murine models via the induction of the proliferation of pancreatic beta cells, as well as the production of insulin, which was associated with higher circulating insulin levels and the subsequent activation of the IRS1‐Akt axis of insulin signalling in target tissues for insulin.
Methods
Animals
All animal care and experimental procedures complied with national and European Union legislation (Spanish RD 53/2013 and EU Directive 2010/63) for the protection of animals used for scientific purposes. The CABIMER animal facility is an SPF‐certified facility. Animal studies are reported in compliance with the ARRIVE guidelines (Kilkenny et al., 2010; McGrath and Lilley, 2015).
Mice were housed in individually ventilated cages (Tecniplast, Buguggiate, Italy). Souralit plus 29/12 bedding (Souralit, Gerona, Spain) was sterilized by autoclave and added to each cage. Mice were group‐housed (one to four mice per cage), maintained on a 12 h light/dark cycle and had access to rodent chow TD2914 (Envigo, Barcelona, Spain) and water ad libitum.
For experiments in C57BL/6 mice, the offspring of five pairs of mice were used (Janvier, Le Genest‐Saint‐Isle, France). C57BL/6 mice are considered an optimal model to study glucose homeostasis. Female mice were treated or not with T4 starting at birth (s.c. injection of 18 ng·g−1 of body weight daily until weaning). After weaning, mice were supplemented with T4 in drinking water (50 μg·mL−1) (Spencer and West, 1961; Weinstein et al., 1991; Weinstein et al., 1994; Wistuba et al., 2007; Dong et al., 2010; Mysliwiec et al., 2011; Buras et al., 2014). Five untreated and six T4‐treated animals per group were injected with insulin (0.75 U·kg−1 of body weight) before killing. At 24 weeks of age, animals were fasted for 16 h and killed by cervical dislocation.
For experiments related to EAD, transgenic RIP‐B7.1 mice were used (Harlan et al., 1994; Mellado‐Gil et al., 2016); these mice were supplied by Dr Bernhard. O. Boehm (Ulm University Medical Centre, Ulm, Germany). RIP‐B7.1 mice are a well‐established model of EAD. T4 supplementation (5 μg·mL−1 of T4 in the drinking water) was started at 6 weeks of age. EAD was triggered by intramuscular immunization at 8 weeks of age with 50 μg of pC1/ppins plasmid DNA (1 μg·μL−1) containing the preproinsulin II. At 11 weeks of age, animals were killed by cervical dislocation. For experiments related to chemically induced diabetes mellitus, STZ was used following a previously published protocol (Verga Falzacappa et al., 2011). Briefly, Thirty‐four‐week‐old male C57BL/6 mice were treated with T4 (5 μg·mL−1 of T4 in the drinking water). At 2 weeks of T4 treatment, experimental diabetes mellitus was triggered by two injections (one each day for two consecutive days) of STZ (i.p., 150 mg·kg−1), freshly dissolved in 10 mM Na‐citrate buffer (pH 4.5). Mice were killed if circulating glucose levels were above 5 g·L−1 for more than 96 h.
Blinding, group size and randomization
The data analyst was blinded, whereas the operator was not blind to the group assignment of animals. Mice were selected from the pool eligible for inclusion in the study and were randomly divided into the experimental groups (n = 26 untreated mice and n = 28 T4‐treated mice for C57BL/6 mice; n = 8 for the untreated group and n = 9 for the T4‐terated group for RIP‐B7.1 mice; n = 9 for the untreated group and n = 9 for the T4‐treated group for STZ‐treated C57BL/6 mice). The number of biological replicates was similar (n untreated = n ± 1 T4‐treated) in the different experiments, experimental loss leading to greater differences in the number of biological replicates within the different experimental groups occurred in the experiments shown in Figures 1L, 2A, B, D, E and 5B and Supporting Information Figure S5B. Quantitative analysis of gene and protein expression was normalized to the mean of the control group to facilitate representation and understanding of the results. Quantitative‐PCR data were adjusted by using a reference gene (β‐actin). The experiments shown in Supporting Information Figure S1B–E were normalized to glucose levels at time 0 (%) to determine whether differences in metabolic test stem from differences in basal glucose levels (Curtis et al., 2015). Measured glucose values are shown in Figure 1A, E, G, I.
Figure 1.
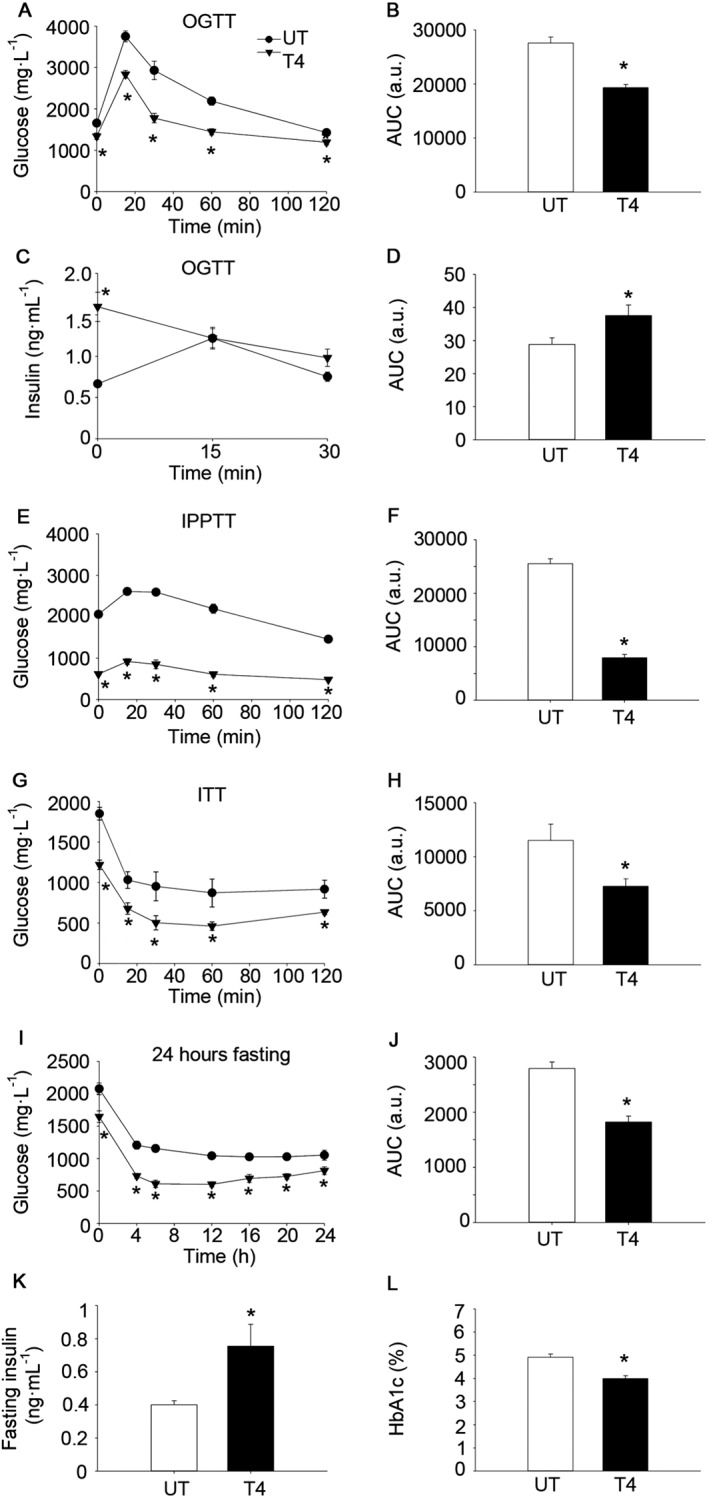
T4 enhances glucose clearance in wild‐type C57BL/6 mice. (A) Glucose concentration in blood after oral glucose load (OGTT). Age = 10 weeks. n = 13 per group. (B) AUC of glucose levels during the OGTT. (C) Plasma levels of insulin after oral glucose load (OGTT). Age = 9 weeks. n = 7 untreated; n = 8 T4‐treated. (D) AUC of insulin levels during OGTT curve. (E) Glucose concentration in blood after intraperitoneal pyruvate load (IPPTT). Age = 8 weeks. n = 7 untreated; n = 8 T4‐treated. (F) AUC of glucose levels during the IPPTT. (G) Glucose concentration in blood after i.p. insulin injection (ITT). Age = 11 weeks. n = 12 untreated; n = 13 T4‐treated. (H) AUC of glucose levels during the ITT. (I) Glucose concentration in blood during a 24 h fasting period. Age = 12 weeks. n = 7 untreated; n = 8 T4‐treated. (J) AUC of glucose levels during the 24 h fasting period. (K) Sixteen‐hour fasting circulating insulin levels. Age = 12 weeks. n = 7 untreated; n = 8 T4‐treated. (L) Percentage of glycated haemoglobin (HbA1c) in blood. Age = 23 weeks. n = 9 untreated; n = 14 T4‐treated. UT, untreated; T4, T4‐treated. Data shown are the means ± SEM. *P < 0.05, significantly different from untreated mice; two tailed Student's t‐test.
Figure 2.
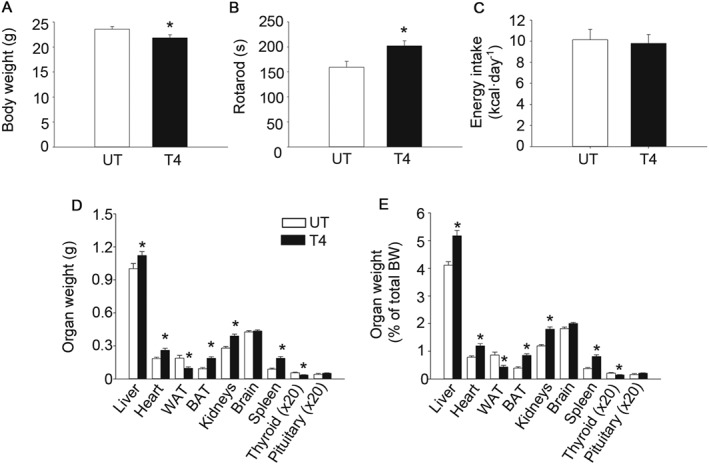
T4 reduces body weight and increases rotarod performance. (A) Body weight. Age = 24 weeks. n = 12 untreated; n = 18 T4‐treated. (B) Time to fall from an accelerating rotarod. Age = 21 weeks. n = 12 untreated; n = 18 T4‐treated. (C) Energy intake. Age = 8 weeks. n = 7 untreated; n = 8 T4‐treated. (D) Organs weight. Age = 24 weeks. For liver, heart, WAT, BAT, kidney, brain and spleen n = 12 untreated; n = 18 T4‐treated. For thyroid and pituitary n = 6 untreated; n = 7 T4‐treated. (E) Organs weight divided by body weight. Age = 24 weeks. For liver, heart, WAT, BAT, kidney, brain and spleen n = 12 untreated; n = 18 T4‐treated. For thyroid and pituitary n = 6 untreated; n = 7. UT, untreated; T4, T4‐treated. Data shown are the means ± SEM. *P < 0.05, significantly different from untreated mice; two tailed Student's t‐test.
Immunohistochemistry
Dissected tissues were fixed in 4% paraformaldehyde. Pancreatic sections (7 μm thick) were deparaffinized and rehydrated. Antigen retrieval was performed in 0.01 M sodium citrate buffer (pH 6). After 1 h blocking at room temperature, sections were incubated overnight at 4°C with primary antibodies (Supporting Information Table S1). Subsequently, slides were incubated with secondary antibodies (Supporting Information Table S1) for 1 h at room temperature. For immunofluorescence, DAPI‐nuclear staining (Life Technologies,Carlsbad, USA) was used. For diaminobenzidine staining, biotinylated secondary antibodies were used (VectorLab, Burlingame, VT, USA). Counterstaining with haematoxylin (Panreac, Barcelona, Spain) was performed. Insulin staining was quantified using Image J as mean value/pixel after background subtraction. Thyroid and pituitary sections were stained with haematoxylin and eosin (Panreac).
Semi‐quantitative RT–PCR
Total RNA was extracted from frozen skeletal muscle and liver samples using the Easy‐blue RNA extraction kit (Intron Biotechnology, Gyeonggi‐doQiagen, Korea). For islet experiments, the RNeasy Micro Kit was used (Qiagen). CDNA was synthesized using the Superscript II (Invitrogen, Carlsbad, CA, USA). The RT‐PCR was performed on individual cDNAs using SYBR green (Roche). Primer sequences are presented in Supporting Information Table S2. The mRNA expression was calculated by the 2−ΔΔCT method and normalized to the expression of β‐actin.
Western blot
Samples were lysed in radioimmunoprecipitation assay buffer (20 mM Tris–HCl (pH 7.5), 150 mM NaCl, 1 mM Na2EDTA, 1 mM EGTA, 1% NP‐40, 1% sodium deoxycholate) with protease, phosphatase and deacetylase inhibitors P0044, P5725, P8340 and SC‐362323. Western blots were performed according to standard methods, which involved incubation with a primary antibody of interest, followed by incubation with a horseradish peroxidase‐conjugated secondary antibody (Supporting Information Table S1). Blots were quantified with ImageJ, and the bands of interest were normalized to Ponceau S and/or GAPDH staining, as previously validated (Bello et al., 2003).
In vivo insulin and glucose determinations
To determine glucose levels, blood samples were taken by venepuncture using a Precision Xceed glucometer (Abbott, Madrid, Spain) (Martin‐Montalvo et al., 2013). Insulin was measured in plasma using elisa kits (Crystal Chem, Downers Grove, IL, USA). For the oral glucose tolerance test (OGTT), mice were fasted from 6 h at 10 a.m. and received an oral dose of glucose (3 g·kg−1) by gavage. For the intraperitoneal pyruvate tolerance test (IPPTT), mice were fasted for 6 h from 10 a.m. and received aninjection of sodium pyruvate (i.p., 2 g·kg−1) by gavage. For the insulin tolerance test (ITT), mice were fasted for 3 h from 10 a.m. and were injected with insulin (0.75 IU·kg−1, i.p). For glucose determination during a 24 h fasting period, mice were fasted from 8 p.m.
Rotarod
Results from rotarod tests are presented as the time to fall from an accelerating rotarod as previously described (4–40 rpm over 5 min) (Mitchell et al., 2014). Mice were given a 1 min habituation trial at 4 rpm on the day before the experiment. Results shown are the averages of three trials per mouse.
Islet isolation, culture and glucose‐stimulated insulin secretion (GSIS)
Islets from 24‐week‐old female wild‐type C57BL/6 mice were isolated by intraductal collagenase perfusion as previously described (Jimenez‐Moreno et al., 2015). For semi‐quantitative RT‐PCR purposes, pancreatic islets were processed upon collection. For insulin determination, similar amounts of islet equivalents (10 in each technical replicate) were lysed in HCl‐ethanol (5% HCl in 96° ethanol) for 16 h at 4°C. For GSIS studies, islets were cultured overnight in RPMI‐1640 medium (2 g·L−1 glucose). Then, groups of 10 islets were washed in 500 μL of Krebs‐Ringer bicarbonate‐HEPES buffer (KRBH) (140 mM NaCl, 3.6 mM KCl, 0.5 mM NaH2PO4, 0.5 mM MgSO4, 1.5 mM CaCl2, 2 mM NaHCO3, 10 mM HEPES, 0.1% BSA). Subsequently, fresh KRBH supplemented with 2.8 mM glucose was added, and islets were incubated for 30 min. Next, buffer was harvested (“2.8 mM insulin secretion”), and 500 μL of KRBH supplemented with 22 mM glucose was added. Islets were incubated for an additional 30 min at 37°C, and then, buffer was harvested (“22 mM insulin secretion”). Following the incubations, islets were lysed with HCl‐ethanol to obtain the insulin content. In all cases, insulin was measured using elisa kits (Crystal Chem).
T4 determination
T4 concentration in serum was determined using a T4 commercial kit (MP Biomedicals, Santa Ana,CA, USA).
Homeostasis model assessment of insulin resistance (HOMA‐IR)
Insulin resistance was estimated using the HOMA2 Calculator available from the Oxford website (Levy et al., 1998).
Glycated haemoglobin
HbA1c levels were determined in blood samples according to the manufacturer's protocol (CrystalChem).
α‐glycoprotein subunit (α‐GSU) determination
The α‐GSU of pituitary hormones was determined using a commercially available kit following the instructions of the manufacturer (Abbexa, Cambridge, United Kingdom).
TUNEL assay
For the TUNEL staining, the In Situ Cell Death Detection Kit, Fluorescein, was used using proteinase K (Sigma‐Aldrich, St. Louis, MO, USA).
Data and statistical analysis
The data and statistical analysis in this study comply with the recommendations on experimental design and analysis in pharmacology (Curtis et al., 2015). Data are shown as means ± SEM. Statistical significance was calculated using unpaired, two‐tailed Student's t‐test as two experimental groups (untreated and T4‐treated) were compared (Excel 2007, Microsoft). The Mann–Whitney rank sum test was applied when data were normalized to basal glucose levels (SigmaPlot 12.5, Softonic, Barcelona, Spain). A LogRank statistical test was applied for survival curves (SigmaPlot 12.5, Softonic). For all analyses, P < 0.05 was considered statistically significant.
Materials
T4, glucose, sodium pyruvate, STZ and the enzyme inhibitors P0044, P5725 and P8340 were purchased from Sigma‐Aldrich. SC‐362323 was supplied by Santa Cruz Biotechnology (Santa Cruz, CA, USA). Unless otherwise stated, other reagents were purchased from Sigma‐Aldrich.
Nomenclature of targets and ligands
Key protein targets and ligands in this article are hyperlinked to corresponding entries in http://www.guidetopharmacology.org, the common portal for data from the IUPHAR/BPS Guide to PHARMACOLOGY (Southan et al., 2016), and are permanently archived in the Concise Guide to PHARMACOLOGY 2015/16 (Alexander et al., 2015a, b).
Results
T4 supplementation enhances glucose clearance in healthy C57BL/6 mice
In order to determine the metabolic effects of T4 supplementation in mice, we treated female wild‐type C57BL/6 mice with T4 from postnatal day 1 (18 ng·g−1 of body weight·day−1; s.c. injections) until weaning, followed by T4 administration in the drinking water (50 μg·mL−1 ad libitum) until 24 weeks of age, when mice were killed (Spencer and West, 1961; Weinstein et al., 1991; Weinstein et al., 1994; Wistuba et al., 2007; Dong et al., 2010; Mysliwiec et al., 2011; Buras et al., 2014). Analysis of serum samples indicated that T4 concentration was increased in T4‐treated mice (Supporting Information Figure S1A).
Glucose tolerance was enhanced by T4 supplementation as determined by the lower AUC in an OGTT, even when glucose levels were expressed as the percentage of basal glucose (Figure 1A–B and Supporting Information Figure S1B). Remarkably, basal circulating insulin levels were higher in T4‐treated mice in the OGTT, while levels were similar to those of untreated animals at 15–30 min post‐glucose load (Figure 1C–D). Glucose levels were also lower at all time points during an IPPTT, indicating that hepatic gluconeogenesis, although significant (e.g. significant increase in glucose levels promoted by pyruvate administration), was not able to normalize glucose levels in T4‐treated mice (Figure 1E–F and Supporting Information Figure S1C). In order to determine whether insulin sensitivity was affected, animals were challenged with an ITT. Circulating glucose levels were significantly lower in T4‐treated mice at any time point during the ITT, although these differences were related to the lower basal glucose levels, as shown by the lack of significant differences when glucose levels were expressed as the percentage of basal glucose (Figure 1G–H and Supporting Information Figure S1D). We next measured circulating glucose levels during a 24 h fasting period. Glucose levels were significantly reduced in T4‐treated mice at any time point during the experiment (Figure 1I–J and Supporting Information Figure S1E). Consistent with the high insulin levels determined during the basal time of the OGTT (6 h fasting), circulating insulin levels were also higher at 16 h of fasting (Figure 1K). Interestingly, despite the lower glucose levels during the ITT, a trend towards increased HOMA‐IR was found in T4‐treated mice (P = 0.08 in two‐tailed Student's t‐test) (Supporting Information Figure S1F). Supporting the long‐term reduction of glucose levels in mice treated with T4, the percentage of glycated haemoglobin was lower (note that the untreated group is within the healthy physiological range; ~5%) (Figure 1L). Taken together, these results indicate that T4 supplementation markedly reduced the glucose concentration in blood, which was associated with increased circulating insulin.
We next assessed the effects of T4 supplementation on whole body physiology. Body weight was slightly reduced in T4‐treated mice (Figure 2A). Rotarod performance was improved by T4, indicating the overall healthy status of the animals (Figure 2B). Interestingly, energy intake was similar in both experimental groups, even when corrected for changes in body weight (Figure 2C and Supporting Information Figure S2A). Noticeably, at killing, gonadal white adipose tissue (WAT) and thyroid weights were reduced in T4‐treated mice (Figure 2D–E). In contrast, several organs, including the brown adipose tissue (BAT), were heavier in T4‐treated mice, even when corrected for body weight (Figure 2D–E). Histological examinations of the thyroid and the pituitary revealed no major macroscopic changes in tissue morphology (Supporting Information Figure S2B). Thyroid sections of T4‐treated mice had a slightly less intense staining of the colloid in the lumen of the follicle, suggestive of reduced endogenous thyroglobulin content. In addition, serum concentration of the α‐GSU of pituitary hormones was concomitantly reduced in T4‐treated mice (Supporting Information Figure S2C).
T4 supplementation enhances beta cell turnover and increases beta cell insulin content
T4‐mediated increases in circulating insulin levels implied effects of the hormone on pancreatic islets. Accordingly, insulin staining was greater while glucagon was unaffected, in pancreatic sections of T4‐treated mice, compared with control mice (Figure 3A–C). Increased insulin content in the islets of T4‐treated mice was confirmed by elisa determination using freshly isolated pancreatic islets (Figure 3D). Determinations of mRNA expression by real‐time PCR in pancreatic islets from T4‐treated and untreated mice indicated that Akt and glucokinase (GK) expression were also significantly increased in the islets of T4‐treated mice, whereas no changes were observed in MAFA and FOXO1 gene expression (Supporting Information Figure S3A). Immunohistochemical analysis confirmed that GK expression was increased, while the subcellular localization of FOXO1 and MAFA remained unaffected in T4‐treated mice (Figure 3A, E and Supporting Information Figure S3B–C) (Kikuchi et al., 2012; Aguayo‐Mazzucato et al., 2013). Remarkably, GSIS assays performed in islets isolated from T4‐treated mice showed that insulin secretion was increased, when islets were cultured under low glucose (2.8 mM) conditions (Figure 3F). However, differences in insulin secretion under high glucose (22 mM) conditions did not reach statistical significance. Interestingly, beta cell proliferation, defined here as the percentage of Ki67 positive cells within the insulin‐expressing cell population, was increased in T4‐treated animals, compared with that in untreated mice (Figure 3G–I). As opposed to beta cells, non‐insulin‐expressing pancreatic endocrine cells showed similar proliferation (percentage of Ki67 positive cells in islet residing non‐insulin expressing cells) (Figure 3G, I). Remarkably, the percentage of apoptotic cells, determined by TUNEL staining, was also increased by T4 administration, specifically in the beta cell population (Figure 3J–L).
Figure 3.
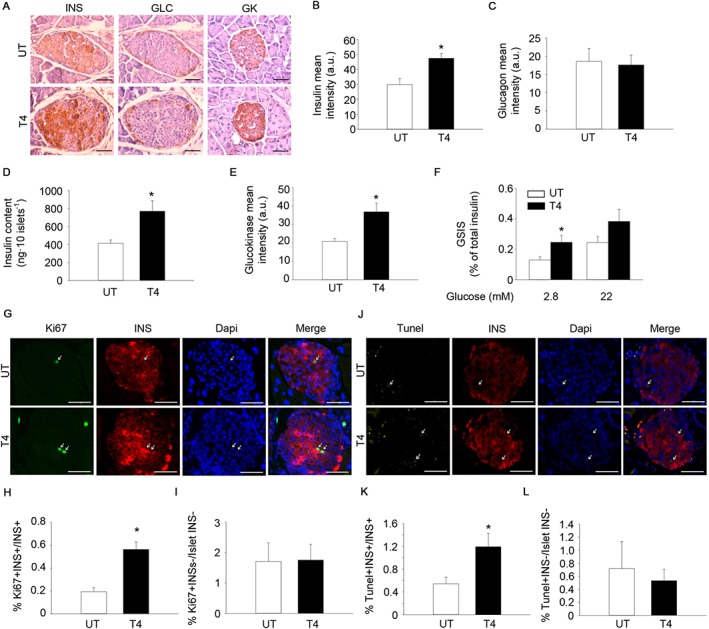
T4 increases insulin expression and enhances the proliferation of pancreatic beta cells. (A) Representative images of insulin (INS), glucagon (GLC) and glucokinase (GK) staining in pancreas from mice treated or not with T4. Diaminobenzidine staining followed by haematoxylin counterstaining. Scale bar = 50 μm. INS; n = 5 per group. GLC; n = 5 per group. GK; n = 6 per group. (B) Quantification of insulin staining (mean intensity). (C) Quantification of glucagon staining (mean intensity). (D) Determination of pancreatic islet insulin content by elisa. n = 6 untreated, n = 7 T4‐treated. (E) Quantification of glucokinase staining (mean intensity). (F) Determination of GSIS. n = 6 untreated, n = 7 T4‐treated. (G) Representative images of Ki67 and insulin staining in pancreases from mice treated or not with T4. Immunofluorescence followed by DAPI staining. Scale bar, 50 μm. n = 5 per group. (H) Percentage of Ki67+‐Insulin+ cells over total insulin+ cells. (I) Percentage of Ki67+‐Insulin− cells over total insulin− cells residing in pancreatic islets. (J) Representative images of TUNEL and insulin staining in pancreas from mice treated or not with T4. Immunofluorescence followed by DAPI staining. Scale bar = 50 μm. n = 5 per group. (K) Percentage of TUNEL+‐Insulin+ cells over total insulin+ cells. (L) Percentage of TUNEL+‐Insulin− cells over total insulin− cells residing in pancreatic islets. UT, untreated; T4, T4‐treated. Arrows indicate representative positive staining. Data shown are the means ± SEM. *P < 0.05 significantly different from untreated mice; two tailed Student's t‐test.
T4 induces the activation of IRS1‐Akt signalling in insulin‐target tissues
In order to determine the underlying mechanism of T4 action in insulin‐target tissues, we measured mRNA expression by semi‐quantitative real‐time PCR. We found that the transcript levels of several members of the insulin signalling pathway were over‐expressed in skeletal muscle and in the liver of T4‐treated mice (Figure 4A–B). Consistent with these data, protein extracts of both T4‐treated liver and skeletal muscle, exhibited increased levels of total Akt, FOXO1 and glycogen synthase kinase 3β (GSK3‐β) (Figure 4C–E). Moreover, the phosphorylated isoforms of several members of the insulin signalling such as pTyr632‐IRS1, pSer473‐Akt and pSer256‐FOXO1 were significantly increased in both, skeletal muscle and liver lysates isolated from T4‐treated mice (Figure 4C–E). Remarkably, ERK phosphorylation at Thr202/Tyr204 in skeletal muscle was reduced in T4‐treated samples, indicating the specificity of the effect of T4 supplementation in the IRS1‐Akt branch of insulin signalling. In order to determine whether T4 supplementation could also increase the maximal activation of the IRS1‐AKT axis of insulin signalling, a cohort of mice was treated with insulin (0.75 UI·kg−1 of body weight) 15 min before killing (Figure 4F–H and Supporting Information Figure S4A). No differences on insulin‐stimulated phosphorylation of Ser473‐Akt levels were found, indicating that maximal insulin‐induced Akt activation was not affected by T4‐treatment. T4 treatment also modulated the expression of genes involved in glucose utilization (e.g. increased glycolysis and gluconeogenesis) and mitochondrial uncoupling, in both skeletal muscle and liver (Supporting Information Figure S4B–C). Taken together, these results suggest that high circulating levels of insulin, induced by T4, lead to sustained activation of IRS1‐Akt signalling and subsequently increased glucose uptake in insulin target tissues, to maintain their high metabolic requirements. Supporting these data, a significant increase of pThr172‐ AMPK, which indicates a starvation‐like status, was found in extracts isolated from T4‐treated skeletal muscles (Supporting Information Figure S4D–E). Noteworthy, such a change was not detected in liver samples, suggesting that energy metabolism is preferentially affected in tissues with higher metabolic demands (Supporting Information Figure S4D, F).
Figure 4.
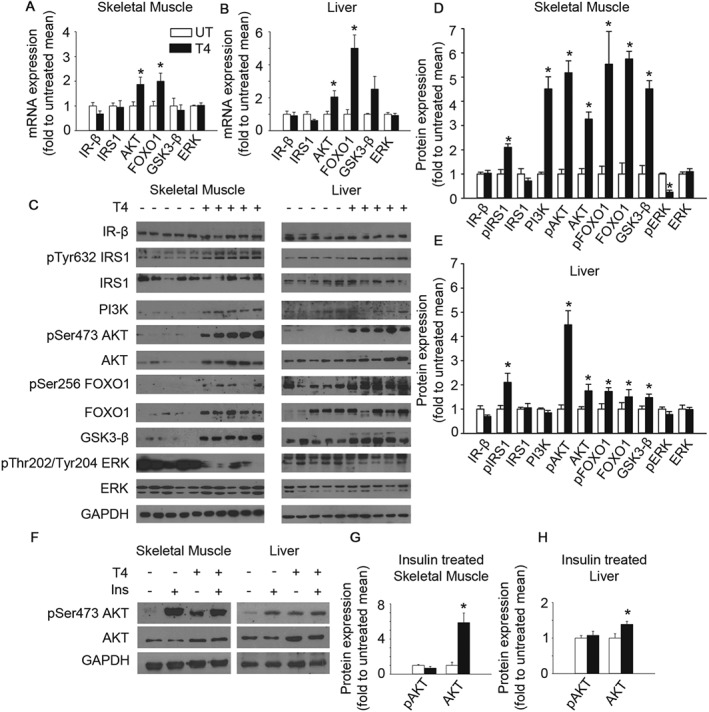
T4 activates insulin signalling in skeletal muscle and liver. (A) Determination of mRNA levels of several members of the insulin pathway in the skeletal muscle of mice treated or not with T4. Mice were fasted for 16 h before they were killed. Values were normalized to untreated mice. IR‐β; n = 5. IRS1; n = 6. Akt; n = 5. FOXO1; n = 6. GSK3‐β; n = 6. ERK; n = 6. (B) Determination of mRNA levels of several members of the insulin pathway in the liver of mice treated or not with T4. Mice were fasted for 16 h before they were killed. Values were normalized to untreated mice. IR‐β; n = 6 untreated, n = 5 T4‐treated. IRS1; n = 6 untreated, n = 5 T4‐treated. AKT; n = 6. FOXO1; n = 6 untreated, n = 5 T4‐treated. GSK3‐β; n = 5. ERK; n = 6 untreated, n = 5 T4‐treated. (C) Western blots indicating activation of insulin signalling in the skeletal muscle and the liver of T4‐treated mice. Mice were fasted for 16 h before they were killed. n = 5 per group. (D) Densitometric analysis of the Western blots using skeletal muscle extracts shown in panel C. Values were normalized to untreated mice. (E) Densitometric analysis of the Western blots using liver extracts shown in panel C. Values were normalized to untreated mice. (F) Representative images of Western blots showing the maximal activation of insulin signalling in T4‐treated and untreated mice challenged with an insulin injection (0.75 U·kg−1 of body weight) 15 min prior euthanization. Mice were fasted for 16 h before they were killed. (G) Densitometric analysis of the Western blots using skeletal muscle extracts shown in Supporting Information Figure S4A. n = 5 untreated, n = 6 T4‐treated. Values were normalized to untreated mice. (H) Densitometric analysis of the Western blots using liver extracts shown in Supporting Information Figure S4A. n = 5 untreated, n = 6 T4‐treated. Values were normalized to untreated mice. UT, untreated; T4, T4‐treated. Data shown are the means ± SEM. *P < 0.05, significantly different from untreated mice; two tailed Student's t‐test.
T4 supplementation improves glycaemic control in the RIP‐B7.1 model of EAD and increases survival in STZ‐treated mice
Given the effects of T4 supplementation in the promotion of beta cell proliferation and the increase of circulating insulin levels in healthy C57BL/6 mice, we next sought to determine whether T4 supplementation could blunt the onset of T1DM in the RIP‐B7.1 model of EAD (Harlan et al., 1994; Mellado‐Gil et al., 2016). To this end, RIP‐B7.1 mice were treated with T4, (5 μg·mL−1 in drinking water) starting at 6 weeks of age. RIP‐B7.1 mice were immunized at 8 weeks of age to trigger the autoimmune attack on the beta cells. Assay of circulating T4 levels revealed a significant increase in T4‐treated RIP‐B7.1 immunized mice when compared to untreated RIP‐B7.1 immunized mice (Supporting Information Figure S5A).
Noticeably, T4‐treated immunized RIP‐B7.1 mice gained weight over the course of the experiment, while control (untreated) immunized RIP‐B7.1 mice reached a plateau (Figure 5A). Thus, body weights were significantly different from week 4 of T4‐treatment. Similar to healthy wild‐type C57BL/6 mice (Figure 2D–E), the weight of several organs, including the BAT, was higher at the end of the experiment (5 weeks of T4‐treatment; 11 weeks of age) (Figure 5B). However, differences on the weight of gonadal WAT were not apparent, even when corrected for body weight (Figure 5B and Supporting Information Figure S5B).
Figure 5.
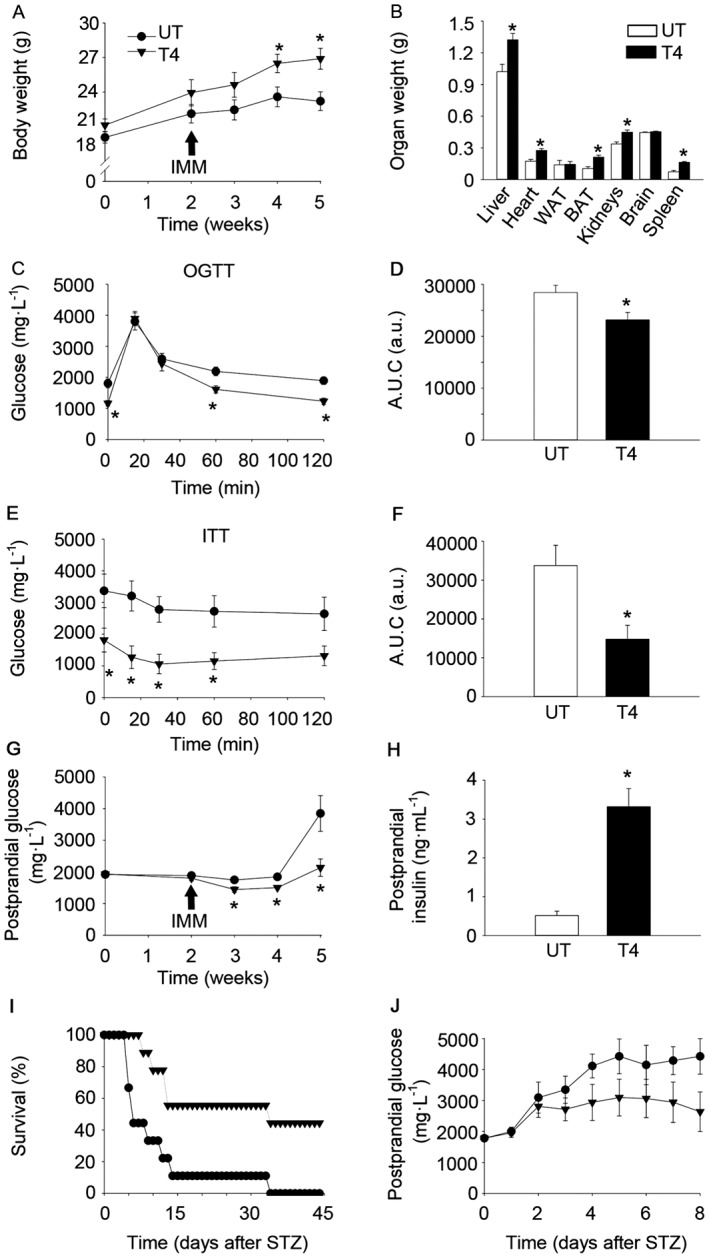
T4 blunts the onset of T1DM in the RIP‐B7.1 model of EAD and increases survival in STZ‐challenged C57BL/6 mice. (A) Body weight of RIP‐B7.1 mice. n = 8 untreated; n = 9 T4‐treated. (B) Organs weight of RIP‐B7.1 mice. n = 6 untreated; n = 9 T4‐treated. (C) Glucose concentration in blood during an OGTT at 4 weeks of T4‐treatment of RIP‐B7.1 mice. n = 8 untreated; n = 9 T4‐treated. (D) AUC of glucose levels during the OGTT. (E) Glucose concentration in blood during and ITT at 5 weeks of T4‐treatment of RIP‐B7.1 mice. n = 7 untreated; n = 9 T4‐treated. (F) AUC of glucose levels during the ITT. (G) Postprandial glucose concentration in blood on RIP‐B7.1 mice. n = 8 untreated; n = 9 T4‐treated. (H) Circulating insulin levels in fed conditions. n = 7 untreated; n = 8 T4‐treated. (I) Survival of C57BL/6 mice challenged with STZ. n = 9 per group. (J) Postprandial glucose concentration in blood from C57BL/6 mice challenged with STZ. Alive animals were included (see Figure 5I for n in each time point). UT, untreated; T4, T4‐treated; IMM, immunization. Arrows indicate the time of immunization. Data shown are the means ± SEM *P < 0.05, significantly different from untreated mice; two tailed Student's t‐test. A LogRank survival test was applied to survival curves.
In order to determine the effect of T4 supplementation in the pathogenesis of EAD, several metabolic tests were performed. An OGTT performed 2 weeks post‐immunization revealed enhanced glucose clearance in T4‐treated immunized RIP‐B7.1 mice (Figure 5C–D). An ITT performed 3 weeks post‐immunization indicated that circulating glucose was significantly lower in T4‐treated immunized RIP‐B7.1 mice at any time point during the experiment (Figure 5E–F). However, these differences seem to stem from the lower basal glucose levels in T4‐treated RIP‐B7.1 immunized mice. Postprandial glucose determination revealed that, while untreated immunized RIP‐B7.1 animals developed hyperglycaemia at 5 weeks of treatment (3 weeks post‐immunization), T4‐treated immunized RIP‐B7.1 mice remained normoglycaemic (Figure 5G). Remarkably, postprandial circulating insulin was dramatically increased in T4‐treated RIP‐B7.1 immunized mice, which was associated with increased phosphorylation of the IRS1 at Tyr632, in the liver (Figure 5H and Supporting Information Figure S5C–E). In order to determine whether T4 supplementation could improve glucoregulation in a different mouse model of experimental diabetes, STZ chemically induced diabetes mellitus was used. To this end, male wild‐type C57BL/6 mice were treated with T4 (5 μg·mL−1 in the drinking water), starting 2 weeks before injection of STZ (Verga Falzacappa et al., 2011). The average survival of control STZ‐treated mice was 8 days, whereas the T4‐treated group achieved a mean survival of 34 days, including some mice that survived STZ (Figure 5I; P < 0.05, χ 2 = 7,689). Postprandial glucose levels showed a trend towards reduced glycaemia in T4‐treated mice (Figure 5J). Taken together, our results indicate that treatment with T4 delayed the onset of T1DM in the RIP‐B7.1 model of EAD and increased survival in STZ‐induced experimental diabetes mellitus.
Immunohistochemical analyses were performed in order to determine the underlying effects of T4 supplementation on the pancreas of immunized RIP‐B7.1 mice. Although both immunized untreated and T4‐treated RIP‐B7.1 mice displayed a similar level of lymphocyte infiltration, T4‐treated mice exhibited a marked increase in insulin staining with no significant variation in glucagon staining (Figure 6A–C and Figure S6A–B). We next investigated whether T4 could also increase the proliferation of beta cells in the RIP‐B7.1 model of experimental T1DM. Interestingly, the abundance of islet‐residing Ki67 positive cells was increased in immunized RIP‐B7.1 mice when compared to healthy C57BL/6 mice, indicating that islet‐residing immune cells and/or pancreatic endocrine cells proliferate under the immune attack (Figures 3D and 6D). Nonetheless, T4‐treated immunized RIP‐B7.1 mice exhibited a marked increase in proliferating beta cells when compared to untreated immunized RIP‐B7.1 mice (Figure 6D–E). As expected, the immune attack increased the percentage of apoptotic beta cells in both, T4‐treated and untreated immunized RIP‐B7.1 mice (Figures 3G–H and 6F–G). However, no differences were observed between T4‐treated and untreated immunized RIP‐B7.1 mice. These results suggest that increased beta cell proliferation might be the underlying mechanism by which T4 blunts the onset of experimental T1DM in mice.
Figure 6.
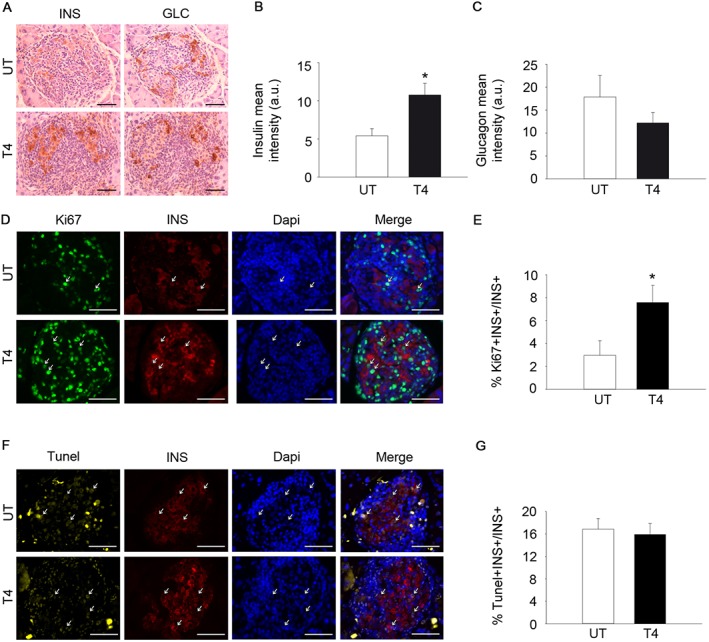
T4 increases insulin expression and enhances beta cell proliferation in the RIP‐B7.1 model of EAD. (A) Representative images of glucagon (GLC) and insulin (INS) staining in pancreases from immunized RIP‐B7.1 mice, with or without T4. Diaminobenzidine staining followed by haematoxylin counterstaining. Scale bar, 50 μm. n = 6 untreated; n = 5 T4‐treated. (B) Quantification of insulin staining (mean intensity). (C) Quantification of glucagon staining (mean intensity). (D) Representative images of Ki67 and insulin staining in pancreas from immunized RIP‐B7.1 mice, with or without T4. Immunofluorescence followed by DAPI staining. Scale bar = 50 μm. n = 5 untreated; n = 5 T4‐treated. (E) Percentage of Ki67+‐Insulin+ cells over total insulin+ cells. (F) Representative images of TUNEL and insulin staining in pancreases from immunized RIP‐B7.1 mice, with or without T4. Immunofluorescence followed by DAPI staining. Scale bar = 50 μm. n = 5 per group. (G) TUNEL Insulin+ cells, as % total insulin+ cells. UT, untreated; T4, T4‐treated. Arrows indicate representative positive staining. Data shown are the means ± SEM. *P < 0.05, significantly different from untreated mice; two tailed Student's t‐test.
Discussion
Supplementation with THs provides undeniably positive benefits for metabolic health, attenuating hyperglycaemia in STZ‐treated and leptin‐receptor deficient mice (Lin and Sun, 2011; Verga Falzacappa et al., 2011; Shoemaker et al., 2012). Therefore, THs or their analogues could represent a promising therapeutic approach for the treatment of metabolic complications. However, the detrimental effects of high circulating levels of THs (thyrotoxicosis) are well known. Patients suffering thyrotoxicosis exhibit a pleiotropy of symptoms that include life‐threatening disorders such as cardiovascular collapse and thyroid storm, among others (Bahn et al., 2011; Garmendia Madariaga et al., 2014). These risks have precluded the investigation of potential therapies based on the use of THs to treat metabolic disorders.
In this report, we show that a level of T4 supplementation modulates the thyroid‐pituitary axis, increases insulin concentration in blood and enhances glucose clearance, while maintaining an overall healthy status in wild‐type C57BL/6 mice. Our results indicate that T4 supplementation increases insulin content in pancreatic beta cells. The mechanism underlying the increase in insulin content may rely on a TH‐dependent regulation of expression of the transcription factor MAFA. Previous reports have demonstrated that the T3‐TR complex induces MAFA transcription through direct binding to TH response elements located in the MAFA promoter (Aguayo‐Mazzucato et al., 2013). Moreover, MAFA is known to bind to the insulin promoter, inducing insulin expression (Olbrot et al., 2002; Matsuoka et al., 2004), providing a plausible molecular mechanism by which T4 supplementation enhances insulin expression in pancreatic beta cells. However, as opposed to a previous study using 7‐day‐old mice, our immunohistochemical analysis in pancreatic sections of adult mice indicated that MAFA is predominantly located in the nucleus of pancreatic beta cells and T4 supplementation does not further promote the nuclear localization of MAFA, suggesting that the presence/absence of MAFA in the nucleus of pancreatic beta cells does not control insulin expression in adulthood (Aguayo‐Mazzucato et al., 2013). Remarkably, islets isolated from mice treated with T4 exhibited a marked increase in GK gene and protein expression. Increased GK expression might contribute to the increased insulin secretion under fasting conditions, as observed in GSIS tests, because increased GK activity has been previously shown to lower the glucose threshold that stimulates insulin secretion (Weinhaus et al., 2007; Kassem et al., 2010). Increased circulating insulin activates the IRS1‐Akt axis of insulin signalling, suggesting that glucose uptake is increased in insulin target tissues. T4 is known to increase the basal metabolic rate by inducing the expression of several mitochondrial uncoupling proteins, such as UCP2 (Lanni et al., 2003; Ramadan et al., 2011). As a result of increased mitochondrial uncoupling, mitochondrial efficiency is lower (defined here as the amount of nutrients used to produce one molecule of ATP) and heat production is increased (note that BAT weight in T4‐treated animals was increased). In order to adapt to this situation, T4‐treated cells require higher amounts of nutrients to maintain their metabolism. Therefore, it is tempting to speculate that insulin expression and secretion in pancreatic islets under fasting conditions is enhanced in mice treated with T4 to allow nutrient uptake by insulin‐target tissues. Supporting this hypothesis, we found that, as opposed to untreated animals, in which a significant increase in insulin levels was promoted by a glucose bolus, insulin levels in T4‐treated mice were already maximal before glucose load, suggesting that the insulin secretion machinery is already active. Moreover, our results also indicate that beta cell proliferation and apoptosis are specifically increased in mice treated with T4. Remarkably, increased GK activity has been associated to increased beta cell proliferation and apoptosis, suggesting that the increase in GK expression induced by T4 administration might contribute to the enhancement of beta cell turnover, promoting the existence of a highly insulin‐expressing beta cell population, which actively secretes insulin into the circulation under basal conditions (Kassem et al., 2000; Kassem et al., 2010). Given the age of the animals, the length of the treatment (~24 weeks at the end of th experiment, which represents ~25% of an average lifespan of this mouse strain) and the mouse chow used in this study (a standard healthy diet), we do not believe that the increase of insulin expression in pancreatic beta cells found in T4‐treated mice was indicative of over‐stimulation of beta cells, as found in pre‐diabetic individuals (Martin‐Montalvo et al., 2013). The analysis of insulin‐target tissues indicates that the higher insulin concentration in blood is able to activate the IRS1‐Akt axis of the insulin signalling pathway. Previous reports have indicated that T4 exerts non‐genomic effects by activating specifically PI3K and its downstream targets (Lin and Sun, 2011). Although we cannot exclude that non‐genomic T4 actions contribute to the activation of PI3K and its downstream targets in vivo, we found that T4 supplementation activates insulin signalling as early as the level of IRS1, as shown by the increase in pTyr632‐IRS1 in skeletal muscles and in livers of T4‐treated mice. Remarkably, we found that both T4‐supplemented and control mice treated with insulin at the end of the experiment, reached the same level of Akt activation (pSer473‐Akt levels). Therefore, our results suggest that high insulin levels per se are responsible for T4‐mediated AKT activation.
In this report, we also show that T4 supplementation blunts the onset of T1DM using the RIP‐B7.1 model of EAD and increases survival in STZ‐induced experimental diabetes in wild‐type C57BL/6 mice. Previous research has determined that during the onset of T1DM, beta cell proliferation is increased in an attempt to compensate beta cell loss (Willcox et al., 2010). We observed that, although immune infiltration and the percentage of apoptotic beta cells is similarly augmented in untreated or T4‐treated pancreases during the immune attack, beta cell proliferation is remarkably increased in T4‐treated RIP‐B7.1 mice. This process presumably leads to compensation for beta cell loss, allowing the production and secretion of enough insulin to maintain normoglycaemia. Our experimental design initiated T4 supplementation 2 weeks prior to induction of diabetes mellitus (immunization or STZ treatment), as these research models (EAD and STZ) are very aggressive and a significant percentage of mice die within the first 2 weeks after the induction of diabetes. In order to evaluate a possible therapeutic benefit, experiments aiming to determine whether T4 supplementation after the onset of T1DM could improve glucoregulation would be required. Our results indicate that interventions based on the use of THs or thyromimetics could open novel venues for the treatment of T1DM. Whereas novel treatments including the use of T4 supplementation might not be optimal for the treatment of metabolic diseases due to side effects, certain newly developed thyromimetics could affect specific cell types or organs that could benefit from these actions of THs, resulting in the improvement of metabolic homeostasis, while avoiding side effects (Shoemaker et al., 2012; Coppola et al., 2014; Finan et al., 2016). Although the profound systemic effects of the T4‐administration in mice suggest that THs and thyromimetics might be useful in ameliorating the abnormal metabolism in diabetic patients, the identification of the underlying mechanisms that are critical for the observed improvements on glucose control and potential long‐term toxic effects must be addressed before results in mice could be extrapolated to humans.
Author contributions
L.L.‐N. performed most of the experiments and contributed to data analysis, discussion and writing the manuscript. N.C.‐V. designed and supervised the experiments using the RIP‐B7.1 mice and STZ‐treated mice. A.J.N.‐P. and J.L.A.‐G. performed Western blots and semi‐quantitative RT‐PCRs. P.I.L. and J.M.M.‐G. assisted in experimentation. J.C.M. contributed to the experimental design and discussions. B.R.G. and A.M.‐M. designed and supervised the study, secured funding, analysed the data and wrote the manuscript. All authors discussed the results and commented on the manuscript.
Conflict of interest
The authors declare no conflicts of interest.
Declaration of transparency and scientific rigour
This Declaration acknowledges that this paper adheres to the principles for transparent reporting and scientific rigour of preclinical research recommended by funding agencies, publishers and other organisations engaged with supporting research.
Supporting information
Figure S1 Glucose levels in metabolic test expressed as percentage of basal glucose. (A) Circulating T4 levels in fed conditions. Age = 13 weeks. n = 7 untreated; n = 8 T4‐treated. (B) Glucose concentration in blood during the OGTT expressed as the percentage of basal (time 0) glucose. n = 13 per group. (C) Glucose concentration in blood during the IPPTT expressed as the percentage of basal glucose. n = 7 untreated; n = 8 T4‐treated. (D) Glucose concentration in blood during the ITT expressed as the percentage of basal glucose. n = 12 untreated; n = 13 T4‐treated. (E) Glucose concentration in blood during a 24‐hour fasting period expressed as the percentage of basal glucose. n = 7 untreated; n = 8 T4‐treated. (F) Homeostatic assessment of insulin resistance (HOMA‐IR) index. Age = 12 weeks. n = 7 untreated; n = 8 T4‐treated. UT: Untreated; T4: T4‐treated. Data are represented as the mean ± SEM. * P < 0.05 significantly different from untreated mice. A two tailed t‐test was applied to panels A and F. A Mann–Whitney Rank Sum test was applied to panels B‐E.
Figure S2 Energy intake and histology of the thyroid and the pituitary of in T4‐treated mice. (A) Energy intake divided by body weight. n = 7 untreated; n = 8 T4‐treated. (B) Representative images of the histological analysis o the thyroid and pituitary of T4‐treated and untreated mice. Thyroid; n = 6 untreated; n = 7 T4‐treated. Pituitary; n = 5 untreated; n = 6 T4‐treated. (C) Determination of the α‐GSU of pituitary hormones in the serum of T4‐treated and untreated mice. n = 7 untreated; n = 8 T4‐treated. UT: Untreated; T4: T4‐treated. Data are represented as the mean ± SEM. * P < 0.05 significantly different from untreated mice (two tailed t‐test).
Figure S3 The subcellular localization of MAFA and FOXO1 is not affected by T4 supplementation. (A) Pancreatic islets were isolated from animals treated or not with T4. Determination of messenger RNA (mRNA) levels of genes involved in pancreatic islet metabolism. Values were normalized to islets isolated from untreated mice. n = 6 untreated; n = 5 T4‐treated. (B) Representative images of MAFA and insulin (INS) immunofluorescence staining in pancreases from mice treated or not with T4. Scale bar = 50 μm. n = 5 per group. (C) Representative images of FOXO1 and INS immunofluorescence staining in pancreases from mice treated or not with T4. Scale bar = 50 μm. n = 5 per group. UT: 2 Untreated; T3: T3‐treated; T4: T4‐treated. Data are represented as the mean ± SEM. * P < 0.05 significantly different from untreated mice (two tailed t‐test).
Figure S4 T4 induces a starvation‐like state in the skeletal muscle. (A) Western blots indicating activation of AKT in the skeletal muscle and the liver of T4‐treated mice. Mice were fasted for 16 hours and then injected with insulin (0.75 UI.kg‐1 of body weight) 15 minutes before the end of the experiment. n = 5 untreated; n = 6 T4‐treated. (B) Determination of mRNA levels of genes involved in energy metabolism in the skeletal muscle of mice treated or not with T4. Values were normalized to untreated mice. GLUT2; n = 5 untreated, n = 6 T4‐treated. GK; n = 5 untreated, n = 6 T4‐treated. G6Pase; n = 5 untreated, n = 6 T4‐treated. LPK; n = 5 untreated, n = 6 T4‐treated. PEPCK; n = 5 untreated, n = 6 T4‐treated. GAPDH; n = 6. LDH; n = 5 untreated, n = 6 T4‐treated. PGC1α; n = 6. PGC1β; n = 6. UCP2; n = 5. SREBP1c; n = 5 untreated, n = 6 T4‐treated. (C) Determination of mRNA levels of genes involved in energy metabolism in the liver of mice treated or not with T4. Values were normalized to untreated mice. GLUT2; n = 5 untreated, n = 6 T4‐treated. GK; n = 5. G6Pase; n = 5 untreated, n = 6 T4‐treated. LPK; n = 5 untreated, n = 6 T4‐treated. PEPCK; n = 5 untreated, n = 6 T4‐treated. GAPDH; n = 6 untreated, n = 5 T4‐treated. LDH; n = 5. PGC1α; n = 5 untreated, n = 6 T4‐treated. PGC1β; n = 6. UCP2; n = 6 untreated, n = 5 T4‐treated. SREBP1c; n = 6 untreated, n = 5 T4‐treated. (D) Western blots indicating activation of AMPK in the skeletal muscle and the liver of T4‐treated mice. Mice were fasted for 16 hours prior euthanization. n = 5 per group. (E) Densitometric analysis of the western blots using skeletal muscle extracts shown in Supporting Information Figure S4D. Values were normalized to untreated mice. (F) Densitometric analysis of the western blots using liver extracts shown in Supporting Information Figure S4D. Values were normalized to untreated mice. UT: Untreated; T4: T4‐treated. Data are represented as the mean ± SEM. * P < 0.05 significantly different from untreated mice (two tailed t‐test).
Figure S5 T4 supplementation increased circulating T4, alters organs weight and modulates insulin signalling in immunized RIP‐B7.1 mice. (A) Circulating T4 levels in fed conditions. n = 9 untreated; n = 8 T4‐treated. (B) Organs weight divided by body weight. n = 6 untreated; n = 9 T4‐treated. (C) Western blots showing the amount of phospho‐tyrosine 632 IRS1, total IRS1 and GAPDH, used as loading control, in the skeletal muscle and the liver of T4‐treated mice. Skeletal muscle n = 6 untreated, n = 5 T4‐treated. Liver n = 6 per group. (D) Densitometric analysis of the western blots using skeletal muscle extracts shown in Supporting 3 Information Figure S5C. Values were normalized to untreated mice. (E) Densitometric analysis of the western blots using liver extracts shown in Supporting Information Figure S5C. Values were normalized to untreated mice. UT: Untreated; T4: T4‐treated. Data are represented as the mean ± SEM. * P < 0.05 significantly different from untreated mice (two tailed t‐test).
Figure S6 T4‐treated and untreated immunized RIP‐B7.1 mice show similar degree of insulitis. (A) Representative images of immune infiltrations in T4‐treated and untreated immunized RIP‐B7.1 mice. (B) Insulitis was scored as grade 0–4 according to the percentage of infiltrated islet area (0: 0%; 1: <10%; 2: >10% and <55%; 3: >55% and <75%; 4: >75%). Scale bar = 50 μm. n = 5 per group. UT: Untreated; T4: T4‐treated. Data are represented as the mean ± SEM. * P < 0.05 significantly different from untreated mice (two tailed t‐test).
Table S1 Antibodies used in this study.
Table S2 Primer pair sequences used for quantitative RT‐PCR analysis.
Acknowledgements
We thank Noelia García‐Rodriguez, Victor López‐Díaz and Leopoldo Perez‐Rosendo for their excellent technical assistance. This work was funded by grants from the Ministerio de Economía y Competitividad, Instituto de Salud Carlos III co‐funded by Fondos FEdeR (PI13/00593 to B.R.G.) and (CP14/00105 and PI15/00134 to A.M.‐M.) from the Instituto de Salud Carlos III co‐funded by Instituto de Salud Carlos III and FEdeR. A.M.‐M. and B.R.G. are the guarantors of this work and, as such, had full access to all the data in the study and take responsibility for the integrity of the data and the accuracy of the data analysis.
López‐Noriega, L. , Cobo‐Vuilleumier, N. , Narbona‐Pérez, Á. J. , Araujo‐Garrido, J. L. , Lorenzo, P. I. , Mellado‐Gil, J. M. , Moreno, J. C. , Gauthier, B. R. , and Martín‐Montalvo, A. (2017) Levothyroxine enhances glucose clearance and blunts the onset of experimental type 1 diabetes mellitus in mice. British Journal of Pharmacology, 174: 3795–3810. doi: 10.1111/bph.13975.
Contributor Information
Benoit R Gauthier, Email: benoit.gauthier@cabimer.es.
Alejandro Martín‐Montalvo, Email: alejandro.martinmontalvo@cabimer.es.
References
- Aguayo‐Mazzucato C, Zavacki AM, Marinelarena A, Hollister‐Lock J, El Khattabi I, Marsili A et al (2013). Thyroid hormone promotes postnatal rat pancreatic beta‐cell development and glucose‐responsive insulin secretion through MAFA. Diabetes 62: 1569–1580. https://doi.org/10.2337/db12‐0849. [DOI] [PMC free article] [PubMed] [Google Scholar]
- Aiello V, Moreno‐Asso A, Servitja JM, Martin M (2014). Thyroid hormones promote endocrine differentiation at expenses of exocrine tissue. Exp Cell Res 322: 236–248. https://doi.org/10.1016/j.yexcr.2014.01.030. [DOI] [PubMed] [Google Scholar]
- Alexander SPH, Cidlowski JA, Kelly E, Marrion N, Peters JA, Benson HE et al (2015a). The Concise Guide to PHARMACOLOGY 2015/16: Nuclear hormone receptors. Br J Pharmacol 172: 5956–5978. [DOI] [PMC free article] [PubMed] [Google Scholar]
- Alexander SPH, Fabbro D, Kelly E, Marrion N, Peters JA, Benson HE et al (2015b). The Concise Guide to PHARMACOLOGY 2015/16: Enzymes. Br J Pharmacol 172: 6024–6109. [DOI] [PMC free article] [PubMed] [Google Scholar]
- Bahn RS, Burch HB, Cooper DS, Garber JR, Greenlee MC, Klein I et al (2011). Hyperthyroidism and other causes of thyrotoxicosis: management guidelines of the American Thyroid Association and American Association of Clinical Endocrinologists. Endocr Pract 17: 456–520. https://doi.org/10.4158/EP.17.3.456. [DOI] [PubMed] [Google Scholar]
- Ball SG, Sokolov J, Chin WW (1997). 3,5‐Diiodo‐L‐thyronine (T2) has selective thyromimetic effects in vivo and in vitro. J Mol Endocrinol 19: 137–147. https://doi.org/10.1677/jme.0.0190137. [DOI] [PubMed] [Google Scholar]
- Bello RI, Alcain FJ, Gomez‐Diaz C, Lopez‐Lluch G, Navas P, Villalba JM (2003). Hydrogen peroxide‐ and cell‐density‐regulated expression of NADH‐cytochrome b5 reductase in HeLa cells. J Bioenerg Biomembr 35: 169–179. https://doi.org/10.1023/A:1023702321148. [DOI] [PubMed] [Google Scholar]
- Buras A, Battle L, Landers E, Nguyen T, Vasudevan N (2014). Thyroid hormones regulate anxiety in the male mouse. Horm Behav 65: 88–96. https://doi.org/10.1016/j.yhbeh.2013.11.008. [DOI] [PubMed] [Google Scholar]
- Coppola M, Glinni D, Moreno M, Cioffi F, Silvestri E, Goglia F (2014). Thyroid hormone analogues and derivatives: actions in fatty liver. World J Hepatol 6: 114–129. https://doi.org/10.4254/wjh.v6.i3.114. [DOI] [PMC free article] [PubMed] [Google Scholar]
- Curtis MJ, Bond RA, Spina D, Ahluwalia A, Alexander SP, Giembycz MA et al (2015). Experimental design and analysis and their reporting: new guidance for publication in BJP. Br J Pharmacol 172: 3461–3471. https://doi.org/10.1111/bph.12856. [DOI] [PMC free article] [PubMed] [Google Scholar]
- Dimitriadis GD, Raptis SA (2001). Thyroid hormone excess and glucose intolerance. Exp Clin Endocrinol Diabetes 109 (Suppl 2): S225–S239. https://doi.org/10.1055/s‐2001‐18584. [DOI] [PubMed] [Google Scholar]
- Dong H, Paquette M, Williams A, Zoeller RT, Wade M, Yauk C (2010). Thyroid hormone may regulate mRNA abundance in liver by acting on microRNAs. PLoS One 5: e12136 https://doi.org/10.1371/journal.pone.0012136. [DOI] [PMC free article] [PubMed] [Google Scholar]
- Dong H, Yauk CL, Rowan‐Carroll A, You SH, Zoeller RT, Lambert I et al (2009). Identification of thyroid hormone receptor binding sites and target genes using ChIP‐on‐chip in developing mouse cerebellum. PLoS One 4: e4610 https://doi.org/10.1371/journal.pone.0004610. [DOI] [PMC free article] [PubMed] [Google Scholar]
- Finan B, Clemmensen C, Zhu Z, Stemmer K, Gauthier K, Muller L et al (2016). Chemical hybridization of glucagon and thyroid hormone optimizes therapeutic impact for metabolic disease. Cell 167: 843–857 e14. https://doi.org/10.1016/j.cell.2016.09.014. [DOI] [PubMed] [Google Scholar]
- Garmendia Madariaga A, Santos Palacios S, Guillen‐Grima F, Galofre JC (2014). The incidence and prevalence of thyroid dysfunction in Europe: a meta‐analysis. J Clin Endocrinol Metab 99: 923–931. https://doi.org/10.1210/jc.2013‐2409. [DOI] [PubMed] [Google Scholar]
- Goglia F (2014). The effects of 3,5‐diiodothyronine on energy balance. Front Physiol 5: 528 https://doi.org/10.3389/fphys.2014.00528. [DOI] [PMC free article] [PubMed] [Google Scholar]
- Harlan DM, Hengartner H, Huang ML, Kang YH, Abe R, Moreadith RW et al (1994). Mice expressing both B7‐1 and viral glycoprotein on pancreatic beta cells along with glycoprotein‐specific transgenic T cells develop diabetes due to a breakdown of T‐lymphocyte unresponsiveness. Proc Natl Acad Sci U S A 91: 3137–3141. [DOI] [PMC free article] [PubMed] [Google Scholar]
- Iwen KA, Schroder E, Brabant G (2013). Thyroid hormones and the metabolic syndrome. Eur Thyroid J 2: 83–92. https://doi.org/10.1159/000351249. [DOI] [PMC free article] [PubMed] [Google Scholar]
- Jimenez‐Moreno CM, Herrera‐Gomez IG, Lopez‐Noriega L, Lorenzo PI, Cobo‐Vuilleumier N, Fuente‐Martin E et al (2015). A simple high efficiency intra‐islet transduction protocol using lentiviral vectors. Curr Gene Ther 15: 436–446. https://doi.org/10.2174/1566523215666150630121557. [DOI] [PMC free article] [PubMed] [Google Scholar]
- Johannsen DL, Galgani JE, Johannsen NM, Zhang Z, Covington JD, Ravussin E (2012). Effect of short‐term thyroxine administration on energy metabolism and mitochondrial efficiency in humans. PLoS One 7: e40837 https://doi.org/10.1371/journal.pone.0040837. [DOI] [PMC free article] [PubMed] [Google Scholar]
- Kassem S, Bhandari S, Rodriguez‐Bada P, Motaghedi R, Heyman M, Garcia‐Gimeno MA et al (2010). Large islets, beta‐cell proliferation, and a glucokinase mutation. N Engl J Med 362: 1348–1350. https://doi.org/10.1056/NEJMc0909845. [DOI] [PubMed] [Google Scholar]
- Kassem SA, Ariel I, Thornton PS, Scheimberg I, Glaser B (2000). Beta‐cell proliferation and apoptosis in the developing normal human pancreas and in hyperinsulinism of infancy. Diabetes 49: 1325–1333. https://doi.org/10.2337/diabetes.49.8.1325. [DOI] [PubMed] [Google Scholar]
- Kikuchi O, Kobayashi M, Amano K, Sasaki T, Kitazumi T, Kim HJ et al (2012). FoxO1 gain of function in the pancreas causes glucose intolerance, polycystic pancreas, and islet hypervascularization. PLoS One 7: e32249 https://doi.org/10.1371/journal.pone.0032249. [DOI] [PMC free article] [PubMed] [Google Scholar]
- Kilkenny C, Browne W, Cuthill IC, Emerson M, Altman DG (2010). Animal research: reporting in vivo experiments: the ARRIVE guidelines. Br J Pharmacol 160: 1577–1579. [DOI] [PMC free article] [PubMed] [Google Scholar]
- Klieverik LP, Sauerwein HP, Ackermans MT, Boelen A, Kalsbeek A, Fliers E (2008). Effects of thyrotoxicosis and selective hepatic autonomic denervation on hepatic glucose metabolism in rats. Am J Physiol Endocrinol Metab 294: E513–E520. [DOI] [PubMed] [Google Scholar]
- de Lange P, Cioffi F, Senese R, Moreno M, Lombardi A, Silvestri E et al (2011). Nonthyrotoxic prevention of diet‐induced insulin resistance by 3,5‐diiodo‐L‐thyronine in rats. Diabetes 60: 2730–2739. https://doi.org/10.2337/db11‐0207. [DOI] [PMC free article] [PubMed] [Google Scholar]
- Lanni A, Moreno M, Lombardi A, Goglia F (2003). Thyroid hormone and uncoupling proteins. FEBS Lett 543: 5–10. https://doi.org/10.1016/S0014‐5793(03)00320‐X. [DOI] [PubMed] [Google Scholar]
- Levy JC, Matthews DR, Hermans MP (1998). Correct homeostasis model assessment (HOMA) evaluation uses the computer program. Diabetes Care 21: 2191–2192. https://doi.org/10.2337/diacare.21.12.2191. [DOI] [PubMed] [Google Scholar]
- Lin Y, Sun Z (2011). Thyroid hormone potentiates insulin signaling and attenuates hyperglycemia and insulin resistance in a mouse model of type 2 diabetes. Br J Pharmacol 162: 597–610. https://doi.org/10.1111/j.1476‐5381.2010.01056.x. [DOI] [PMC free article] [PubMed] [Google Scholar]
- Martin‐Montalvo A, Mercken EM, Mitchell SJ, Palacios HH, Mote PL, Scheibye‐Knudsen M et al (2013). Metformin improves healthspan and lifespan in mice. Nat Commun 4: 2192 https://doi.org/10.1038/ncomms3192. [DOI] [PMC free article] [PubMed] [Google Scholar]
- Mastracci TL, Evans‐Molina C (2014). Pancreatic and islet development and function: the role of thyroid hormone. J Endocrinol Diabetes Obes 2: 1014. [PMC free article] [PubMed] [Google Scholar]
- Matsuoka TA, Artner I, Henderson E, Means A, Sander M, Stein R (2004). The MafA transcription factor appears to be responsible for tissue‐specific expression of insulin. Proc Natl Acad Sci U S A 101: 2930–2933. [DOI] [PMC free article] [PubMed] [Google Scholar]
- McGrath JC, Lilley E (2015). Implementing guidelines on reporting research using animals (ARRIVE etc.): new requirements for publication in BJP. Br J Pharmacol 172: 3189–3193. [DOI] [PMC free article] [PubMed] [Google Scholar]
- Mellado‐Gil JM, Jimenez‐Moreno CM, Martin‐Montalvo A, Alvarez‐Mercado AI, Fuente‐Martin E, Cobo‐Vuilleumier N et al (2016). PAX4 preserves endoplasmic reticulum integrity preventing beta cell degeneration in a mouse model of type 1 diabetes mellitus. Diabetologia 59: 755–765. https://doi.org/10.1007/s00125‐016‐3864‐0. [DOI] [PMC free article] [PubMed] [Google Scholar]
- Misiti S, Anastasi E, Sciacchitano S, Verga Falzacappa C, Panacchia L, Bucci B et al (2005). 3,5,3′‐Triiodo‐L‐thyronine enhances the differentiation of a human pancreatic duct cell line (hPANC‐1) towards a beta‐cell‐Like phenotype. J Cell Physiol 204: 286–296. https://doi.org/10.1002/jcp.20293. [DOI] [PubMed] [Google Scholar]
- Mitchell SJ, Martin‐Montalvo A, Mercken EM, Palacios HH, Ward TM, Abulwerdi G et al (2014). The SIRT1 activator SRT1720 extends lifespan and improves health of mice fed a standard diet. Cell Rep 6: 836–843. https://doi.org/10.1016/j.celrep.2014.01.031. [DOI] [PMC free article] [PubMed] [Google Scholar]
- Moreno M, Silvestri E, De Matteis R, de Lange P, Lombardi A, Glinni D et al (2011). 3,5‐Diiodo‐L‐thyronine prevents high‐fat‐diet‐induced insulin resistance in rat skeletal muscle through metabolic and structural adaptations. FASEB J 25: 3312–3324. https://doi.org/10.1096/fj.11‐181982. [DOI] [PubMed] [Google Scholar]
- Mysliwiec J, Zbucki R, Nikolajuk A, Mysliwiec P, Kaminski K, Bondyra Z et al (2011). Estrogens modulate RANKL‐RANK/osteoprotegerin mediated interleukin‐6 effect on thyrotoxicosis‐related bone turnover in mice. Horm Metab Res 43: 236–240. https://doi.org/10.1055/s‐0031‐1271776. [DOI] [PubMed] [Google Scholar]
- Obregon MJ (2008). Thyroid hormone and adipocyte differentiation. Thyroid 18: 185–195. https://doi.org/10.1089/thy.2007.0254. [DOI] [PubMed] [Google Scholar]
- Olbrot M, Rud J, Moss LG, Sharma A (2002). Identification of beta‐cell‐specific insulin gene transcription factor RIPE3b1 as mammalian MafA. Proc Natl Acad Sci U S A 99: 6737–6742. [DOI] [PMC free article] [PubMed] [Google Scholar]
- Pagliuca FW, Millman JR, Gurtler M, Segel M, Van Dervort A, Ryu JH et al (2014). Generation of functional human pancreatic beta cells in vitro. Cell 159: 428–439. https://doi.org/10.1016/j.cell.2014.09.040. [DOI] [PMC free article] [PubMed] [Google Scholar]
- Ramadan W, Marsili A, Larsen PR, Zavacki AM, Silva JE (2011). Type‐2 iodothyronine 5'deiodinase (D2) in skeletal muscle of C57Bl/6 mice. II. Evidence for a role of D2 in the hypermetabolism of thyroid hormone receptor alpha‐deficient mice. Endocrinology 152: 3093–3102. https://doi.org/10.1210/en.2011‐0139. [DOI] [PMC free article] [PubMed] [Google Scholar]
- Rezania A, Bruin JE, Arora P, Rubin A, Batushansky I, Asadi A et al (2014). Reversal of diabetes with insulin‐producing cells derived in vitro from human pluripotent stem cells. Nat Biotechnol 32: 1121–1133. https://doi.org/10.1038/nbt.3033. [DOI] [PubMed] [Google Scholar]
- Senese R, Cioffi F, de Lange P, Goglia F, Lanni A (2014). Thyroid: biological actions of ‘nonclassical’ thyroid hormones. J Endocrinol 221: R1–12. https://doi.org/10.1530/JOE‐13‐0573. [DOI] [PubMed] [Google Scholar]
- Shang G, Gao P, Zhao Z, Chen Q, Jiang T, Zhang N et al (2013). 3,5‐Diiodo‐l‐thyronine ameliorates diabetic nephropathy in STZ‐induced diabetic rats. Biochim Biophys Acta 1832: 674–684. [DOI] [PubMed] [Google Scholar]
- Shoemaker TJ, Kono T, Mariash CN, Evans‐Molina C (2012). Thyroid hormone analogues for the treatment of metabolic disorders: new potential for unmet clinical needs? Endocr Pract 18: 954–964. https://doi.org/10.4158/EP12086.RA. [DOI] [PMC free article] [PubMed] [Google Scholar]
- Sirakov M, Skah S, Nadjar J, Plateroti M (2013). Thyroid hormone's action on progenitor/stem cell biology: new challenge for a classic hormone? Biochim Biophys Acta 1830: 3917–3927. [DOI] [PubMed] [Google Scholar]
- Southan C, Sharman JL, Benson HE, Faccenda E, Pawson AJ, Alexander SPH et al (2016). The IUPHAR/BPS guide to PHARMACOLOGY in 2016: towards curated quantitative interactions between 1300 protein targets and 6000 ligands. Nucl Acids Res 44: D1054–D1068. https://doi.org/10.1093/nar/gkv1037. [DOI] [PMC free article] [PubMed] [Google Scholar]
- Spencer PS, West GB (1961). Sensitivity of the hyperthyroid and hypothyroid mouse to histamine and 5‐hydroxytryptamine. Br J Pharmacol Chemother 17: 137–143. https://doi.org/10.1111/j.1476‐5381.1961.tb01114.x. [DOI] [PMC free article] [PubMed] [Google Scholar]
- Vargas‐Uricoechea H, Bonelo‐Perdomo A, Sierra‐Torres CH (2014). Effects of thyroid hormones on the heart. Clin Investig Arterioscler 26: 296–309. https://doi.org/10.1016/j.arteri.2014.07.003. [DOI] [PubMed] [Google Scholar]
- Verga Falzacappa C, Mangialardo C, Madaro L, Ranieri D, Lupoi L, Stigliano A et al (2011). Thyroid hormone T3 counteracts STZ induced diabetes in mouse. PLoS One 6: e19839 https://doi.org/10.1371/journal.pone.0019839. [DOI] [PMC free article] [PubMed] [Google Scholar]
- Verga Falzacappa C, Patriarca V, Bucci B, Mangialardo C, Michienzi S, Moriggi G et al (2009). The TRbeta1 is essential in mediating T3 action on Akt pathway in human pancreatic insulinoma cells. J Cell Biochem 106: 835–848. https://doi.org/10.1002/jcb.22045. [DOI] [PubMed] [Google Scholar]
- Vicinanza R, Coppotelli G, Malacrino C, Nardo T, Buchetti B, Lenti L et al (2013). Oxidized low‐density lipoproteins impair endothelial function by inhibiting non‐genomic action of thyroid hormone‐mediated nitric oxide production in human endothelial cells. Thyroid 23: 231–238. https://doi.org/10.1089/thy.2011.0524. [DOI] [PMC free article] [PubMed] [Google Scholar]
- Weinhaus AJ, Stout LE, Bhagroo NV, Brelje TC, Sorenson RL (2007). Regulation of glucokinase in pancreatic islets by prolactin: a mechanism for increasing glucose‐stimulated insulin secretion during pregnancy. J Endocrinol 193: 367–381. https://doi.org/10.1677/JOE‐07‐0043. [DOI] [PubMed] [Google Scholar]
- Weinstein SP, O'boyle E, Haber RS (1994). Thyroid hormone increases basal and insulin‐stimulated glucose transport in skeletal muscle. The role of GLUT4 glucose transporter expression. Diabetes 43: 1185–1189. https://doi.org/10.2337/diab.43.10.1185. [DOI] [PubMed] [Google Scholar]
- Weinstein SP, Watts J, Haber RS (1991). Thyroid hormone increases muscle/fat glucose transporter gene expression in rat skeletal muscle. Endocrinology 129: 455–464. https://doi.org/10.1210/endo‐129‐1‐455. [DOI] [PubMed] [Google Scholar]
- Willcox A, Richardson SJ, Bone AJ, Foulis AK, Morgan NG (2010). Evidence of increased islet cell proliferation in patients with recent‐onset type 1 diabetes. Diabetologia 53: 2020–2028. https://doi.org/10.1007/s00125‐010‐1817‐6. [DOI] [PubMed] [Google Scholar]
- Wistuba J, Mittag J, Luetjens CM, Cooper TG, Yeung CH, Nieschlag E et al (2007). Male congenital hypothyroid Pax8−/− mice are infertile despite adequate treatment with thyroid hormone. J Endocrinol 192: 99–109. https://doi.org/10.1677/JOE‐06‐0054. [DOI] [PubMed] [Google Scholar]
Associated Data
This section collects any data citations, data availability statements, or supplementary materials included in this article.
Supplementary Materials
Figure S1 Glucose levels in metabolic test expressed as percentage of basal glucose. (A) Circulating T4 levels in fed conditions. Age = 13 weeks. n = 7 untreated; n = 8 T4‐treated. (B) Glucose concentration in blood during the OGTT expressed as the percentage of basal (time 0) glucose. n = 13 per group. (C) Glucose concentration in blood during the IPPTT expressed as the percentage of basal glucose. n = 7 untreated; n = 8 T4‐treated. (D) Glucose concentration in blood during the ITT expressed as the percentage of basal glucose. n = 12 untreated; n = 13 T4‐treated. (E) Glucose concentration in blood during a 24‐hour fasting period expressed as the percentage of basal glucose. n = 7 untreated; n = 8 T4‐treated. (F) Homeostatic assessment of insulin resistance (HOMA‐IR) index. Age = 12 weeks. n = 7 untreated; n = 8 T4‐treated. UT: Untreated; T4: T4‐treated. Data are represented as the mean ± SEM. * P < 0.05 significantly different from untreated mice. A two tailed t‐test was applied to panels A and F. A Mann–Whitney Rank Sum test was applied to panels B‐E.
Figure S2 Energy intake and histology of the thyroid and the pituitary of in T4‐treated mice. (A) Energy intake divided by body weight. n = 7 untreated; n = 8 T4‐treated. (B) Representative images of the histological analysis o the thyroid and pituitary of T4‐treated and untreated mice. Thyroid; n = 6 untreated; n = 7 T4‐treated. Pituitary; n = 5 untreated; n = 6 T4‐treated. (C) Determination of the α‐GSU of pituitary hormones in the serum of T4‐treated and untreated mice. n = 7 untreated; n = 8 T4‐treated. UT: Untreated; T4: T4‐treated. Data are represented as the mean ± SEM. * P < 0.05 significantly different from untreated mice (two tailed t‐test).
Figure S3 The subcellular localization of MAFA and FOXO1 is not affected by T4 supplementation. (A) Pancreatic islets were isolated from animals treated or not with T4. Determination of messenger RNA (mRNA) levels of genes involved in pancreatic islet metabolism. Values were normalized to islets isolated from untreated mice. n = 6 untreated; n = 5 T4‐treated. (B) Representative images of MAFA and insulin (INS) immunofluorescence staining in pancreases from mice treated or not with T4. Scale bar = 50 μm. n = 5 per group. (C) Representative images of FOXO1 and INS immunofluorescence staining in pancreases from mice treated or not with T4. Scale bar = 50 μm. n = 5 per group. UT: 2 Untreated; T3: T3‐treated; T4: T4‐treated. Data are represented as the mean ± SEM. * P < 0.05 significantly different from untreated mice (two tailed t‐test).
Figure S4 T4 induces a starvation‐like state in the skeletal muscle. (A) Western blots indicating activation of AKT in the skeletal muscle and the liver of T4‐treated mice. Mice were fasted for 16 hours and then injected with insulin (0.75 UI.kg‐1 of body weight) 15 minutes before the end of the experiment. n = 5 untreated; n = 6 T4‐treated. (B) Determination of mRNA levels of genes involved in energy metabolism in the skeletal muscle of mice treated or not with T4. Values were normalized to untreated mice. GLUT2; n = 5 untreated, n = 6 T4‐treated. GK; n = 5 untreated, n = 6 T4‐treated. G6Pase; n = 5 untreated, n = 6 T4‐treated. LPK; n = 5 untreated, n = 6 T4‐treated. PEPCK; n = 5 untreated, n = 6 T4‐treated. GAPDH; n = 6. LDH; n = 5 untreated, n = 6 T4‐treated. PGC1α; n = 6. PGC1β; n = 6. UCP2; n = 5. SREBP1c; n = 5 untreated, n = 6 T4‐treated. (C) Determination of mRNA levels of genes involved in energy metabolism in the liver of mice treated or not with T4. Values were normalized to untreated mice. GLUT2; n = 5 untreated, n = 6 T4‐treated. GK; n = 5. G6Pase; n = 5 untreated, n = 6 T4‐treated. LPK; n = 5 untreated, n = 6 T4‐treated. PEPCK; n = 5 untreated, n = 6 T4‐treated. GAPDH; n = 6 untreated, n = 5 T4‐treated. LDH; n = 5. PGC1α; n = 5 untreated, n = 6 T4‐treated. PGC1β; n = 6. UCP2; n = 6 untreated, n = 5 T4‐treated. SREBP1c; n = 6 untreated, n = 5 T4‐treated. (D) Western blots indicating activation of AMPK in the skeletal muscle and the liver of T4‐treated mice. Mice were fasted for 16 hours prior euthanization. n = 5 per group. (E) Densitometric analysis of the western blots using skeletal muscle extracts shown in Supporting Information Figure S4D. Values were normalized to untreated mice. (F) Densitometric analysis of the western blots using liver extracts shown in Supporting Information Figure S4D. Values were normalized to untreated mice. UT: Untreated; T4: T4‐treated. Data are represented as the mean ± SEM. * P < 0.05 significantly different from untreated mice (two tailed t‐test).
Figure S5 T4 supplementation increased circulating T4, alters organs weight and modulates insulin signalling in immunized RIP‐B7.1 mice. (A) Circulating T4 levels in fed conditions. n = 9 untreated; n = 8 T4‐treated. (B) Organs weight divided by body weight. n = 6 untreated; n = 9 T4‐treated. (C) Western blots showing the amount of phospho‐tyrosine 632 IRS1, total IRS1 and GAPDH, used as loading control, in the skeletal muscle and the liver of T4‐treated mice. Skeletal muscle n = 6 untreated, n = 5 T4‐treated. Liver n = 6 per group. (D) Densitometric analysis of the western blots using skeletal muscle extracts shown in Supporting 3 Information Figure S5C. Values were normalized to untreated mice. (E) Densitometric analysis of the western blots using liver extracts shown in Supporting Information Figure S5C. Values were normalized to untreated mice. UT: Untreated; T4: T4‐treated. Data are represented as the mean ± SEM. * P < 0.05 significantly different from untreated mice (two tailed t‐test).
Figure S6 T4‐treated and untreated immunized RIP‐B7.1 mice show similar degree of insulitis. (A) Representative images of immune infiltrations in T4‐treated and untreated immunized RIP‐B7.1 mice. (B) Insulitis was scored as grade 0–4 according to the percentage of infiltrated islet area (0: 0%; 1: <10%; 2: >10% and <55%; 3: >55% and <75%; 4: >75%). Scale bar = 50 μm. n = 5 per group. UT: Untreated; T4: T4‐treated. Data are represented as the mean ± SEM. * P < 0.05 significantly different from untreated mice (two tailed t‐test).
Table S1 Antibodies used in this study.
Table S2 Primer pair sequences used for quantitative RT‐PCR analysis.